Linking police and health data on road collisions: hospital admissions data
Updated 24 September 2026
Applies to England

© Crown copyright 2026
This publication is licensed under the terms of the Open Government Licence v3.0 except where otherwise stated. To view this licence, visit nationalarchives.gov.uk/doc/open-government-licence/version/3 or write to the Information Policy Team, The National Archives, Kew, London TW9 4DU, or email: psi@nationalarchives.gov.uk.
Where we have identified any third party copyright information you will need to obtain permission from the copyright holders concerned.
This publication is available at https://www.gov.uk/government/statistics/linking-police-and-health-data-on-road-collisions-feasibility-study/linking-police-and-health-data-on-road-collisions-hospital-admissions-data
About this report
This feasibility study describes progress in linkage of police-reported road casualty data with hospital data. It focuses on analysis of STATS19 records linked to Hospital Episode Statistics (HES) admitted patient care (APC) records, building on the earlier linkage of STATS19 to ambulance service data in the South West region. While this remains a work in progress as the linkage method is developed further, it nonetheless provides some insight into potential insight and use of the resulting dataset.
1. Summary
This study has linked police casualty data from STATS19 with hospital admission records for England over a 25-year period. This work is a feasibility study, using probabilistic linkage methods. The resulting linked data provide insight into the relationship between police-reported casualties and hospital inpatients, but the links are not perfect. Results should be interpreted as evidence of broad patterns and analytical potential, not as a definitive record. However, this work shows that:
- National linkage is feasible using a probabilistic approach, and produces a substantial volume of high-confidence links, although limitations of the method should be kept in mind when analysing the results.
- Linked data provides a means of estimating STATS19 completeness, particularly for casualties requiring hospital admission. Overall, around half of all HES road traffic inpatient records were linked to STATS19.
- Hospital data offers a further perspective on injury severity, complementing police assessments. Overall, there is a reasonable degree of correspondence between police severity and injury classification and the additional hospital-data based measures
- The linked dataset creates opportunities for richer road safety analysis, particularly around injury outcomes, healthcare burden and casualty characteristics that are not available in STATS19 alone.
2. Introduction
Currently, the main dataset for monitoring trends and patterns in road casualties in Great Britain is based on data collected by police, via a system known as STATS19. This data provides the basis for DfT’s published road casualty statistics. While overall the police reported data provides a valuable dataset for analysis:
- it has long been known that STATS19 is not a complete record of non-fatal road collisions (even for those that are in scope)
- STATS19 lacks detail on post-collision outcomes, including detail clinical severity
Healthcare datasets, such as inpatient admissions, can provide information on clinical diagnoses, length of stay and, where linked across datasets, later outcomes. However, hospital data generally lack the detailed collision circumstances, vehicle information and road-environment variables available in STATS19.
Routinely linking police data with other datasets, notably health data, would help to address the limitations of STATS19 and provide an enhanced dataset for analysis. However, there are challenges as set out by the RAC Foundation in their report ‘Joining the Dots’.
The UK road safety strategy, published January 2026, sets out a commitment to making the secure linkage of police-recorded collision and healthcare data a shared priority across departments, with a pilot phase using the Pre-hospital Research and Audit Network (PRANA) to establish a foundational dataset.
An initial feasibility study focussed on linkage of STATS19 data to regional ambulance data. This report covers work to link STATS19 to hospital admissions data for the whole of England, over a 25 year period, as the next stage of the ongoing ‘Linking Police and Hospital Data’ (LPHD) project.
2.1 Linking Police and Hospital Data on road casualties (LPHD) project objectives
The LPHD project aims to retrospectively link STATS19 data to available healthcare datasets to improve the quality of published road safety data and statistics and ultimately support the development of improved road safety policies, with the specific objectives including:
- objective 1: to assess completeness of police recorded data and whether this varies over time and by police force to validate trends and patterns
- objective 2: to assess accuracy of injury severity recorded by police: this could inform guidance provided to reporting officers, as well as publication of statistics based on clinically-recorded severity
- objective 3: to facilitate new insight from road casualty data (including published statistics) including on longer-term outcomes and cost of collisions
2.2 Aims of this study
This study represents the second phase of the LPHD project, building on the initial study which establish a regional linkage within a secure data environment. It aims to:
- demonstrate feasibility of linkage between STATS19 and a national level NHS dataset
- use the results of this linkage to derive insights into the completeness of STATS19 reporting for those casualties which require admission to hospital (supporting LPHD objective 1)
- compare police-recorded injury severity with clinical coding available within HES (supporting LPHD objective 2)
- explore potential analysis of the linked data that may address gaps in the STATS19 data (supporting LPHD objective 3)
This remains a work in progress, while the linkage methodology is further developed and reviewed, but aims to illustrate the value and potential of the linked data.
3. Linkage method overview
This section presents a brief overview of the data linkage, which requires a probabilistic (‘fuzzy matching’) approach in the absence of common identifiers in the two datasets. Further details are provided in the separate annex. It addresses the aim to ‘demonstrate feasibility of linkage between STATS19 and a national NHS dataset’
3.1 Data used for linkage
Hospital admission data
The hospital dataset used for this linkage is an extract of the HES admitted patient care (APC) provided to PRANA by NHS England’s Data Access Service, which contains details of all inpatient and day-case admissions to NHS hospitals in England. The data analysed contains records for all admissions with an external cause code related to a transport accident, based on the ICD-10 classification, for data years from 2000 to 2024.
Police casualty data
The police data used for this study is from the STATS19 dataset, provided by DfT. Details of the collection and coverage of STATS19 are available from the [background quality information] https://www.gov.uk/guidance/road-accident-and-safety-statistics-guidance). For this study, it is important to note that STATS19 covers incidents on the public highway, and exclude some casualty types including suicides. Full details of the coverage of STATS19 are set out in the STATS20 guidance.
3.2 Linkage approach
As STATS19 and HES do not contain a common unique identifier, a probabilistic record linkage methodology was used. Hospital inpatient records do not generally contain the collision location, so compared with the linkage to ambulance data, the method relies more heavily on common demographic and timing variables, home postcode or distance from home to collision, and information inferred from ICD coding including the road user type and whether other vehicles were involved in the collision.
This approach identifies potential matches based on a combination of common variables and then assigns a score reflecting the likelihood that records refer to the same casualty. The linkage was undertaken in a series of stages, with full details in the accompanying methodology report.
Creation of candidate matches. To reduce the number of potential record pairs, an initial set of plausible candidate links was created for further assessment using variables that are expected to be recorded consistently in both datasets. HES admissions were compared with STATS19 casualties where:
- sex was the same in both datasets;
- age differed by no more than two years; and
- the hospital admission occurred on either the same day as the reported collision or on the following day.
Probabilistic matching. Each candidate link was evaluated using a range of matching variables available in both datasets. These included:
- age and sex;
- timing of the collision and hospital admission;
- casualty and road-user type;
- indicators of whether another vehicle was involved in the collision;
- injury severity information in STATS19; and
- geographic information, including degree of agreement on casualty home postcode (where available) or otherwise the proximity of the casualty’s home postcode to the collision location.
Candidate links were evaluated using a weighted probabilistic linkage algorithm (a Fellegi-Sunter type approach), with weights for each variable calculated based on the degree of agreement. Agreement between the STATS19 and HES records increased the linkage score, while disagreement reduced it. Stronger indicators of a true match, such as close geographical proximity and exact match on postcode information, contributed more heavily to the overall score than variables considered less discriminating.
Selection of final matches. An overall linkage score was calculated for every candidate pair by combining the weights from all matching variables. For each hospital admission record, the candidate with the highest linkage score was identified as the best potential match. Minimum score thresholds were then applied to exclude uncertain matches. Different thresholds were used depending on whether postcode information was available, reflecting the additional confidence provided by postcode agreement. Candidate pairs that did not meet the relevant threshold were not linked.
Final links and link confidence. The resulting dataset contains the highest-scoring match for each linked hospital admission and forms the basis of the analyses presented in this report. As with any probabilistic linkage, missed matches and false matches are unavoidable. Additional variables were added to reflect the level of confidence in the selected link representing the same casualty, based on the score and the proximity of the next-best candidate, so that different levels of linkage quality can be used for different analyses. High-confidence links may be suitable for a wider range of descriptive analysis, while lower-confidence links may be more appropriate for aggregate epidemiological patterns and trends.
4. Results: feasibility of linkage
This section provides a summary of the overall linkage results and quality, demonstrating the feasibility and limitations of the chosen approach.
The main findings include:
- A substantial number of road traffic related HES admission records could be linked to a STATS19 casualty record, and overall there are around 400,000 linked records for analysis
- High confidence (better quality) linkages were higher where postcode information was available
- Overall linkage rates have fallen over time; this is likely to reflect several factors
4.1 Overall linkage rates
Road traffic inpatient admissions in HES can be further subdivided into those admitted following traffic collisions, or other types of collision, based on the cause code. Analysis of the linked data (Table 1) suggests that:
- overall, around one-third of all HES road transport inpatient records are linked to STATS19, rising to around half for traffic incidents considered to be within the scope of STATS19
- a small proportion of linked records are to cases which are coded as non-traffic incidents in HES; this could reflect miscoding in either dataset, or inaccurate linkage.
The remainder of this report will focus on those records in HES which relate to road traffic admissions, as these are most closely aligned to the coverage of STATS19 data.
Table 1: HES inpatient records linked to STATS19, by collision type as derived from HES cause code, England 2000 to 2024.
| Collision type | Linked | Not linked | Total | Percent linked |
|---|---|---|---|---|
| Traffic | 371,000 | 364,000 | 735,000 | 51% |
| Non-traffic | 29,000 | 228,000 | 257,000 | 11% |
| Boarding or alighting | 2,000 | 47,000 | 49,000 | 4% |
| Unspecified | 11,000 | 104,000 | 115,000 | 10% |
| Total | 413,000 | 743,000 | 1,156,000 | 36% |
4.2 Linkage by linkage confidence
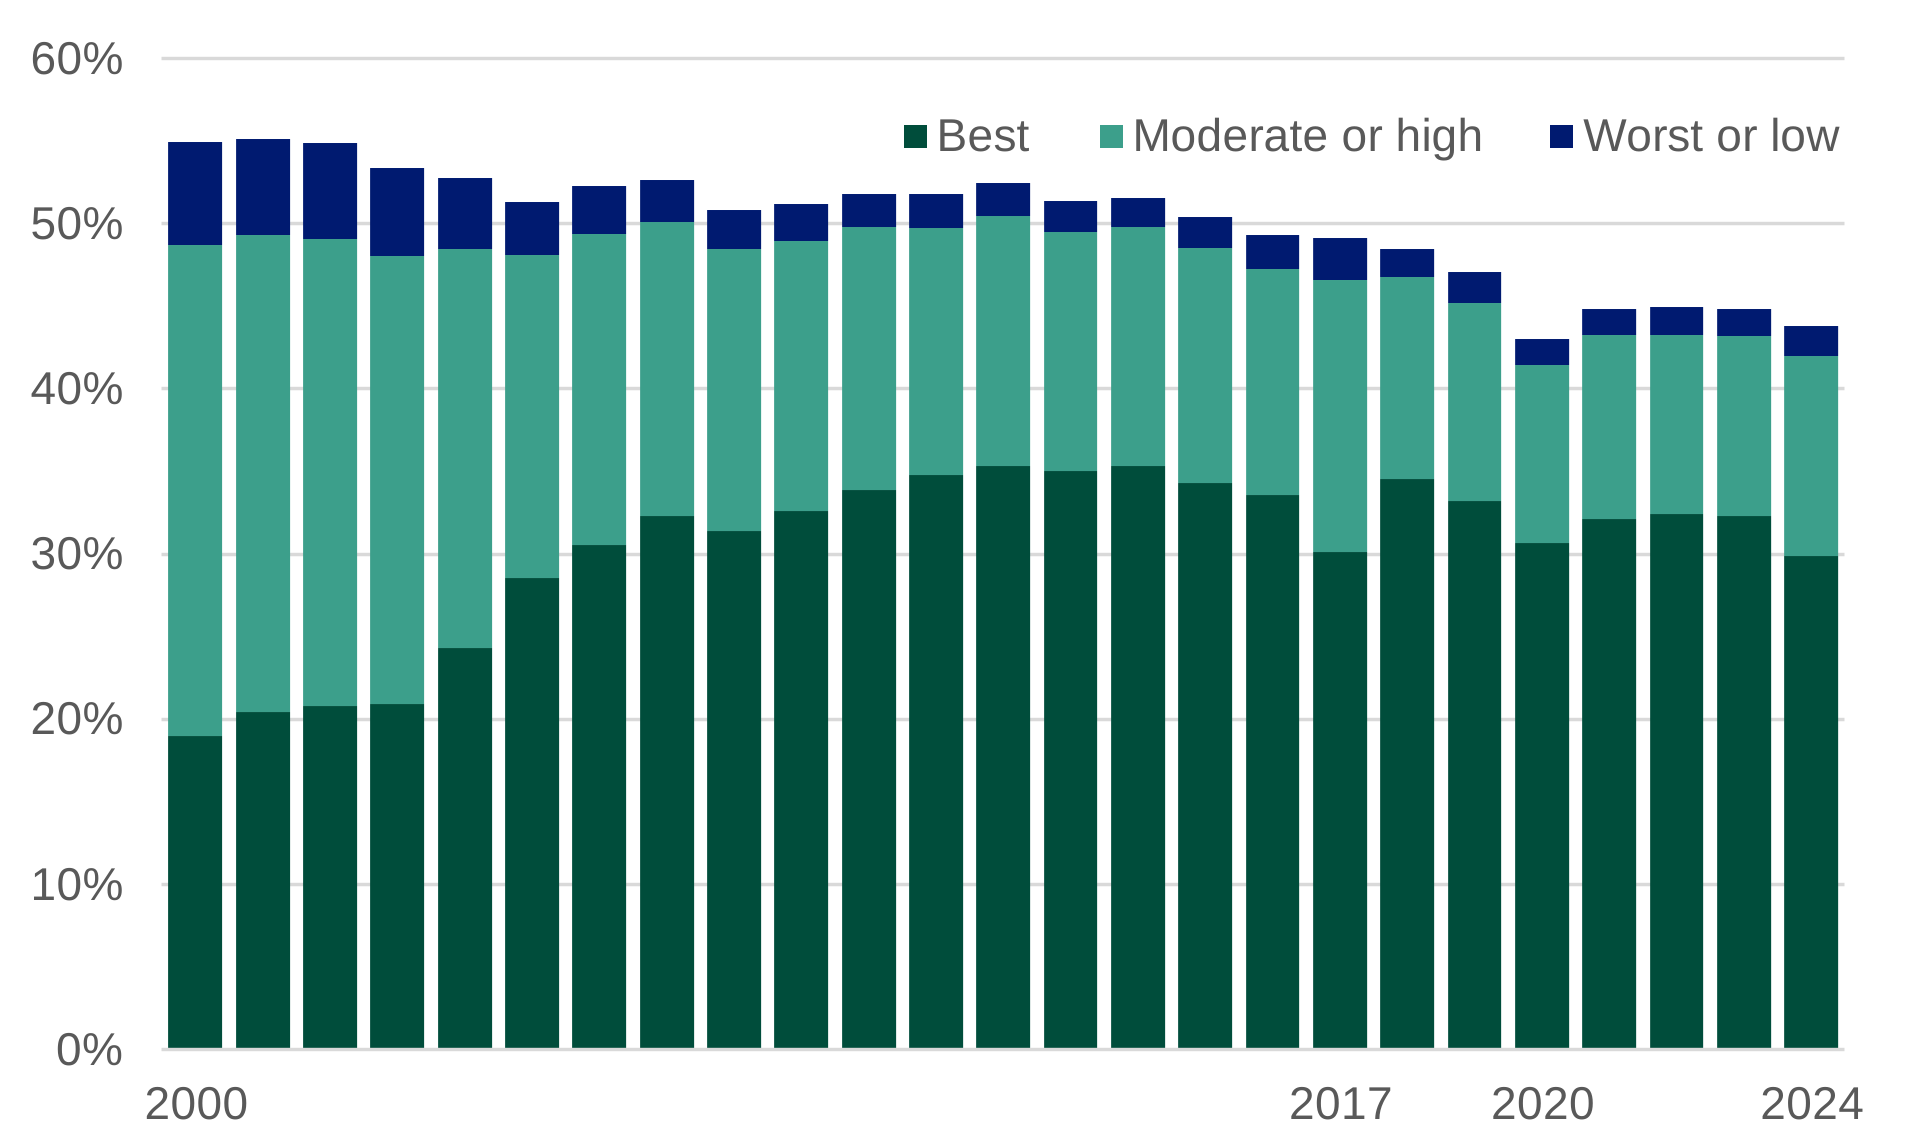
Full details of the linkage method are outlined in the separate methodology annex. Table 2 summarises overall linkage, by level of agreement and chart 1 shows trends over time. The link quality assessment is based on the linkage score, and the distance from the next best candidate link – a higher score, and a bigger distance from the next best candidate indicate higher confidence that the linkage is correct.
In the absence of data for a full clerical review, an indication of confidence can be provided by the proportion of candidate links within each category that are deemed to be matches (this is an approximation for the chance of a candidate link being deemed a match ‘by chance’). A higher proportion is likely to be associated with fewer false positives.
Changes over time should be interpreted cautiously because they may reflect real reporting differences, changes in hospital coding, changing availability of fields, or changes in linkage quality.
This shows that:
- the majority of links are of relatively high confidence, with more than half being in the ‘best quality’ category which includes agreement on postcode.
- the proportion of higher quality links increases over time; this reflects an increase in the proportion of STATS19 records with a valid postcode present, from under half of records in 2000 to around 90% or records from 2015 onwards (except in 2017)
- the lower quality links are more prevalent in the first few years, where postcode was less complete in STATS19.
Further analysis within this report will exclude links in the two lowest quality groups, which means that the overall linkage rates presented in sections 2 and 3 below are slightly lower than shown in table 1.
Table 2: Proportion of HES road traffic admissions linked to STATS19, by linkage quality assessment, England 2000 to 2024
| Link quality | Description | Number of records | Proportion of links |
|---|---|---|---|
| Worst | Lowest agreement score, STATS19 postcode not available. More than half of candidate links deemed non-links | 7,900 | 2% |
| Low | STATS19 postcode not available. 50% to 75% probability that a candidate is deemed a link | 13,000 | 3% |
| Moderate | STATS19 postcode not available; 75% to 90% probability that a candidate will be deemed a link | 53,000 | 14% |
| High | Includes highest-scoring candidate links with no postcode, and others with partial postcode agreement. 90% to 95% of candidates are deemed links | 75,800 | 20% |
| Best | Highest agreement score, including match on postcode. Over 95% of candidates are deemed links | 221,700 | 60% |
Chart 1: Proportion of HES road traffic inpatient admissions linked to STATS19, by linkage quality assessment and year, England 2000 to 2024
4.3 Assessment of linkage quality
The linked dataset is created using probabilistic methods. Some true links will be missed and some linked records may be incorrect; a definitive linkage cannot be achieved. However, it is likely that the linkage results still have value for population-level analyses, as presented below.
A full validation of the linkage quality is difficult in the absence of a dataset of ‘true’ links, or personal identifiers (such as name, data of birth, address or NHS number) which could be used for a definitive validation. However, for a small number of records which appear in both the South West ambulance service (SWAST) dataset used in the initial feasibility study, and in the HES data used in the second phase, it is possible to compare linkage results. This comparison provides an indication of potential true and false positive matches; further details are provided in the methodology annex.
Previous linkage of STATS19 and HES was carried out by the NHS on behalf of DfT, with a summary available in data table RAS4101. This work used a rules-based fuzzy matching approach; the linkage rates presented here are marginally higher than in the previous work, but with a broadly similar trend over time. This suggests that the work presented here is of a comparable quality to what has been achieved previously, though as a feasibility study, further work is required to fully assess the linkage quality and it is possible that this may result in some improvement.
5. Results: completeness of STATS19 data
This section addresses the aim to derive insights into the completeness of STATS19 reporting for those casualties which require admission to hospital, by analysing the factors associated with different linkage rates.
The proportion of road traffic casualties in the HES data that are linked to STATS19 can be considered as a proxy for the level of reporting to police, as, all things being equal, it might be expected that all such casualties admitted to hospital should be in scope of the police reporting. However, it has long been known that not all non-fatal casualties are reported to police; this linkage provides some means of quantifying this.
However, a lower HES to STATS19 linkage rate should not automatically be interpreted as under-reporting in STATS19. The result may also reflect mismatches resulting from the linkage approach or data limitations, or scope differences. Some HES road transport records are outside the scope of STATS19, and some may not contain enough information to classify scope confidently (or be miscoded).
The linked data can be broken down to show linkage rates by any variables that are coded within, or can be derived from, HES data. In this section, a selection of variables are explored. This includes an estimate of clinical severity, based on the Maximum Abbreviated Injury Scale (MAIS), coded from hospital diagnoses using a mapping from ICD-10 codes [footnote 1].
The main findings include:
- Around half of HES road traffic inpatients were linked to STATS19, though this varied greatly by road user type, being relatively higher for pedestrians and lower for pedal cyclists. This suggests that, overall, pedal cyclist casualties are likely to be under-represented in police data
- Linkage rates were notably lower for single vehicle collisions, particularly those involving buses or pedal cycles
- In multi-vehicle collisions linkage rates varies less by vehicle type and were similar for pedal cycles and other vehicles
- Other factors associated with a higher chance of being linked to STATS19 included clinical injury severity, number of injuries, and length of spell in hospital
5.1 Linkage rates by year
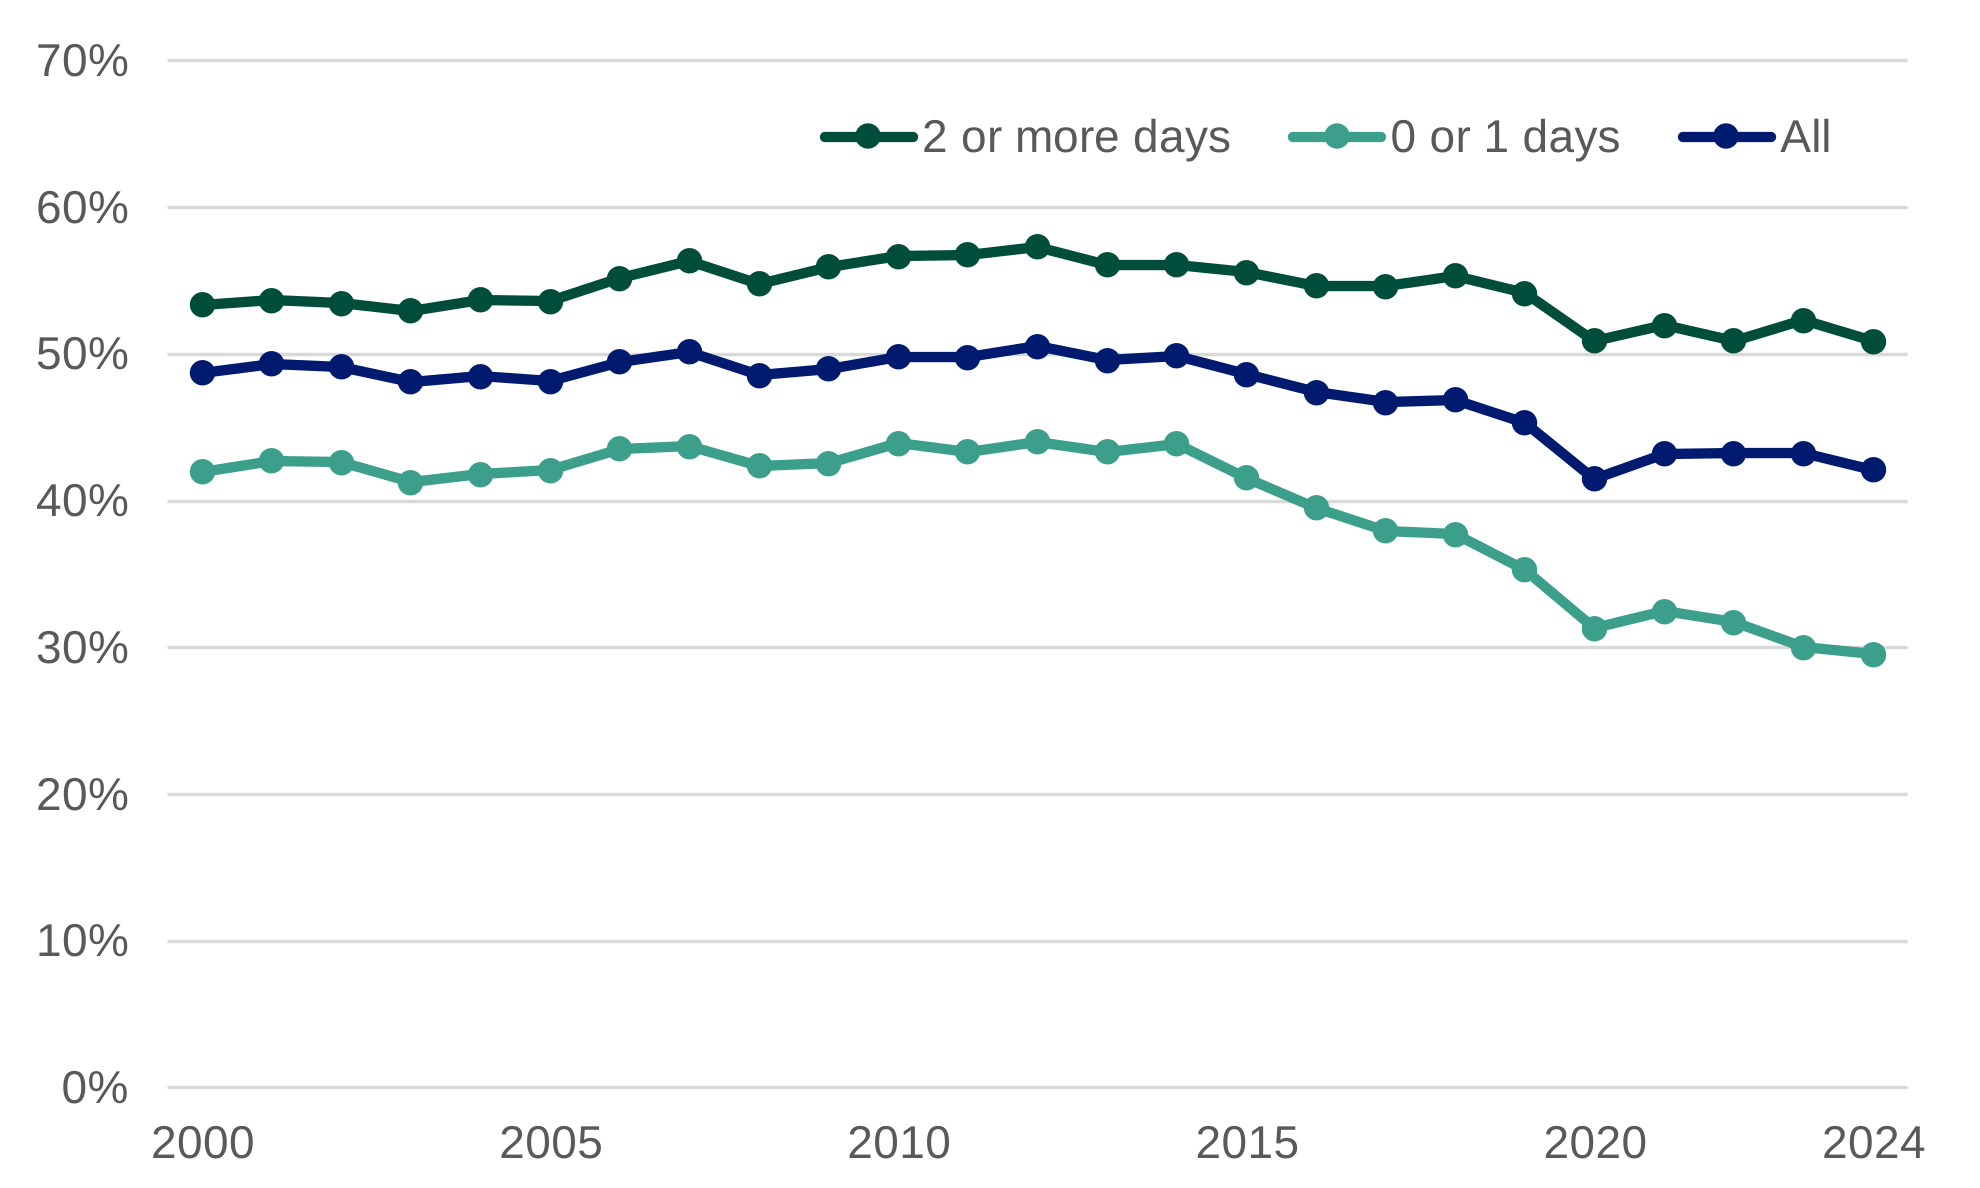
Over the period studied (2000 to 2024), around half of HES road traffic inpatient admissions were linked to STATS19 – the overall linkage rate is 48%, if the lower quality matches are excluded.
Chart 2 shows how the linkage rate varies by year, with a fall from 49% in 2000 to 42% in 2024. However, this should not be assumed as showing a decline in police reporting; there are several reasons why the linkage rate may change over time including, for example, linkage quality and hospital practices.
For example, the chart also shows the linkage rates for spells in hospital lasting less than 2 days, compared with 2 or more days. This shows a notably different pattern, with a clear decline in the linkage rate for those patients admitted for a shorter period, from around 2015, and a more stable linkage rate for 2 or more day spells.
This illustrates the need to exercise caution in drawing conclusions from the high-level trends.
Chart 2: Proportion of HES road traffic inpatient admissions linked to STATS19, by year and duration of spell, England 2000 to 2024
5.2 Linkage rates by road user and collision type
Table 3 shows the number and proportion of records linked by road user type, as derived from the cause code recorded in the HES data. This shows that:
- as in STATS19, pedestrians, pedal cyclists, car occupants and motorcyclists account for the most casualties.
- the proportion of HES records linked to STATS19 varies notably, being highest for pedestrians (61%) and lowest for pedal cyclists (23%).
Table 3: HES road traffic inpatient records linked to STATS19, by road user type, England 2000 to 2024.
| Road user type | Linked | Not linked | Total | Percent linked |
|---|---|---|---|---|
| Pedestrian | 88,400 | 57,000 | 145,400 | 61% |
| Car | 140,700 | 114,200 | 254,900 | 55% |
| Motorcycle | 72,500 | 68,000 | 140,400 | 52% |
| LGV | 4,400 | 4,800 | 9,200 | 47% |
| HGV | 2,100 | 2,800 | 4,900 | 43% |
| Other or unknown | 5,700 | 15,100 | 20,800 | 27% |
| Bus | 1,700 | 4,900 | 6,600 | 26% |
| Pedal cycle | 35,100 | 117,900 | 153,000 | 23% |
| Total | 350,500 | 384,700 | 735,200 | 48% |
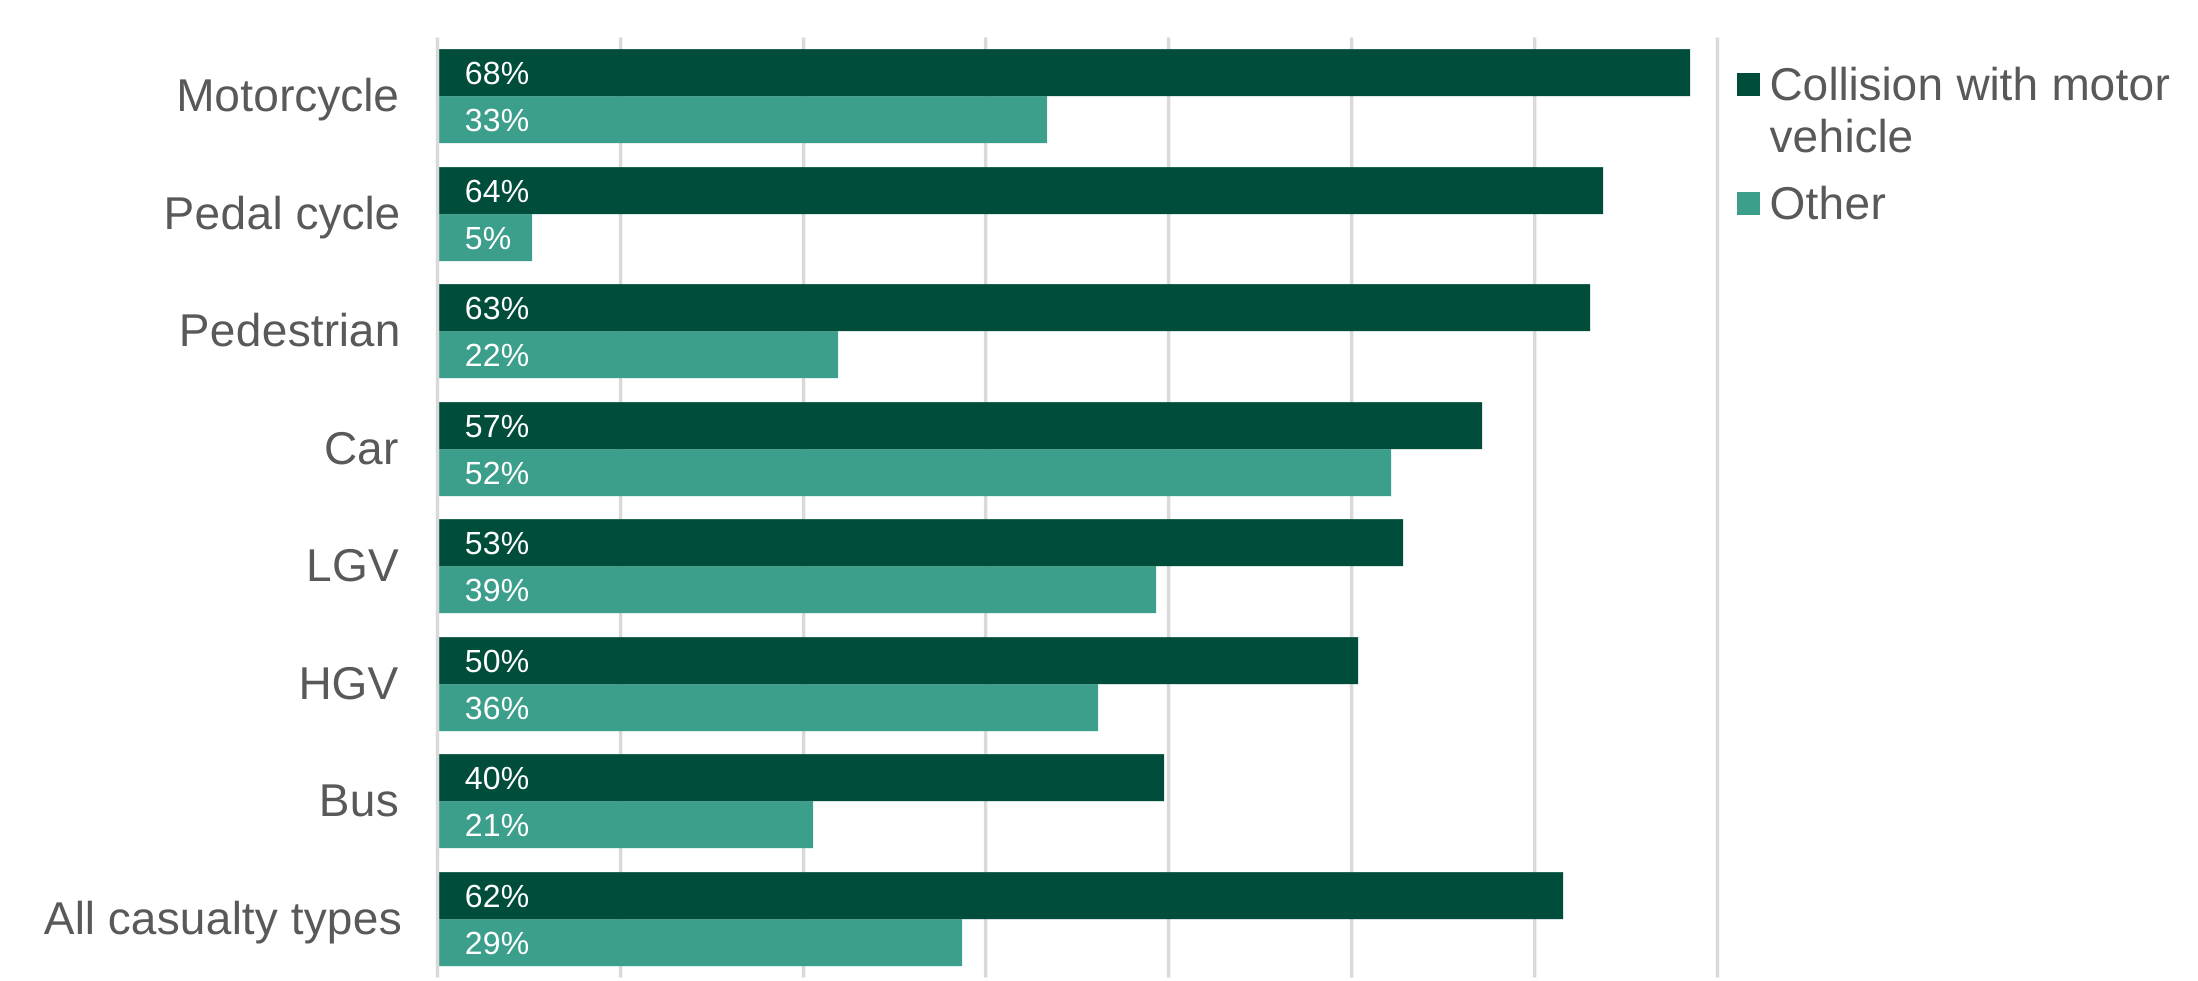
Table 4 and Chart 3 shows the proportion of records linked by road user type and the type of the collision, which can also be derived from the HES cause code:
- in collisions with a motor vehicle, linkage rates are highest for vulnerable road users – motorcyclists (68%), pedal cyclists (64%) and pedestrians (63%)
- other types of collision have lower linkage rates, particularly for pedal cyclists (this explains the overall linkage rate for pedal cyclists, as more than half of pedal cyclists records in HES have collision type ‘none’)
Table 4: Percentage of HES road traffic inpatient records linked to STATS19, by road user type and collision type, England 2000 to 2024.
| Casualty type | Motor vehicle | Non-motor vehicle | Object | None | Other or unknown | All collision types |
|---|---|---|---|---|---|---|
| Pedestrian | 63% | 27% | 0% | 0% | 17% | 61% |
| Car | 57% | 49% | 56% | 51% | 41% | 55% |
| Motorcycle | 68% | 50% | 47% | 29% | 32% | 52% |
| LGV | 53% | 38% | 49% | 34% | 24% | 47% |
| HGV | 50% | 38% | 43% | 37% | 17% | 43% |
| Bus | 40% | 42% | 42% | 20% | 15% | 26% |
| Pedal cycle | 64% | 13% | 10% | 4% | 9% | 23% |
| All casualty types | 62% | 28% | 50% | 20% | 28% | 48% |
Chart 3: Percentage of HES road traffic inpatient records linked to STATS19, by road user type and whether collision was with a motor vehicle, England 2000 to 2024.
5.3 Linkage rates by age group and sex
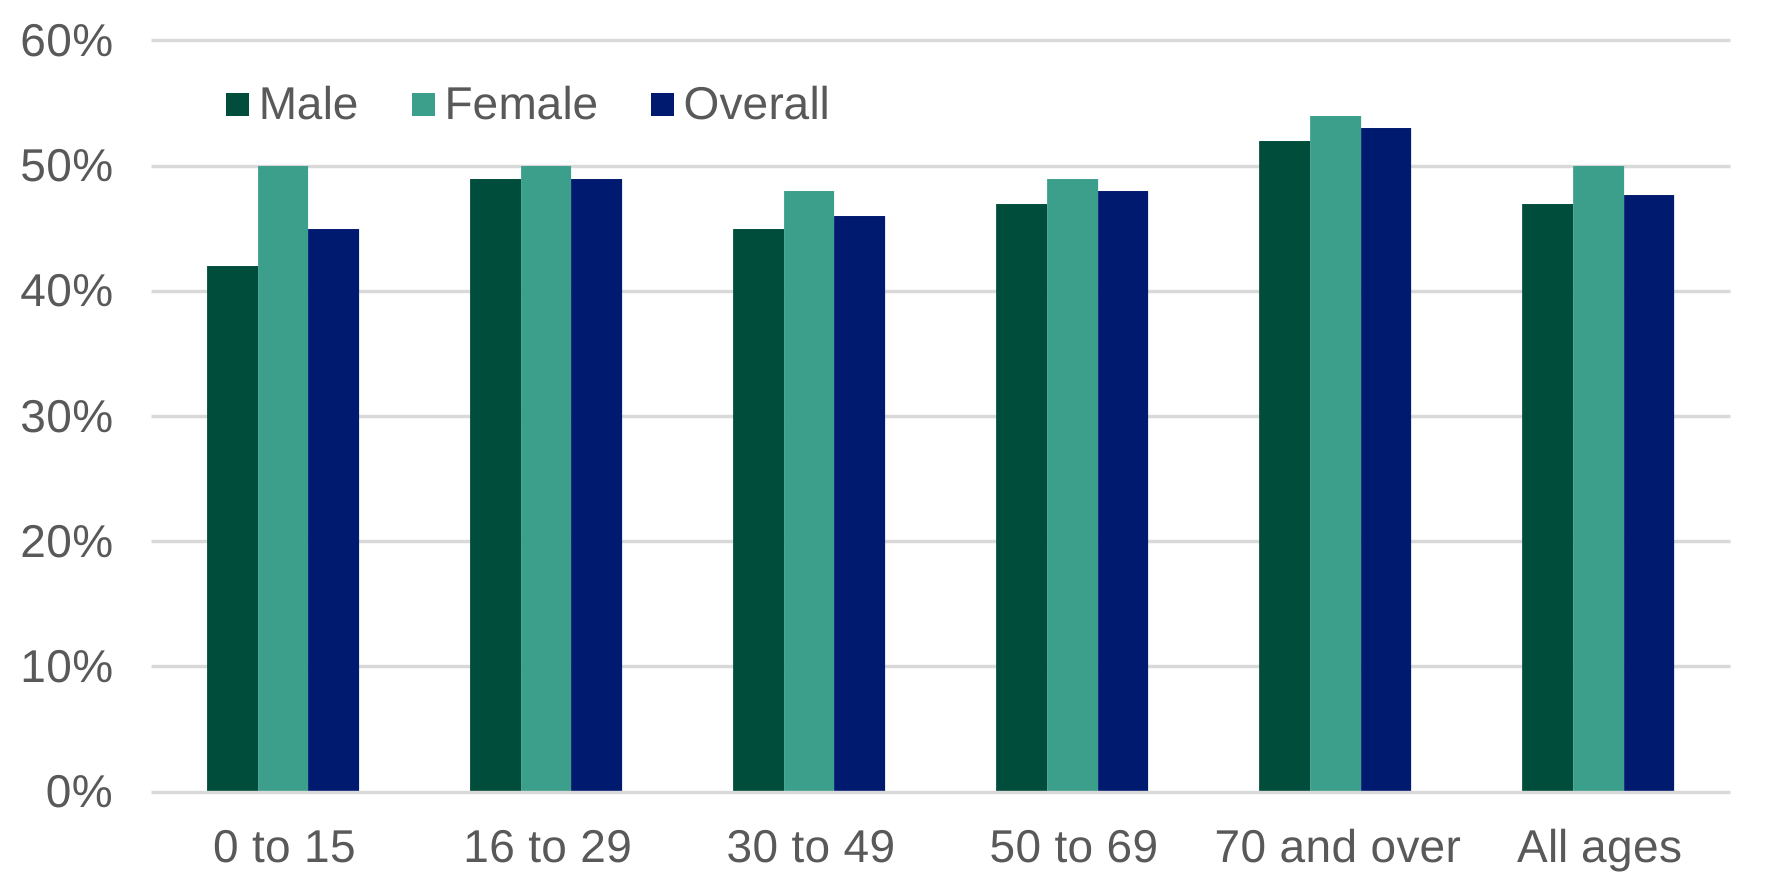
Chart 4 shows the number and proportion of HES records linked by age group and sex:
- overall linkage rates are slightly higher for females (50%) than males (47%), with the greatest difference for children (50% compared with 42%)
- linkage rates broadly increase with age, and are highest for those aged 70 and over (53%).
- it is likely these patterns reflect associations with other variables (for example older casualties and females are relatively more likely to be pedestrians) and there appears to be relatively little variation in linkage rates by age and sex.
Chart 4: Percentage of HES road traffic inpatient records linked to STATS19, by age group and sex, England 2000 to 2024.
5.4 Linkage rates by injuries and spell duration
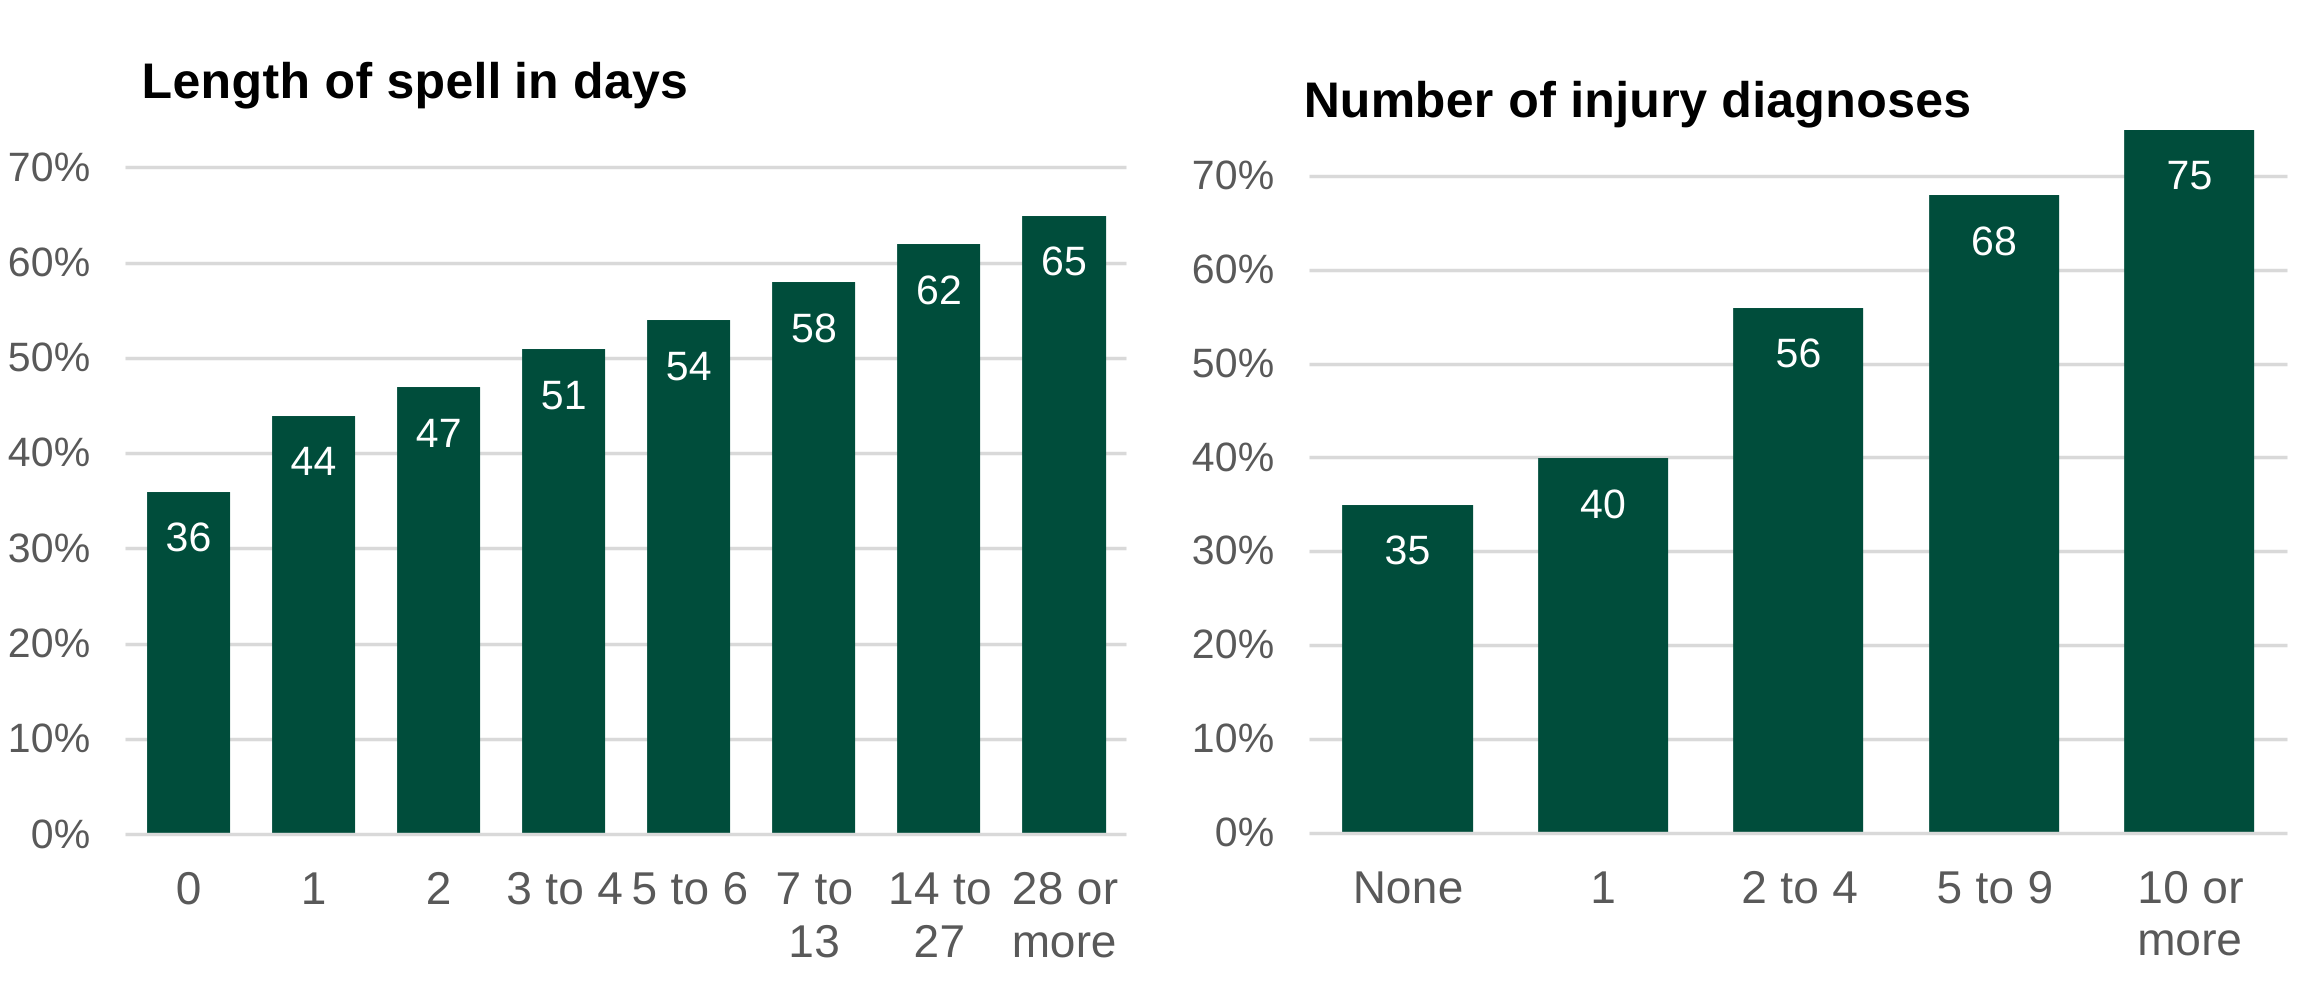
The HES data provides several variables which may be associated with relatively more seriously injured casualties, including the number of injury diagnoses and length of spell in hospital (though other factors can influence these variables, for example spell length may reflect age or pre-existing conditions as well as injuries sustained in the RTC). Chart 5 shows that:
- linkage rates increase with length of spell in hospital, from 36% of those with no overnight stay (0 days) to 65% of those spending 4 or more weeks in hospital
- similarly, the linkage rate is lower for records with no injury diagnosis (35%) and increases with number of injuries
Chart 5: Percentage of HES road traffic inpatient records linked to STATS19, by i) duration of hospital spell and ii) number of injury diagnoses recorded, England 2000 to 2024.
5.5 Linkage by police force area
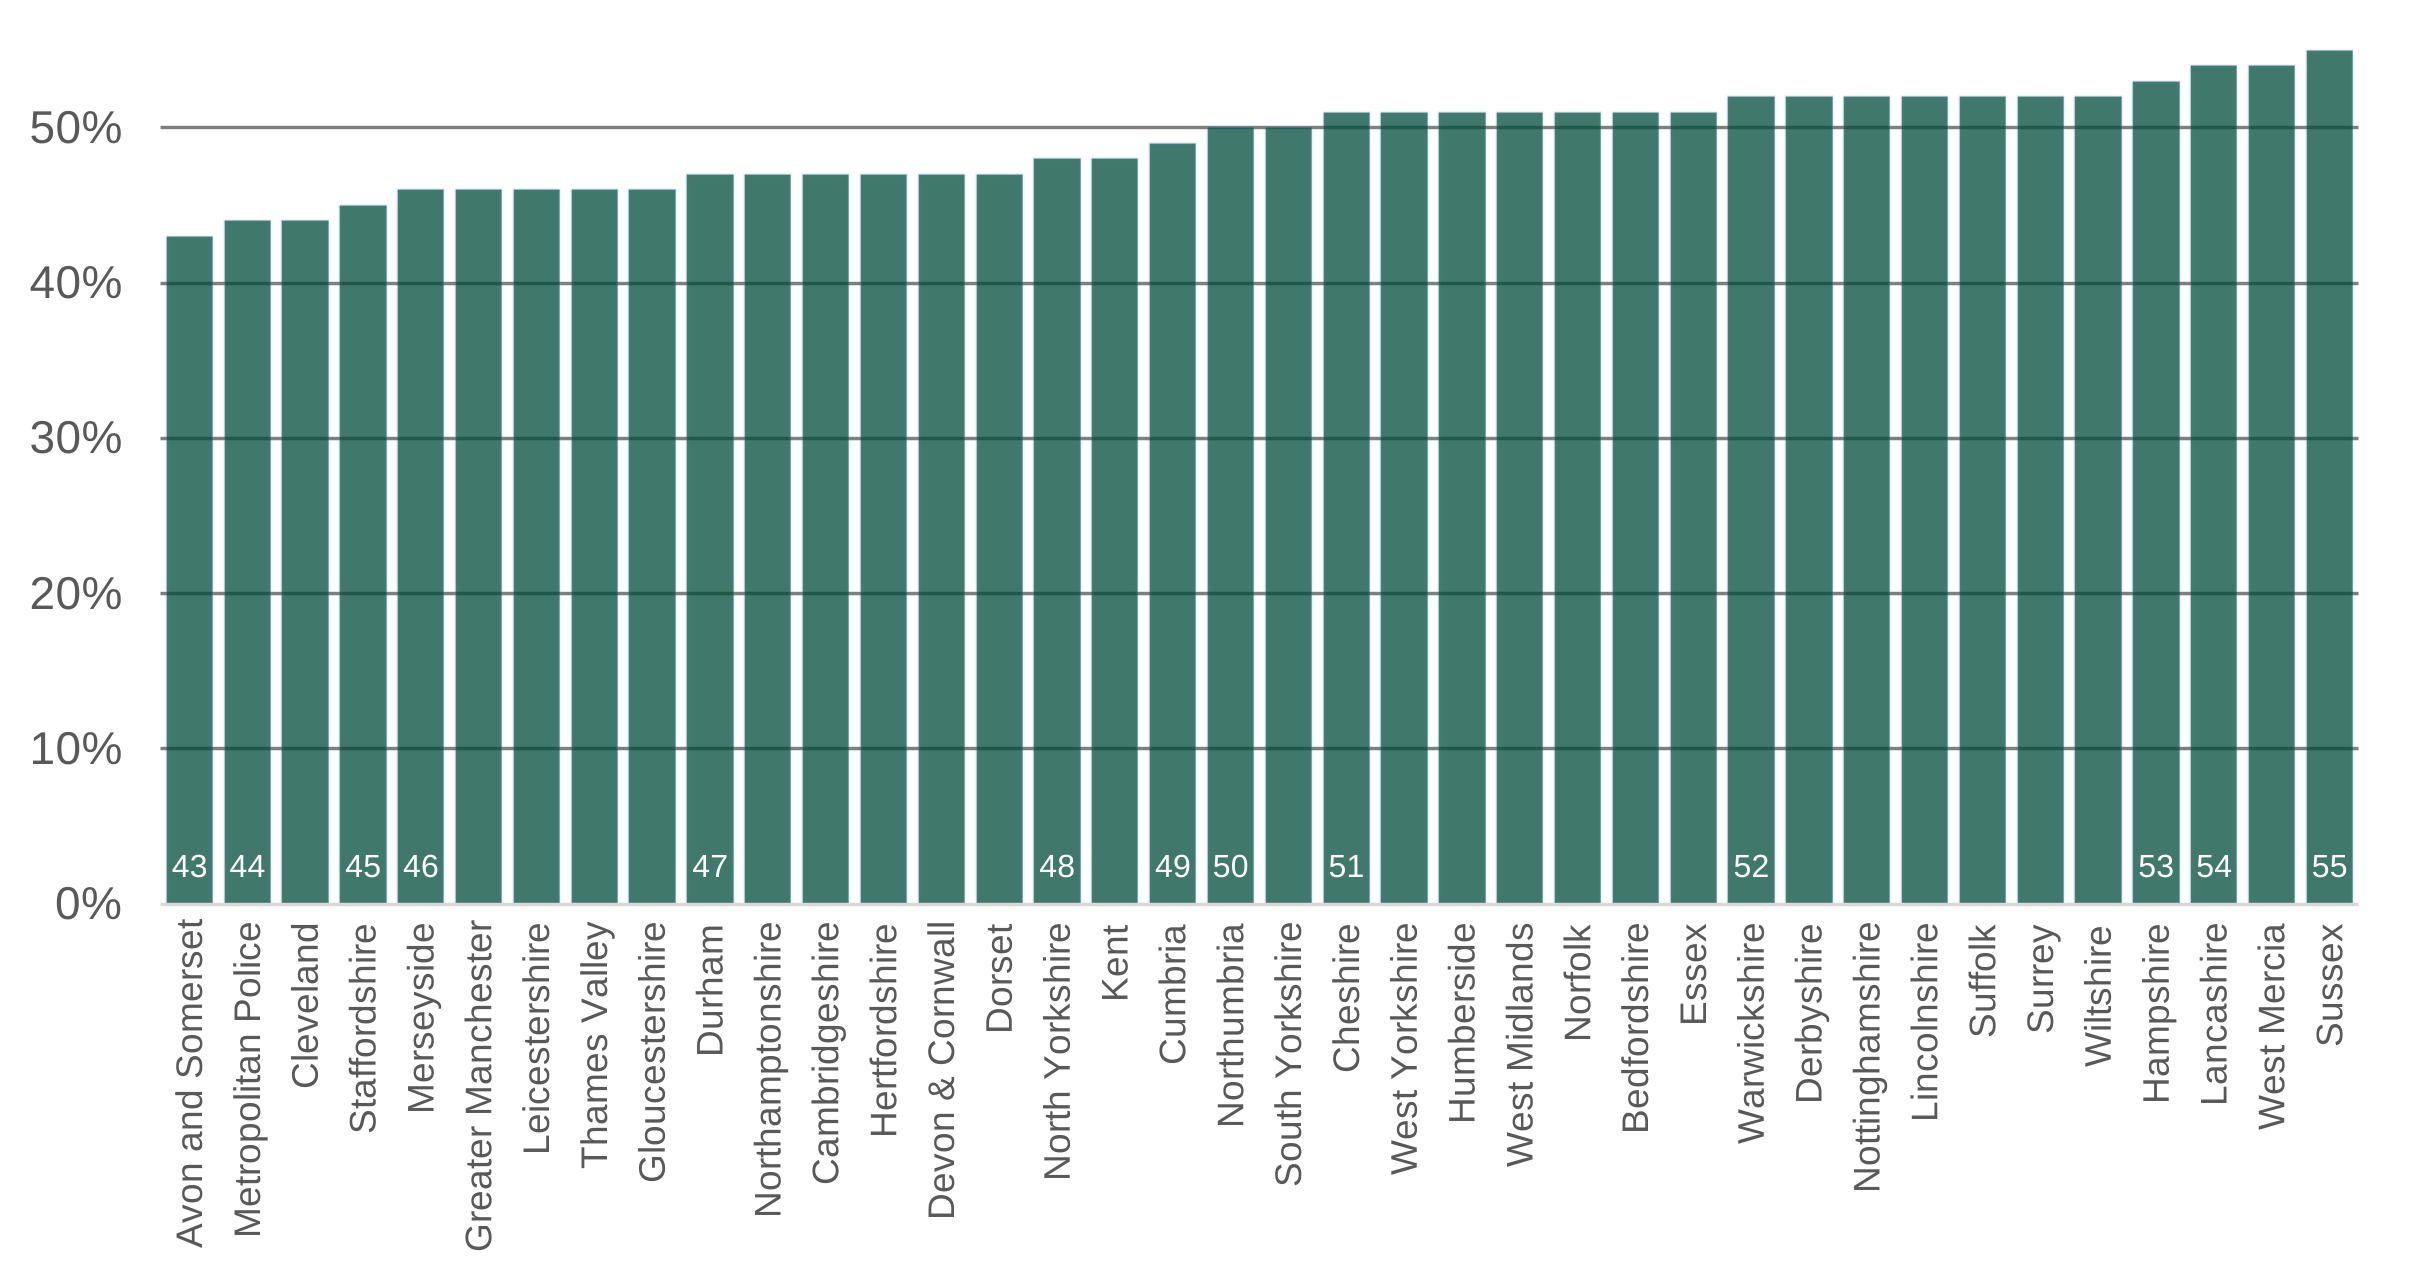
While HES does not contain collision location, geographical variables can be coded based on the patient postcode. For example, Chart 5 shows the variation in linkage rate by police force area of residence. As most collisions occur relatively close to home, this is likely to be a reasonable proxy for linkage rates by police force of collision. This shows:
- there is relatively little variation by police force, from 43% to 55% (compared with the England average of 48%)
- lower linkage rates for forces where there are known STATS19 reporting issues (Avon and Somerset, Staffordshire) may to some extent reflect this missing police data
- lower linkage rates for some large metropolitan area forces (Metropolitan police, Merseyside, Greater Manchester) – this may be associated with the nature of the collisions in these areas, or limitations of the linkage methodology
Chart 6: Percentage of HES road traffic inpatient records linked to STATS19, by police force area of patient residence, England 2000 to 2024.
5.6 Factors associated with linkage rates
The above sections illustrate the association between linkage rates and selected HES variables, taking each variable in turn. These results suggest that linkage rates are influenced not only by individual characteristics, but also by combinations of characteristics. To explore the effect of variables when accounting for other factors, a statistical (logistic regression) model can be fitted to the data [footnote 2]. The final model included interaction terms between casualty type and collision type, and between year and hospital spell duration.
Table 5 shows a summary of the model results, highlighting the factors associated with increased odds of a HES inpatient record being linked to STATS19. These findings highlight that linkage performance varies across different casualty groups and circumstances, rather than being explained by any single factor in isolation. Overall, the model findings support the main points illustrated in the preceding sections. In summary:
- linkage rate increases sharply with increasing injury count.
- motorcycle, pedal-cycle and pedestrian casualties are more likely to be linked (when the interaction between casualty and collision type is also included).
- strong interaction effects were observed for pedestrian, pedal cycle and motorcycle casualties involved in non-motor vehicle incidents, where the odds of successful linkage were substantially lower than would be expected based on the individual effects of casualty type and collision type alone.
- linkage rates are lower for the post-covid period (years 2020 to 2024, which were grouped in the model). The negative association between shorter hospital stays and successful linkage became more pronounced in recent years, particularly from 2020 onwards.
Table 5: Factors associated with i) higher odds of linkage, ii) lower odds of linkage and iii) interaction effects compared to the reference category (male car occupant, aged 30 to 49, 1 injury, 2+ days in hospital, MAIS 1 or 2, 2000 to 2005)
| Factor associated with higher odds of linkage | Value | Odds ratio (95% confidence interval) |
|---|---|---|
| Number of injuries | 6 or more | 2.59 (2.52, 2.65) |
| Number of injuries | 4 or 5 | 1.98 (1.94, 2.02) |
| Number of injuries | 2 or 3 | 1.48 (1.47, 1.50) |
| Casualty type | Motorcycle | 1.39 (1.37, 1.42) |
| Age group | 0 to 15 | 1.33 (1.30, 1.35) |
| Factor associated with lower odds of linkage | Value | Odds ratio (95% confidence interval) |
|---|---|---|
| Casualty type | Other | 0.36 (0.34, 0.37) |
| Casualty type | Bus | 0.52 (0.47, 0.57) |
| Spell duration | 0 days | 0.74 (0.71, 0.76) |
| Collision type | Not motor vehicle | 0.75 (0.74, 0.76) |
| Number of injuries | None | 0.76 (0.74, 0.78) |
| Interaction effect (selected) | Value | Odds ratio (95% confidence interval) |
|---|---|---|
| Casualty type × collision type | Pedal cycle: not motor vehicle | 0.04 (0.04, 0.04) |
| Casualty type × collision type | Pedestrian: not motor vehicle | 0.23 (0.22, 0.25) |
| Casualty type × collision type | Motorcycle: not motor vehicle | 0.30 (0.29, 0.30) |
| Casualty type × collision type | Bus: not motor vehicle | 0.52 (0.46, 0.59) |
| Year group × spell duration | 2020 to 2024: 0 days | 0.63 (0.60, 0.66) |
6. Results: injury recording
This section presents results related to the aim to compare police-recorded injury severity with variables available within HES, including based on the ICD-10 coding of injuries.
It should be kept in mind that police-recorded severity and hospital-based measures relate to different concepts. STATS19 severity is a reporting classification for road casualty statistics, while hospital measures relate to care, diagnosis, admission and treatment. In addition, the use of ICD-10 codes within the HES data has limitations, with other healthcare datasets – such as trauma data – providing more detailed measures.
The main findings include:
- indicators available in HES support the broad validity of police severity classifications; the majority of STATS19 casualties linked to admitted patient records are coded as seriously injured (and those coded serious experienced longer hospital stays than slight casualties)
- However, there is variation in HES primary diagnosis within the STATS19 most severe injury categories
- Some casualties classified by police as slight experienced longer hospital stays, indicating that police-recorded severity is not a perfect proxy for medical outcome.
6.1 Police recorded severity by hospital injury severity and outcomes
Table 6a shows a summary of the linked records, broken down by the police recorded severity, based on the full 25 year period; while there have been variations in these patterns over time these do not affect the broad patterns.
Table 6b shows the equivalent, for linked records where the STATS19 severity has been recorded via an injury-based recording system (IBRS). IBRS data has become more prevalent from 2016, and is not used by all police forces, so the figures below are not comparable with other tables in terms of time and geographical coverage. For these cases, the serious category is further sub-divided.
This shows that:
- the majority of linked records (63%) are coded as serious within STATS19, with around 2% linking to fatalities (dying in hospital, or potential bad matches) and the remaining 35% to slightly injured casualties
- casualties coded serious in STATS19 have a higher number of injuries than those coded slight and a higher average length of spell in hospital
- a higher share of STATS19 serious casualties have injuries coded as MAIS 3+ (clinically serious) than where STATS19 severity is slight
- for IBRS data, the number of injuries and length of spell in hospital are highest for the very serious casualties, followed by moderately serious and then less serious.
Table 6a: Police recorded severity for records linked, England 2000 to 2024
| Characteristic | Fatal | Serious | Slight | Total |
|---|---|---|---|---|
| Number of linked casualties | 7,000 | 222,000 | 122,000 | 350,000 |
| Share of linked casualties | 2% | 63% | 35% | 100% |
| Proportion with MAIS 3+ injuries | 71% | 25% | 7% | 20% |
| Average number of injury diagnoses | 5.6 | 3.0 | 1.7 | N/A |
| Average hospital spell duration (days) | 5.4 | 9.4 | 2.9 | N/A |
Table 6b: Police recorded severity for linked records where STATS19 data is from an injury-based reporting system, England
| Measure | Killed | Very serious | Moderately serious | Less serious | Slight |
|---|---|---|---|---|---|
| Number of linked casualties | 1,500 | 10,100 | 11,200 | 20,000 | 16,300 |
| Share of linked casualties | 2% | 17% | 19% | 34% | 28% |
| Proportion with MAIS 3+ | 81% | 55% | 42% | 18% | 11% |
| Average number of injury diagnoses | 8.3 | 5.8 | 4.1 | 3.0 | 2.0 |
| Average hospital spell duration (days) | 7.7 | 17.5 | 10.5 | 6.1 | 3.2 |
6.2 Police recorded injury by hospital injury severity and outcomes
Where HES records are linked to data from a police force using injury-based reporting, it is possible to further compare the most severe injury recorded in STATS19 with variables in HES.
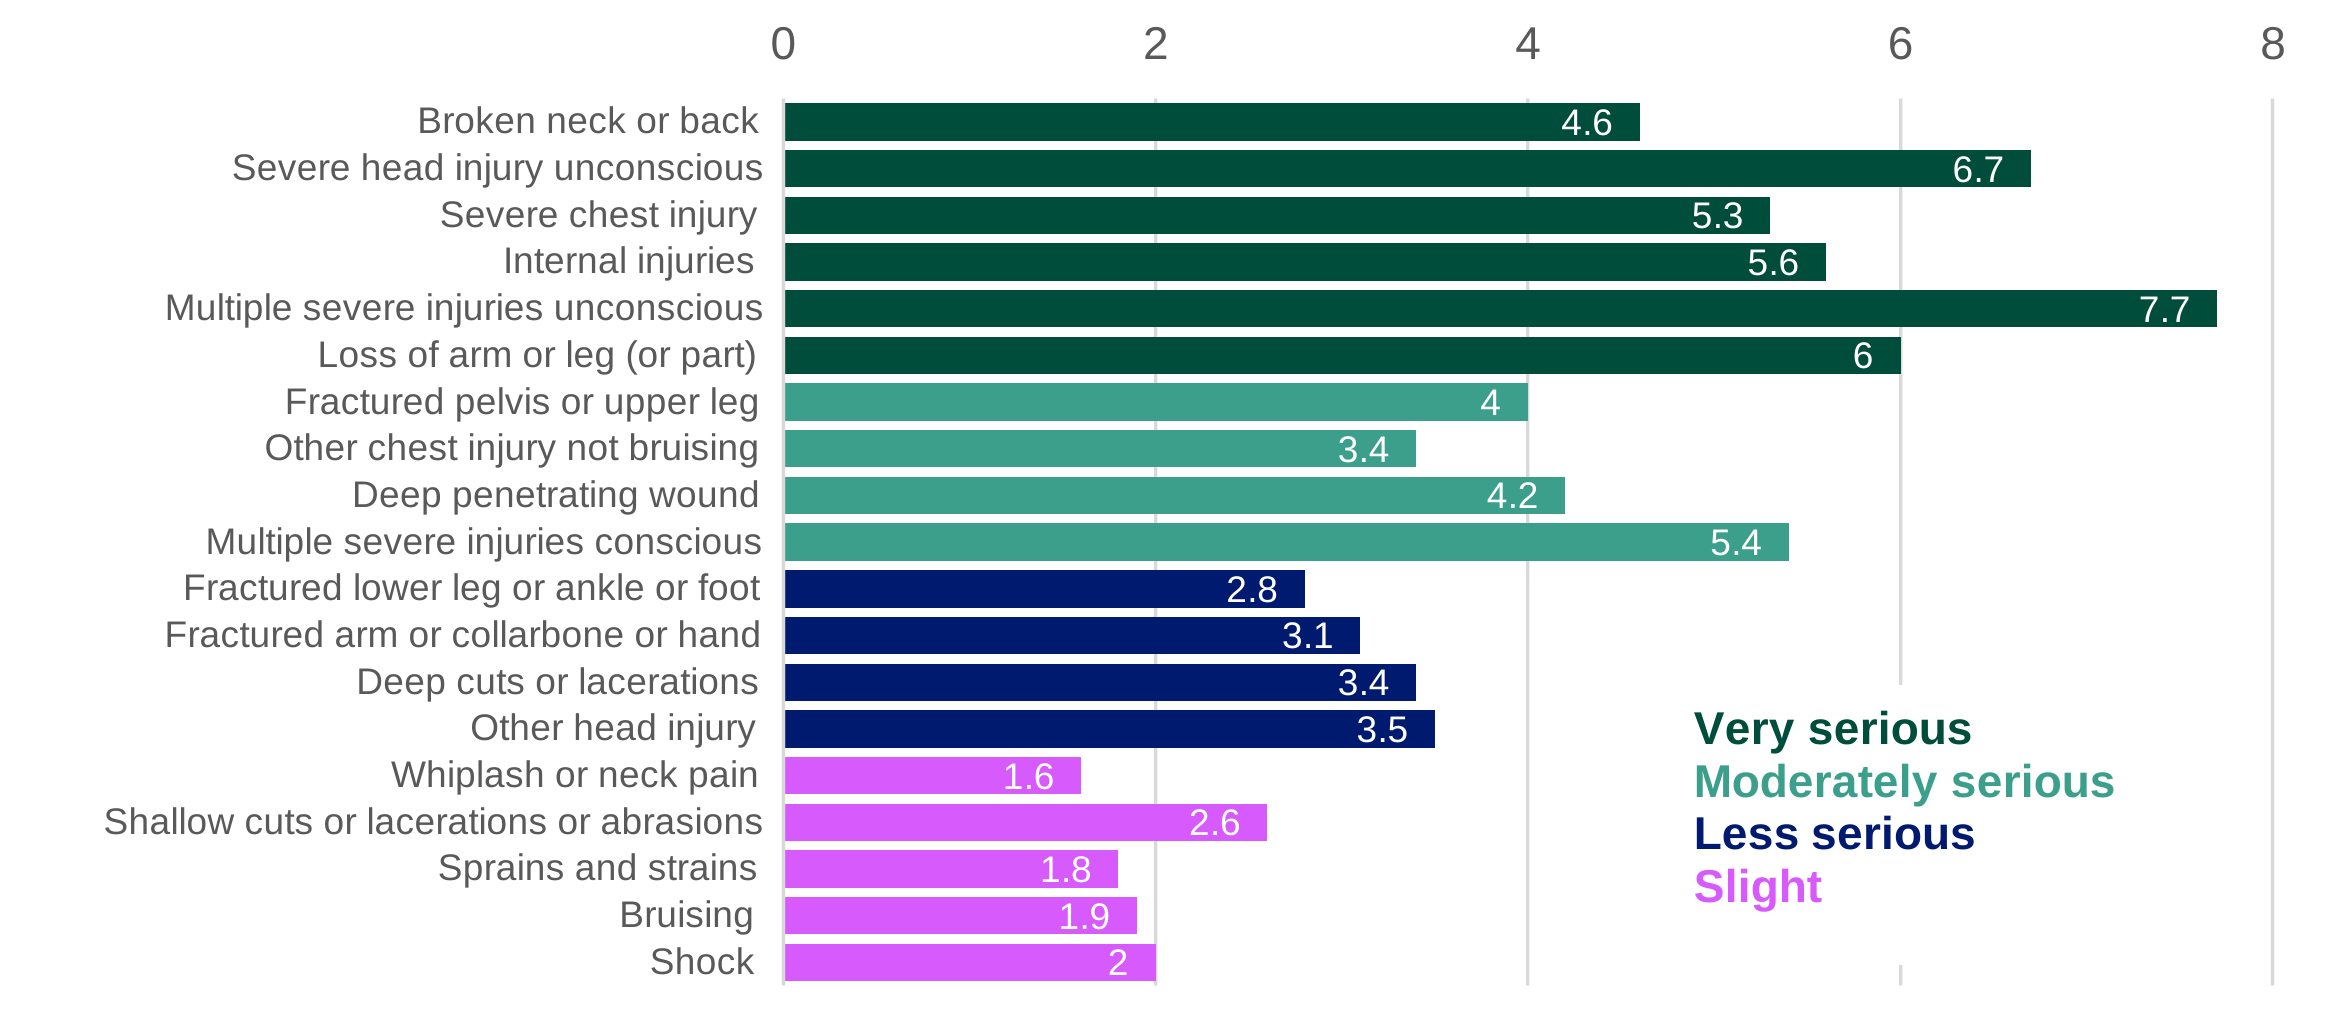
Table 7 shows the number of linked casualties for each injury, with the proportion classified as MAIS 3+ (clinically serious), average number of injuries and spell duration (also shown in Chart 7). This shows:
- hospital data broadly support the enhanced severity classification, with casualties in the deceased and very serious groups showing the highest levels of severe trauma, injury complexity and hospital stays.
- severe head injuries and multiple severe injuries are associated with the longest hospital stays and highest numbers of diagnoses.
- hospital outcomes vary within police injury categories, with some injuries recorded as less serious still associated with higher levels of MAIS3+ injuries
Table 7: Police recorded most severe injury for linked records where STATS19 data is from an injury-based reporting system, England
| STATS19 injury | Enhanced severity | Number of linked casualties | Proportion with MAIS 3+ | Average injury diagnoses | Average spell duration (days) |
|---|---|---|---|---|---|
| Deceased | Deceased | 1,500 | 81% | 8.3 | 7.7 |
| Broken neck or back | Very serious | 2,800 | 38% | 4.6 | 12.9 |
| Severe head injury, unconscious | Very serious | 3,000 | 73% | 6.7 | 23.4 |
| Severe chest injury | Very serious | 1,100 | 49% | 5.3 | 13.3 |
| Internal injuries | Very serious | 2,400 | 48% | 5.6 | 14.6 |
| Multiple severe injuries, unconscious | Very serious | 800 | 69% | 7.7 | 25.6 |
| Loss of arm or leg (or part) | Very serious | 300 | 45% | 6.0 | 25.7 |
| Fractured pelvis or upper leg | Moderately serious | 5,400 | 52% | 4.0 | 11.6 |
| Other chest injury, not bruising | Moderately serious | 3,200 | 26% | 3.4 | 6.6 |
| Deep penetrating wound | Moderately serious | 500 | 18% | 4.2 | 9.2 |
| Multiple severe injuries, conscious | Moderately serious | 1,800 | 44% | 5.4 | 12.1 |
| Fractured lower leg, ankle or foot | Less serious | 9,300 | 15% | 2.8 | 7.9 |
| Fractured arm, collarbone or hand | Less serious | 5,600 | 14% | 3.1 | 4.4 |
| Deep cuts or lacerations | Less serious | 2,100 | 17% | 3.4 | 4.7 |
| Other head injury | Less serious | 3,000 | 32% | 3.5 | 4.8 |
| Whiplash or neck pain | Slight | 3,200 | 10% | 1.6 | 2.9 |
| Shallow cuts, lacerations or abrasions | Slight | 5,300 | 12% | 2.6 | 3.0 |
| Sprains and strains | Slight | 3,400 | 11% | 1.8 | 3.8 |
| Bruising | Slight | 3,800 | 11% | 1.9 | 3.2 |
| Shock | Slight | 600 | 13% | 2.0 | 4.4 |
| Other injury | Uncertain | 4,600 | 23% | 2.9 | 6.8 |
| Total | All severities | 63,700 | 28% | 3.5 | 8.0 |
Chart7: Police recorded most severe injury for linked records by number of injury diagnoses in HES, where STATS19 data is from an injury-based reporting system, England
6.3 Police recorded injury by hospital diagnoses
The injury diagnoses recorded in HES using ICD-10 codes allow both body region and broad type of injury to be coded. This allows a further comparison with the STATS19 injury data, for those injuries in STATS19 which explicitly relate to either a body area (such as ‘other head injury’), injury type (‘deep cuts or lacerations’) or both (‘fractured arm, collarbone or hand’). Each HES record can have multiple diagnoses, so the following looks at the share of STATS19 where there is agreement with at least one.
Table 8 shows the proportion of linked records for each STATS19 injury where a body region can be identified and the most recorded body region from HES diagnoses, and Table 9 shows the equivalent for type of injury. Together these show:
- police recorded injuries are generally consistent with hospital recorded diagnoses, with particularly high agreement for fractures and severe head and chest injuries
- agreement is lower for broader injury categories such as whiplash and other head injuries.
- overall the accuracy of police injury recording appears reasonable
Table 8: Agreement between police-recorded injury type and hospital-recorded injured body region for linked casualties, England
| Injury type | Most common corresponding body region | Agreement |
|---|---|---|
| Severe head injury unconscious | Head | 93% |
| Severe chest injury | Chest | 89% |
| Other chest injury | Chest | 86% |
| Other head injury | Head | 86% |
| Fractured lower leg, ankle or foot | Lower limb | 94% |
| Fractured arm, collarbone or hand | Upper limb | 87% |
| Fractured pelvis or upper leg | Lower limb | 70% |
| Whiplash or neck pain | Neck | 17% |
Table 9: Agreement between police-recorded injury type and hospital-recorded diagnosis group for linked casualties, England
| STATS19 injury | Most common corresponding hospital diagnosis | Agreement |
|---|---|---|
| Fractured lower leg, ankle or foot | Fracture | 94% |
| Loss of arm or leg (or part) | Fracture | 92% |
| Fractured arm, collarbone or hand | Fracture | 90% |
| Deep cuts or lacerations | Open wound | 75% |
| Internal injuries | Organ injury | 68% |
| Severe chest injury | Organ injury | 62% |
| Severe head injury, unconscious | Intracranial injury | 68% |
| Other head injury | Intracranial injury | 30% |
An alternative approach is to list the most recorded diagnoses for each STATS19 injury. Table 10 shows the top 3 diagnoses, which broadly corresponded to the expected STATS19 injury descriptions. For example, head injuries were most associated with intracranial injuries, chest injuries with rib, thoracic and intrathoracic injuries, and fracture categories with fractures of the corresponding limb or body region.
Table 10: Top 3 most recorded HES diagnoses associated with police-recorded injury types for linked casualties, England
| STATS19 injury | Most common hospital diagnoses |
|---|---|
| Deceased | Intracranial injury (54%), chest or rib fractures (6%), abdominal organ injuries (6%) |
| Severe head injury, unconscious | Intracranial injury (59%), skull or facial fractures (9%), open head wounds (5%) |
| Multiple severe injuries, unconscious | Intracranial injury (32%), lower-leg fractures (9%), pelvic fractures (8%) |
| Broken neck or back | Pelvic or spinal fractures (24%), neck fractures (21%), chest or rib fractures (21%) |
| Severe chest injury | Chest or rib fractures (38%), intrathoracic organ injuries (14%) |
| Internal injuries | Abdominal organ injuries (20%), chest or rib fractures (14%), intracranial injury (9%) |
| Loss of arm or leg (or part) | Lower-leg fractures (29%), traumatic amputations (26% combined), femur fractures (9%) |
| Fractured pelvis or upper leg | Femur fractures (37%), pelvic fractures (27%), lower-leg fractures (12%) |
| Multiple severe injuries, conscious | Chest or rib fractures (16%), lower-leg fractures (12%), intracranial injury (10%) |
| Other chest injury, not bruising | Chest or rib fractures (50%), intrathoracic organ injuries (8%) |
| Deep penetrating wound | Lower-leg fractures (18%), open wounds of knee or lower leg (11%), forearm fractures (9%) |
| Other head injury | Intracranial injury (26%), skull or facial fractures (17%), open head wounds (11%) |
| Fractured lower leg, ankle or foot | Lower-leg or ankle fractures (65%), femur fractures (8%), foot or toe fractures (7%) |
| Fractured arm, collarbone or hand | Forearm fractures (31%), upper-arm fractures (25%), wrist or hand fractures (6%) |
| Deep cuts or lacerations | Open head wounds (19%), open wounds of knee or lower leg (11%), intracranial injury (9%) |
| Other injury | Lower-leg fractures (12%), chest or rib fractures (11%), intracranial injury (8%) |
| Whiplash or neck pain | Chest or rib fractures (14%), pelvic fractures (7%), neck fractures (5%) |
| Shallow cuts, lacerations or abrasions | Open head wounds (15%), superficial head injuries (10%), chest or rib fractures (8%) |
| Sprains and strains | Chest or rib fractures (12%), lower-leg fractures (10%), pelvic fractures (9%) |
| Bruising | Chest or rib fractures (11%), superficial head injuries (8%), lower-leg fractures (7%) |
| Shock | Chest or rib fractures (14%), intracranial injury (6%), pelvic fractures (4%) |
7. Results: additional variables
This section provides a brief exploratory analysis of the linked dataset, to illustrate where it may add value to what is available in STATS19, addressing the aim to explore potential analysis of the linked data that may address gaps in the STATS19 data.
The main findings include:
- Linked data provides access to a range of outcomes that are not available within STATS19, including clinical injury severity (MAIS3+) coded from injury diagnoses
- Hospital discharge data can be used to explore longer-term impacts of road-related injuries and burden of the healthcare system, for example via number of days in hospital and treatment specialisms, though further datasets are required to fully explore this
- Ethnicity coding offers opportunities to address a gap in STATS19 reporting without additional burden for police though is not fully complete within HES
7.1 Clinical injury severity: MAIS
The Abbreviated Injury Scale (AIS) is an internationally recognised measure of injury severity, which assigns injuries a score from 1 (minor) to 6 (currently untreatable). The Maximum AIS (MAIS) represents the highest AIS score recorded for an individual casualty across all injuries sustained. Casualties with MAIS 3+ are generally considered to have sustained a serious injury, and are used to provide an internationally comparable definition of seriously injured road casualties.
In this analysis, AIS severity is derived from hospital ICD-10 diagnosis codes using an established mapping between ICD-10 diagnoses and AIS scores. This provides a clinically-based measure of injury severity that is independent of the severity classification recorded by the police. There are some limitations to this approach. The conversion from ICD-10 to AIS is not exact and, in some cases, diagnosis codes cannot be mapped to a specific AIS score (‘no match’ in the charts below). Changes in hospital coding practices over time may also affect comparisons across years. As a result, MAIS 3+ should be interpreted as an indicator of injury severity rather than a definitive clinical assessment.
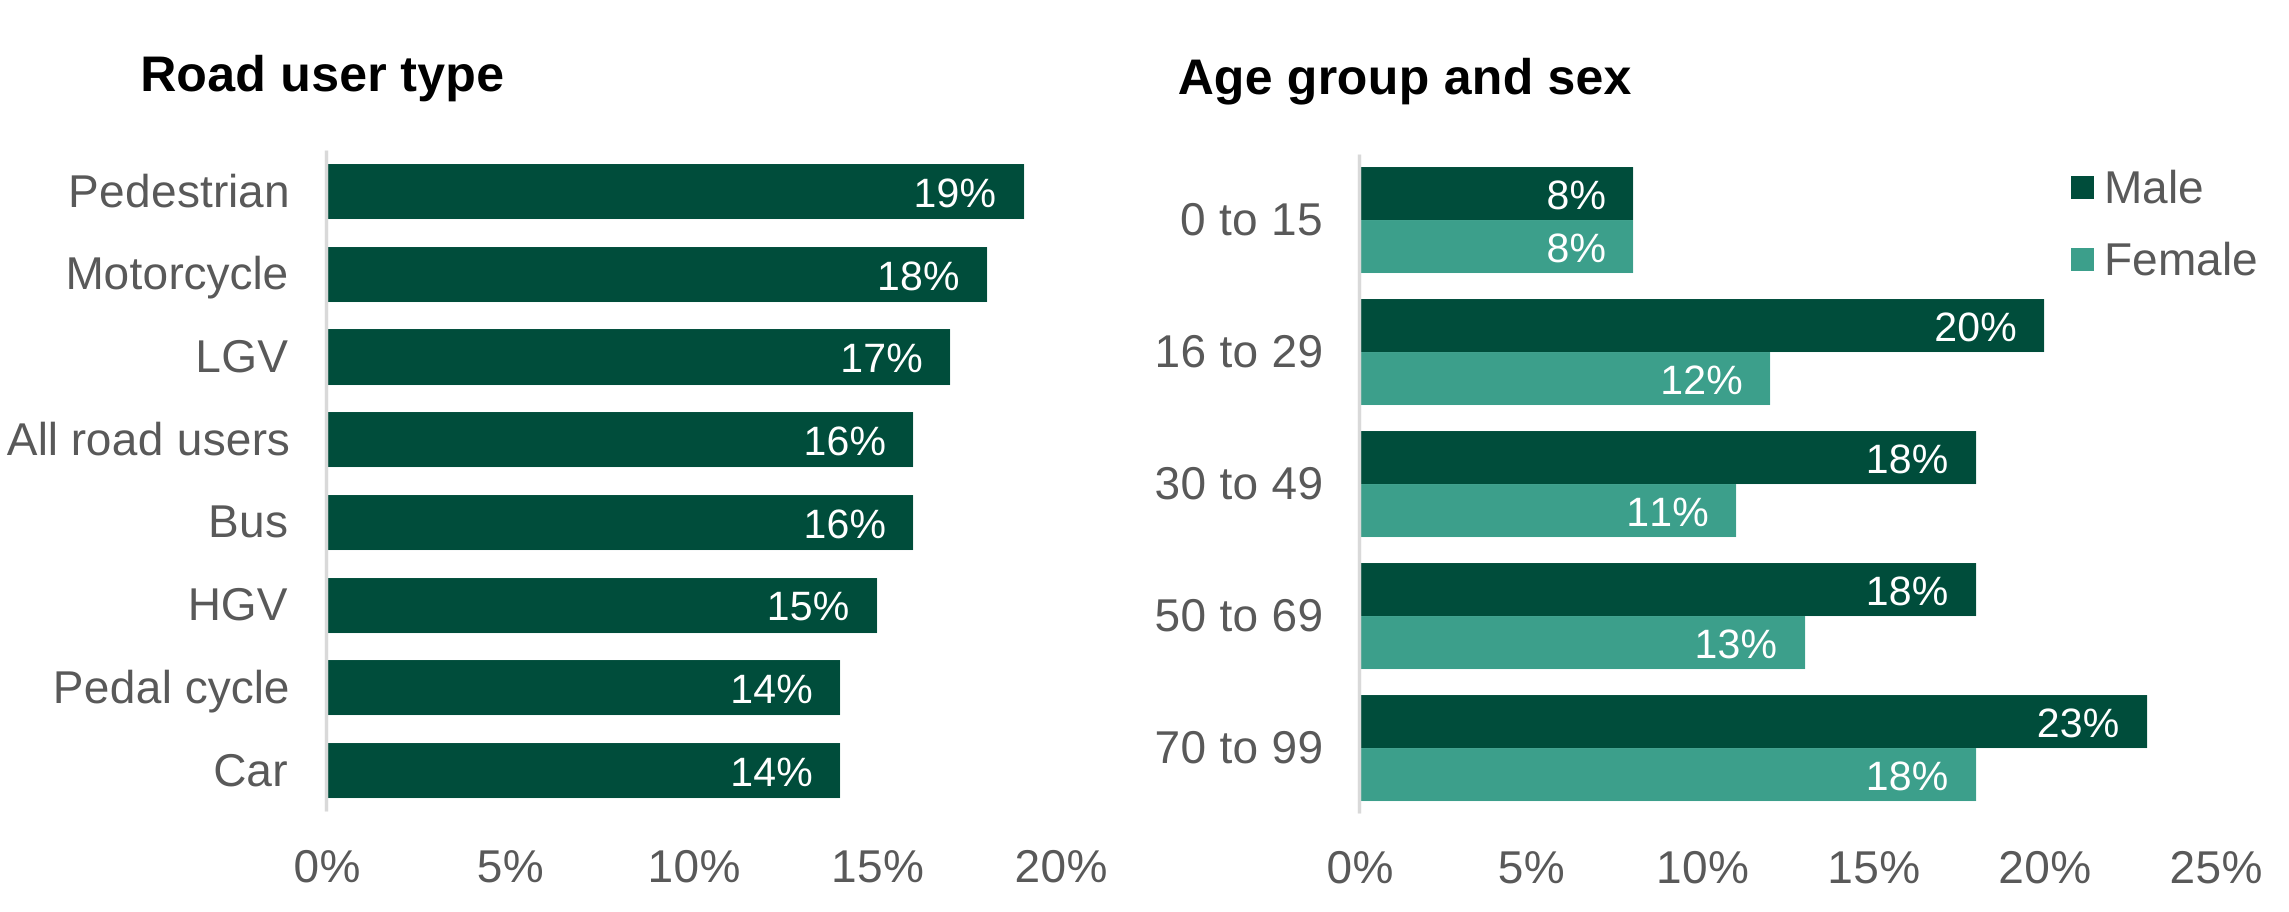
The HES data, and linked dataset, provide some insight into road casualties with MAIS3+. Chart 8 shows the trend over time, and Chart 9 shows the proportion of road traffic inpatients with MAIS 3+ injuries coded. This shows:
- the number of linked casualties with MAIS 3+ injuries has remained relatively stable over time (around 4,000 to 6,000 casualties per year) despite a decline in the total number of linked casualties since the mid-2000s.
- overall, around one in six road traffic casualties admitted to hospital had a MAIS 3+ injury, indicating a level of trauma associated with long-term health impacts.
- pedestrians (19%) and motorcyclists (18%) had the highest proportions of MAIS 3+ injuries, compared with 14% of car occupants and pedal cyclists, highlighting their greater vulnerability when injured in road collisions.
- the likelihood of sustaining a MAIS 3+ injury increases with age. For males, the proportion rose from 8% among those aged 0 to 15 to 23% among those aged 70 and over. A similar pattern was seen for females
- males were more likely than females to sustain MAIS 3+ injuries in every adult age group, particularly among those aged 16 to 29, where the proportion was 20% for males compared with 12% for females.
Chart 8: HES road traffic inpatient records with MAIS 3+ injuries by year, England 2000 to 2024**.
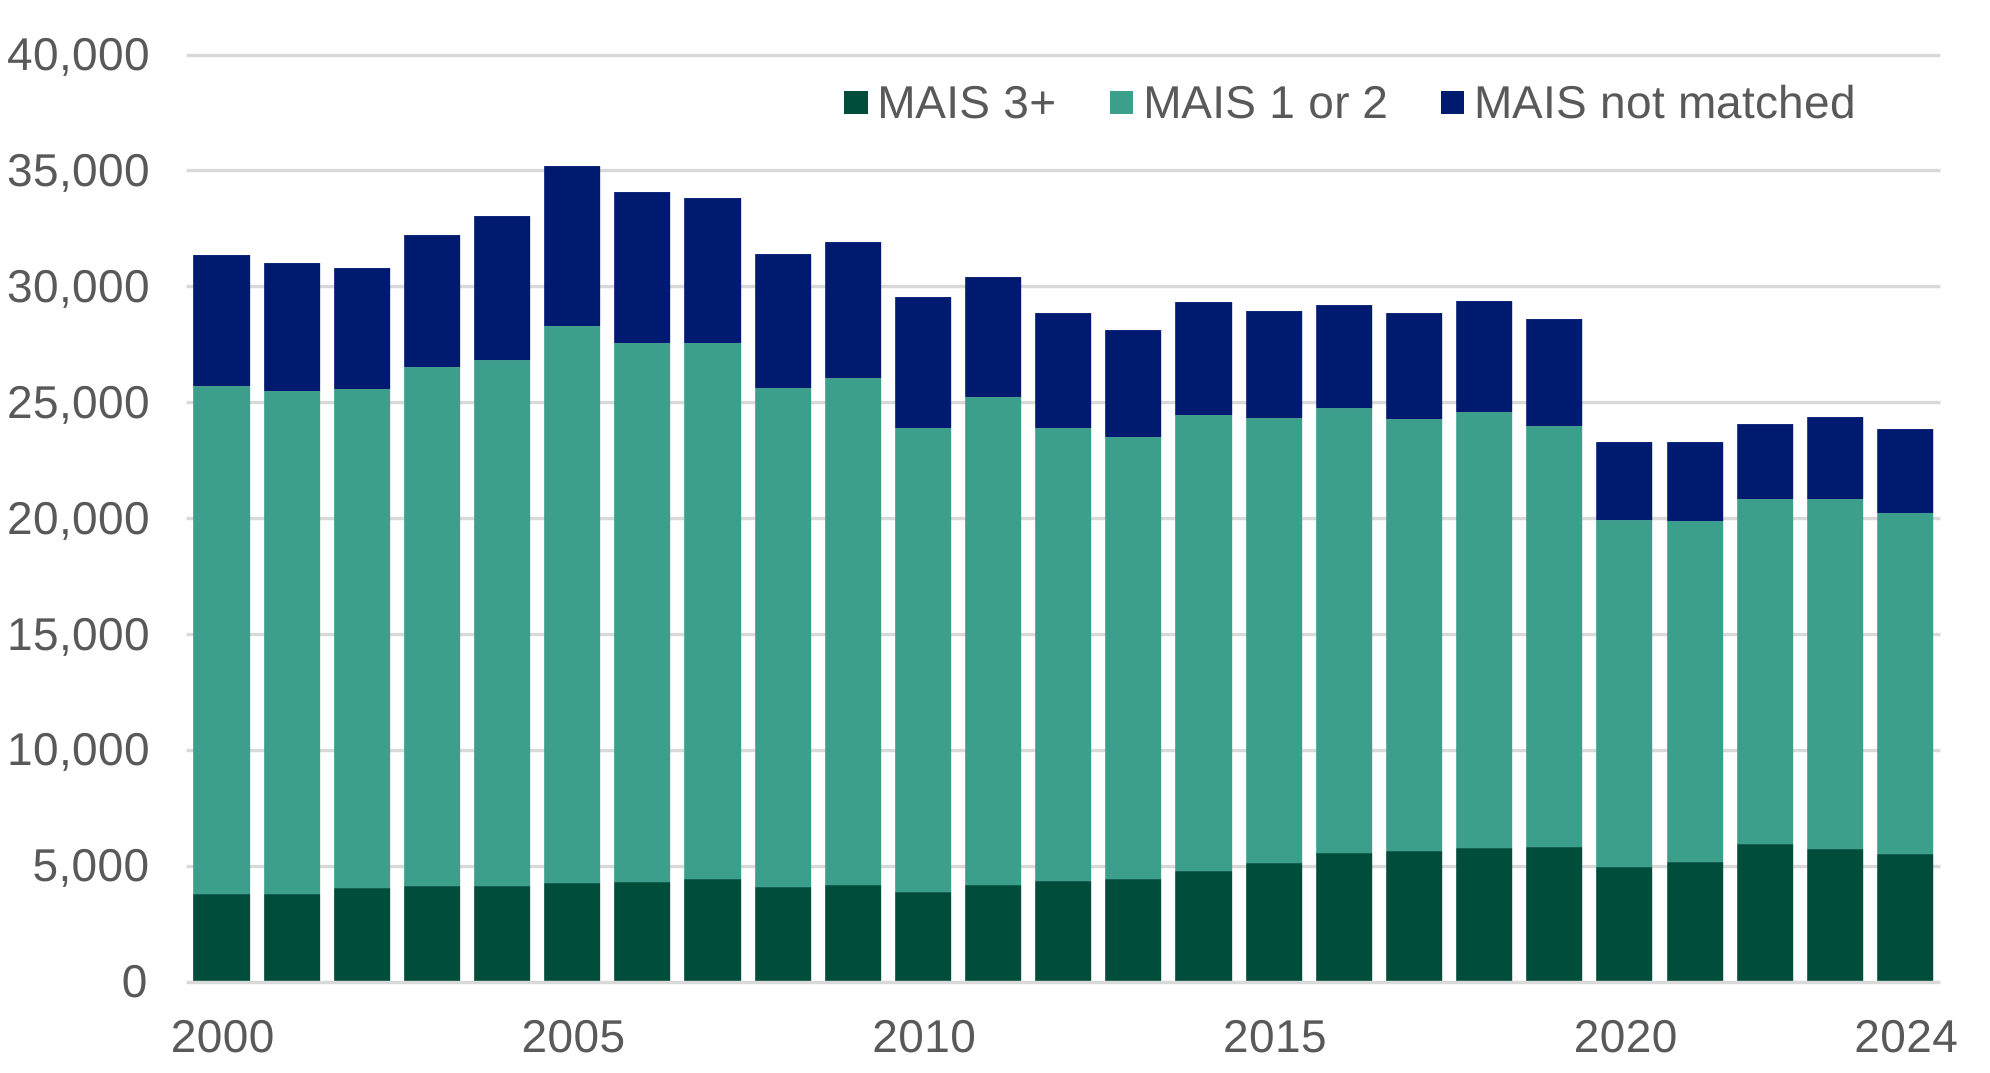
Chart 9: Proportion of HES road traffic inpatient records with MAIS 3+ injuries by road user type, age and sex, England 2000 to 2024
7.2 Hospital outcome measures
Length of stay in hospital provides an additional measure of injury severity and healthcare burden that is not available from police records. While injury severity measures such as MAIS indicate the nature and seriousness of injuries, hospital spell duration reflects the level of treatment and recovery required following a road traffic collision. Longer hospital stays may be associated with more severe or complex injuries and greater demand on healthcare services.
Chart 10 shows the number of HES road traffic admissions by length of spell in hospital, and Table 11 shows the proportion spending over 7 days in hospital by road user type for the latest year (2024), showing:
- the number of linked hospital admissions declined over the period, largely driven by reductions in admissions lasting less than two days. The number of admissions involving stays of seven days or longer remained comparatively stable at around 5,000 to 7,000 admissions per year.
- in the most recent years, around one quarter to one third of linked hospital admissions involved stays of seven days or longer
- pedestrians had the highest proportion of lengthy hospital stays, with 37% of admissions lasting seven days or longer, followed by motorcyclists (31%).
- car occupants accounted for the largest number of admissions (8,000) but a lower proportion of long stays (25%) than pedestrians and motorcyclists, and pedal cyclists had the lowest proportion of admissions lasting seven days or longer (17%)
Chart 10: HES road traffic inpatient records linked to STATS19, by hospital length of stay as a proxy for hospital-recorded severity or healthcare burden.
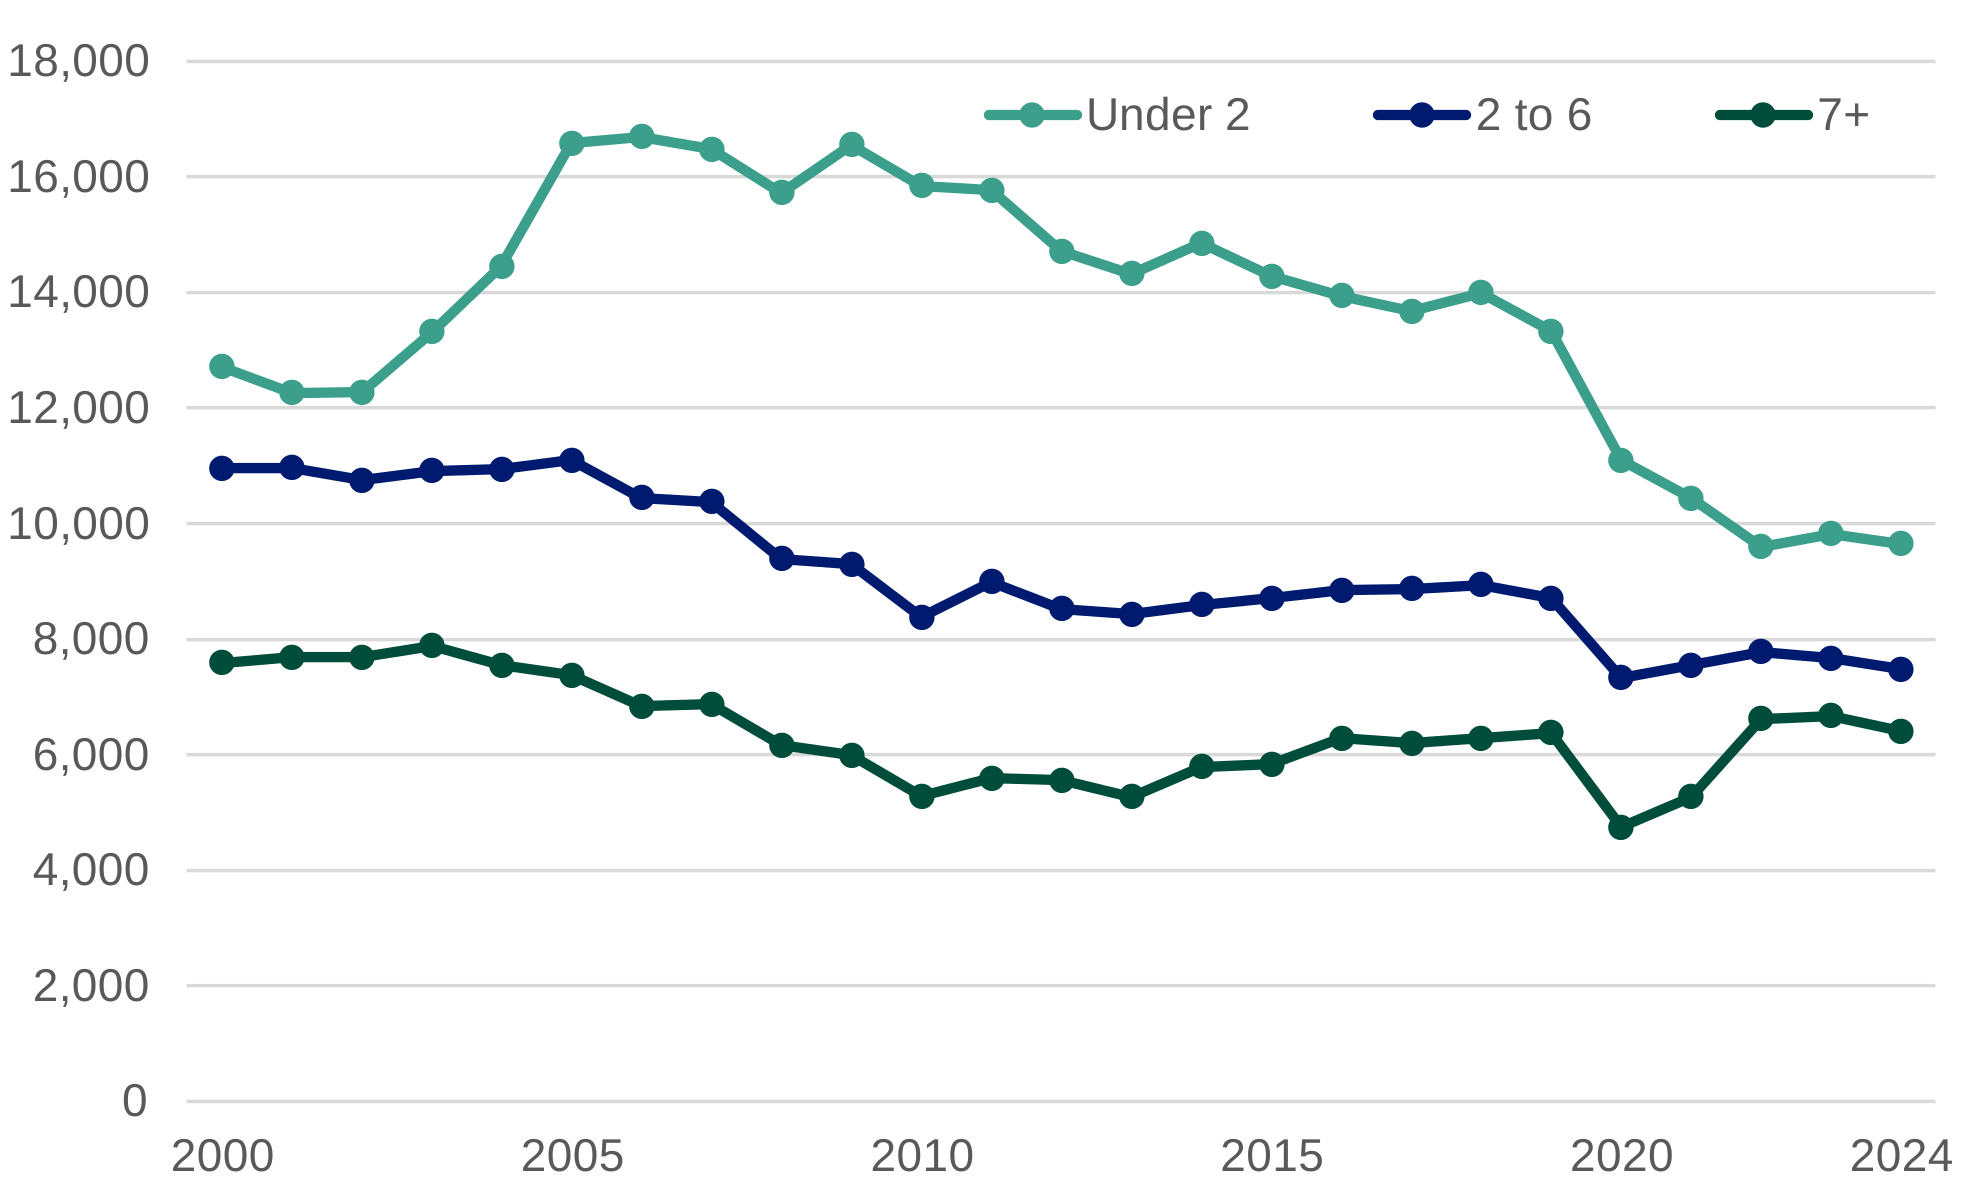
Table 11: Hospital admissions and proportion of admissions lasting 7 days or longer by road user type, England, 2024
| Road user type | Number of hospital admissions | Percentage staying 7 days or longer |
|---|---|---|
| Pedestrian | 4,600 | 37% |
| Motorcycle | 5,100 | 31% |
| Car | 8,000 | 25% |
| Pedal cycle | 4,900 | 17% |
| All road user types | 23,500 | 27% |
Hospital records also contain information on the clinical speciality responsible for treatment. Across all road user groups, trauma and orthopaedic services accounted for the largest share of admissions, highlighting the prevalence of fractures and musculoskeletal injuries among road casualties. This data, together with information on operations performed, may provide a further basis for understanding the post-collision outcomes for road casualties in more detail than is possible with the STATS19 data alone.
Table 12: HES road traffic inpatient records, most frequent treatment specialisms by road user type, England 2000 to 2024.
| Road user type | Most common treatment specialities |
|---|---|
| Motorcycle | Trauma and Orthopaedics (54%), Emergency Medicine (12%), General Surgery (12%) |
| Pedal cycle | Trauma and Orthopaedics (45%), Emergency Medicine (16%), General Surgery (9%) |
| Pedestrian | Trauma and Orthopaedics (43%), Emergency Medicine (14%), General Surgery (8%) |
| Car | Trauma and Orthopaedics (27%), Emergency Medicine (25%), General Surgery (14%) |
| All road users | Trauma and Orthopaedics (40%), Emergency Medicine (18%), General Surgery (11%) |
7.3 Demographic data – ethnicity
HES contains patient demographic characteristics, including ethnicity, which are not collected in STATS19. This information could be used to investigate inequalities in road traffic injury outcomes that cannot be examined using STATS19 data alone.
As an illustration, Table 13 shows the proportion of HES road traffic inpatient admissions between 2020 and 2024 by ethnicity. Around two-thirds of hospital-admitted road casualties were recorded as white, however ethnicity was recorded as unknown or not stated for around 18% of admissions. Therefore the white category accounted for around 83% of records with known ethnicity.
Table 13: HES road traffic inpatient records by ethnicity, England 2020 to 2024
| Ethnicity group | Percentage of hospital-admitted road casualties |
|---|---|
| White | 68% |
| Asian or Asian British | 4% |
| Black or Black British | 3% |
| Mixed ethnicity | 1% |
| Other ethnic group | 5% |
| Not known or not stated | 18% |
| Total | 100% |
8. Conclusion and next steps
8.1 Conclusions
This work has shown that it is possible to establish a linkage between STATS19 and HES. While the nature of the ‘fuzzy matching’ used inevitably means that this is imperfect at an individual record level, it nonetheless provides the basis for exploratory analysis as has been presented in this study.
This project remains a work in progress, but this linkage already provides some new insights into the completeness of, and injury coding accuracy within, STATS19 data, as well as highlighting areas for further exploration.
While it has long been known that STATS19 does not provide full coverage of non-fatal road casualties, this work provides a basis for quantification of the levels of reporting for relatively more serious casualties, broken down by variables of interest such as road user type.
In particular, this linkage presents no evidence that there are obvious differences in the level of completeness of STATS19 over time, or by police force area (using linkage rates as a proxy), once other factors – for example changes in the number of patients admitted for shorter stays – is taken into account.
This work also provides the first attempt to compare police recorded injury coding with hospital diagnoses, at national level. Overall, this comparison suggests that there is a reasonable degree of correspondence between police severity groups and hospital-recorded diagnoses and indicators of severity.
8.2 Next steps
This study forms phase 2 of the wider LPHD project, which aims to demonstrate the feasibility of a national level linkage between police recorded STATS19 data and a healthcare dataset.
As well as further developing and strengthening this linkage, phase 3 seeks to expand to further datasets as and when these become available, including:
- Emergency Care Dataset (ECDS), providing data from road traffic casualties attending A&E
- National Major Trauma Registry (NMTR) and HES Critical Care datasets, providing more detailed clinical outcomes for RTC casualties
- Mortality data, for those patients who die in hospital
A further report is anticipated to be published during summer 2027.
9. Acknowledgements
The Department for Transport road safety statistics team is grateful to the PRANA team at University Hospital Southampton, the Wessex Secure Data Environment team, and NHS England Data Access and Partnerships, who have facilitated this work.
10. Instructions for printing and saving
Depending on which browser you use and the type of device you use (such as a mobile or laptop) these instructions may vary.
Tablets and mobile devices normally have the option to “find in text” and “print or save” in their sharing or quick options menu of their browser, but this will vary by device model.
11. How to search
Select Ctrl and F on a Windows laptop or Command and F on a Mac
This will open a search box in the top right-hand corner of the page. Type the word you are looking for in the search bar and press enter.
Your browser will highlight the word, usually in yellow, wherever it appears on the page. Press enter to move to the next place it appears.
12. Contact details
Road safety statistics
Email roadacc.stats@dft.gov.uk
To hear more about DfT statistical publications as they are released, follow us on X (formerly known as Twitter) at DfTstats.
-
Details of the mapping used are available in the research paper. ↩
-
Full details of the model used are provided in the separate methodology report. ↩