Leasehold dwellings, 2020 to 2021
Published 7 July 2022
Applies to England

© Crown copyright 2022
This publication is licensed under the terms of the Open Government Licence v3.0 except where otherwise stated. To view this licence, visit nationalarchives.gov.uk/doc/open-government-licence/version/3 or write to the Information Policy Team, The National Archives, Kew, London TW9 4DU, or email: psi@nationalarchives.gov.uk.
Where we have identified any third party copyright information you will need to obtain permission from the copyright holders concerned.
This publication is available at https://www.gov.uk/government/statistics/leasehold-dwellings-2020-to-2021/leasehold-dwellings-2020-to-2021
1. In this release
- In 2020-21, there were an estimated 4.86 million leasehold dwellings in England. This equates to 20% of the English housing stock. Of these, 2.82 million dwellings (58%) were in the owner occupied sector and 1.79 million (37%) were privately owned and let in the private rented sector. The remaining 256,000 (6%) were dwellings owned by social landlords and let in the social rented sector.
- 71% (3.44 million) of the leasehold dwellings in England were flats; 29% (1.42 million) were houses.
- At regional level, London and the North West had the highest proportion of leasehold dwellings, at 35% and 31% respectively, significantly higher than all other regions in England which had between 8% and 17%.
- The number of leasehold dwellings increased between 2018-19 and 2020-21, from 4.46 million to 4.86 million. The apparent increase from 4.65 million in 2019-20 to 4.86 million in 2020-21 is not statistically significant.
Release date: 7 July 2022
Date of next release: July 2023
Responsible Statistician: Stephen Pottinger
Media enquiries: 0303 444 1209 NewsDesk@levellingup.gov.uk
2. Introduction
This release presents an estimate of the number of leasehold dwellings in England in 2020-21 by tenure, dwelling type and region.
3. Results
In 2020-21, there were an estimated 4.86 million leasehold dwellings in England. This equates to 20% of the English housing stock.
As this estimate is based on a sample of dwellings, a confidence interval around the estimate has been calculated. Using a 95% confidence interval, the 2020-21 estimate of 4.86 million sits within a lower bound of 4.64 million and an upper bound of 5.09 million leasehold dwellings.
Of these 4.86 million leasehold dwellings, 2.82 million dwellings (58%) were in the owner occupied sector and 1.79 million (37%) were privately owned and let in the private rented sector. The remaining 256,000 (6%) were dwellings owned by social landlords and let in the social rented sector.
Looking within tenure, 18% of owner occupied homes, 37% of homes in the private rented sector and 6% of homes in the social rented sector are owned on a leasehold basis[footnote 1], Table 1.
The majority of leasehold dwellings (71%) were flats with 3.4 million leasehold flats across all tenures (3.3 million in the private sector and 167,000 in the social rented sector). There were 1.4 million leasehold houses in 2020-21 which made up the remaining 29% of leasehold dwellings.
While 58% of flats were leasehold, proportions varied by tenure. In the private sector, 81% of flats were owned on a leasehold basis (95% of owner occupied flats and 70% of privately rented flats). A much smaller proportion (9%) of flats in the social rented sector were owned on a leasehold basis.
Leasehold houses were less prevalent than flats. This is true across all tenures. Overall, 8% of houses were owned on a leasehold basis, this was highest in the private rented sector, and lowest in local authority owned houses (9% and 1% respectively).
Table 1: Leasehold as a proportion of stock and number of dwellings, by tenure and dwelling type, 2020-21
| Houses: % dwellings leasehold | Houses: number of leasehold dwellings (thousands) | Flats: % dwellings leasehold | Flats: number of leasehold dwellings (thousands) | Total: % dwellings leasehold | Total: number of leasehold dwellings (thousands) | |
|---|---|---|---|---|---|---|
| Owner occupied | 8.0 | 1,113 | 94.5 | 1,706 | 17.9 | 2,819 |
| Private rented sector | 8.5 | 220 | 70.4 | 1,568 | 37.2 | 1,788 |
| All private sector | 8.1 | 1,333 | 81.2 | 3,274 | 22.4 | 4,607 |
| Local authority | 0.7 | 5 | 4.0 | 31 | 2.3 | 37 |
| Housing association | 6.0 | 84 | 12.3 | 135 | 8.8 | 220 |
| All social sector | 4.1 | 90 | 8.9 | 167 | 6.3 | 256 |
| All tenures | 7.6 | 1,422 | 58.2 | 3,441 | 19.8 | 4,863 |
Sources: English Housing Survey; HM Land Registry; DLUHC Dwelling Stock Estimates 2020; VOA Council Tax Stock of Properties 2020
Notes: Percentages are rounded to one decimal place; based on 10,611 cases.
Based on Annex Tables AT 1 and AT 3
4. Regional results
While 20% of the housing stock was owned on a leasehold basis, this varied by region. London and the North West had the highest proportion of leasehold dwellings, at 35% and 31% respectively, while the East Midlands had the lowest (8%), Figure 1 and Table 2 (below).
Figure 1: Proportion of housing stock owned on a leasehold basis, by region, 2020-21
| Region | Percentage |
|---|---|
| London | 35.3 |
| North West | 30.8 |
| South East | 16.9 |
| South West | 15.5 |
| North East | 15.3 |
| East | 14.8 |
| West Midlands | 14.4 |
| Yorkshire and the Humber | 13.5 |
| East Midlands | 8.4 |
Sources: English Housing Survey; HM Land Registry; DLUHC Dwelling Stock Estimates 2020; VOA Council Tax Stock of Properties 2020
Underlying data are presented in Annex Table 4
The same regional trend has been observed broadly in each tenure, Annex Table 7.
Looking at houses and flats separately, the proportion of leasehold houses also varied by region. Most notably, 27% of houses in the North West were owned on a leasehold basis, a significantly greater proportion than in any other region (the next highest was 9% in Yorkshire and the Humber). However, the North West had a smaller proportion of leasehold flats (50%) than London (61%), the South East and East of England (both 65%).
The proportion of flats that were leasehold was no lower than 40% in any region and no higher than 65%, Table 2.
Table 2: Leasehold as a proportion of stock and number of dwellings, by region and dwelling type, 2020-21
| Houses: % dwellings leasehold | Houses: number of leasehold dwellings (thousands) | Flats: % dwellings leasehold | Flats: number of leasehold dwellings (thousands) | Total: % dwellings leasehold | Total: number of leasehold dwellings (thousands) | |
|---|---|---|---|---|---|---|
| North East | 6.1 | 63 | 60.9 | 128 | 15.3 | 192 |
| North West | 26.6 | 733 | 50.2 | 294 | 30.8 | 1,026 |
| Yorkshire and the Humber | 8.6 | 177 | 39.8 | 153 | 13.5 | 331 |
| East Midlands | 3.8 | 70 | 40.8 | 109 | 8.4 | 178 |
| West Midlands | 5.7 | 118 | 56.4 | 244 | 14.4 | 362 |
| East | 3.3 | 73 | 65.2 | 329 | 14.8 | 402 |
| London | 1.6 | 26 | 61.2 | 1,277 | 35.3 | 1,303 |
| South East | 2.4 | 72 | 65.2 | 598 | 16.9 | 670 |
| South West | 4.4 | 90 | 58.4 | 309 | 15.5 | 399 |
| Total | 7.6 | 1,422 | 58.2 | 3,441 | 19.8 | 4,863 |
Sources: English Housing Survey; HM Land Registry; DLUHC Dwelling Stock Estimates 2020; VOA Council Tax Stock of Properties 2020
Notes: Percentages are rounded to one decimal place; based on 10,611 cases.
Based on Annex Tables AT 4 and AT 6
5. Changes over time
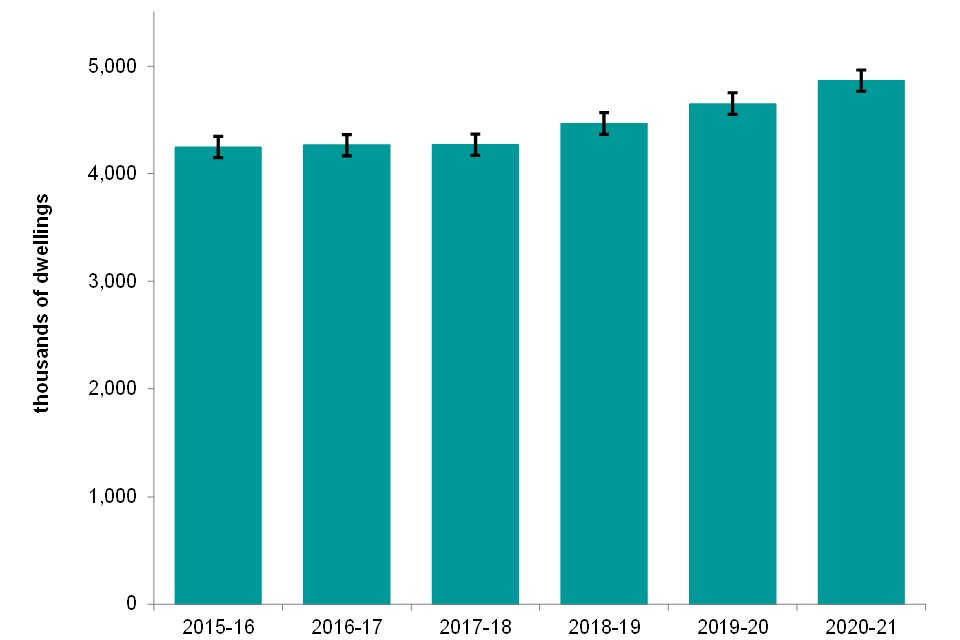
Between 2015-16 and 2017-18, the number of leasehold dwellings was around 4.3 million. The number of leasehold dwellings increased between 2018-19 and 2020-21, from 4.47 million to 4.86 million. The apparent increase from 4.65 million in 2019-20 to 4.86 million in 2020-21 is not statistically significant, Figure 2.
Figure 2: Estimated number of leasehold dwellings, 2015-16 to 2020-21
Sources: English Housing Survey; HM Land Registry; DLUHC Dwelling Stock Estimate 2020; VOA Council Tax Stock of Properties 2020
Underlying data are presented in Annex Table 3.
One in five (20%) dwellings are owned on a leasehold basis, unchanged from 2019-20 but up from 19% in 2018-19 and 18% between 2015-16 and 2017-18.
6. Accompanying tables and open data
Tables
Accompanying tables are available to download alongside this release.
7. Technical notes
Please see the accompanying technical notes document for further details.
8. Enquiries
Media enquiries:
telephone: 0303 444 1209
Email: newsdesk@levellingup.gov.uk
Public enquiries and Responsible Statisticians:
Stephen Pottinger
Email: ehs@levellingup.gov.uk
Information on Official Statistics is available via the UK Statistics Authority website.
Information about statistics at DLUHC is available via the Department’s website.
-
Shared owners are included as owner occupiers. ↩