Leasehold dwellings, 2019 to 2020
Published 8 July 2021
Applies to England

© Crown copyright 2021
This publication is licensed under the terms of the Open Government Licence v3.0 except where otherwise stated. To view this licence, visit nationalarchives.gov.uk/doc/open-government-licence/version/3 or write to the Information Policy Team, The National Archives, Kew, London TW9 4DU, or email: psi@nationalarchives.gov.uk.
Where we have identified any third party copyright information you will need to obtain permission from the copyright holders concerned.
This publication is available at https://www.gov.uk/government/statistics/leasehold-dwellings-2019-to-2020/leasehold-dwellings-2019-to-2020
In this release:
- In 2019-20, there were an estimated 4.6 million leasehold dwellings in England. This equates to 19% of the English housing stock. Of these, 2.6 million dwellings (56%) were in the owner occupied sector and 1.8 million (39%) were privately owned and let in the private rented sector. The remaining 269,000 (6%) were dwellings owned by social landlords and let in the social rented sector.
- More than two thirds (68%, 3.2 million) of the leasehold dwellings in England were flats; 32% (1.5 million) were houses.
- At regional level, London and the North West had the highest proportion of leasehold dwellings, at 34% and 31% respectively, while the East Midlands had the lowest (9%).
- These statistics are now ‘Official Statistics’. Previous releases, ‘Estimating the number of leasehold dwellings in England 2014-15 to 2018-19’ were published as ‘Experimental Official Statistics’ signifying that they were undergoing development and evaluation. The Official Statistics designation means that the statistics have now been assessed as compliant with the standards of best practice set out in the Code of Practice for Statistics and are produced in accordance with the governance and operational arrangements set out in statistical legislation.
Date of next release: July 2022.
Responsible Statistician: Stephen Pottinger
Media enquiries: 0303 444 1209 NewsDesk@communities.gov.uk
Introduction
This report presents an estimate of the number of leasehold dwellings in England in 2019-20 by tenure, dwelling type and region.
Changes to this release
The statistics in this release are a continuation of the series ‘Estimating the number of leasehold dwellings in England’ produced for 2014-15 to 2018-19. The statistics in the earlier series were labelled ‘Experimental Official Statistics’, signifying that they were undergoing development before a final decision was made on their eventual designation. That initial evaluation period has now ended and the statistics have since been given the status of unqualified ‘Official Statistics’. This designation means that the statistics have been produced in accordance with the governance and operational arrangements set out in statistical legislation, and in compliance with the standards of best practice set out in the Code of Practice for Statistics. The methodology used to produce the statistics has not changed.
The Ministry of Housing, Communities and Local Government (MHCLG) still welcomes feedback on how these statistics are used and how well they meet user needs. Please send feedback to ehs@communities.gov.uk.
Results
In 2019-20, there were an estimated 4.6 million leasehold dwellings in England. This equates to 19% of the English housing stock. Of these, 2.6 million dwellings (56%) were in the owner occupied sector and 1.8 million (39%) were privately owned and let in the private rented sector. The remaining 269,000 (6%) were dwellings owned by social landlords and let in the social rented sector. Looking within tenure, 17% of owner occupied homes, 38% of homes in the private rented sector and 7% of homes in the social rented sector are owned on a leasehold basis[footnote 1], Table 1.
The majority of leasehold dwellings (68%) were flats with 3.2 million leasehold flats across all tenures (3.0 million in the private sector and 190,000 in the social rented sector). There were 1.5 million leasehold houses in 2019-20 which made up the remaining 32% of leasehold dwellings.
While 57% of flats were leasehold, proportions varied by tenure. In the private sector, 82% of flats were owned on a leasehold basis (93% of owner occupied flats and 73% of privately rented flats). A much smaller proportion (10%) of flats in the social rented sector were owned on a leasehold basis.
Leasehold houses were less prevalent than flats. This is true across all tenures. Overall, 8% of houses were owned on a leasehold basis, this was highest in the private rented sector, and lowest in local authority owned houses (9% and 1% respectively).
Table 1: Leasehold as a proportion of stock and number of dwellings, by tenure and dwelling type, 2019-20
| Houses: % dwellings leasehold | Houses: number of leasehold dwellings (thousands) | Flats: % dwellings leasehold | Flats: number of leasehold dwellings (thousands) | Total: % dwellings leasehold | Total: number of leasehold dwellings (thousands) | |
|---|---|---|---|---|---|---|
| Owner occupied | 8.1 | 1,139 | 92.7 | 1,450 | 16.7 | 2,589 |
| Private rented sector | 9.3 | 246 | 73.4 | 1,543 | 37.6 | 1,789 |
| All private sector | 8.3 | 1,386 | 81.6 | 2,993 | 21.6 | 4,378 |
| Local authority | 0.6 | 5 | 4.7 | 38 | 2.7 | 43 |
| Housing association | 5.6 | 74 | 13.2 | 152 | 9.1 | 226 |
| All social sector | 3.7 | 79 | 9.7 | 190 | 6.6 | 269 |
| All tenures | 7.8 | 1,464 | 56.5 | 3,183 | 19.1 | 4,647 |
Sources: English Housing Survey; HM Land Registry; MHCLG Dwelling Stock Estimates 2019; VOA Council Tax Stock of Properties 2019
Notes: Percentages are rounded to one decimal place; based on 12,300 cases.
Based on Annex Tables AT 1 and AT 3
Regional results
While 19% of the housing stock was owned on a leasehold basis, this varied by region. London and the North West had the highest proportion of leasehold dwellings, at 34% and 31% respectively, while the East Midlands had the lowest (9%), Figure 1 and Table 2.
Figure 1: Proportion of housing stock owned on a leasehold basis by region, 2019-20
| Region | Percentage |
|---|---|
| East Midlands | 8.9 |
| West Midlands | 12.4 |
| Yorkshire and the Humber | 13.3 |
| East | 13.9 |
| North East | 14.2 |
| South West | 15.6 |
| South East | 15.6 |
| North West | 30.8 |
| London | 34.5 |
| Total | 19.1 |
Sources: English Housing Survey; HM Land Registry; MHCLG Dwelling Stock Estimates 2019; VOA Council Tax Stock of Properties 2019
Underlying data are presented in Annex Table 4
Looking at houses and flats separately, the proportion of leasehold houses also varied by region. Notably, 28% of houses in the North West were owned on a leasehold basis, a significantly greater proportion than in any other region (the next highest was 8% in Yorkshire and the Humber). For flats, proportions ranged from 43% in Yorkshire and the Humber to 63% in the South East, Table 2. This regional pattern is observed across tenures, Annex Table 7.
Table 2: Leasehold as a proportion of stock and number of dwellings, by region and dwelling type, 2019-20
| Houses: % dwellings leasehold | Houses: number of leasehold dwellings (thousands) | Flats: % dwellings leasehold | Flats: number of leasehold dwellings (thousands) | Total: % dwellings leasehold | Total: number of leasehold dwellings (thousands) | |
|---|---|---|---|---|---|---|
| North East | 5.9 | 61 | 57.0 | 116 | 14.2 | 177 |
| North West | 27.5 | 760 | 46.9 | 259 | 30.8 | 1,018 |
| Yorkshire and the Humber | 8.0 | 164 | 43.1 | 158 | 13.3 | 322 |
| East Midlands | 3.9 | 73 | 45.2 | 185 | 8.9 | 187 |
| West Midlands | 6.0 | 126 | 45.2 | 185 | 12.4 | 310 |
| East | 3.5 | 78 | 62.3 | 296 | 13.9 | 374 |
| London | 3.0 | 49 | 60.0 | 1,197 | 34.5 | 1,247 |
| South East | 2.1 | 65 | 62.9 | 549 | 15.6 | 614 |
| South West | 4.3 | 89 | 61.3 | 310 | 15.6 | 399 |
| Total | 7.8 | 1,464 | 56.5 | 3,183 | 19.1 | 4,647 |
Changes over time
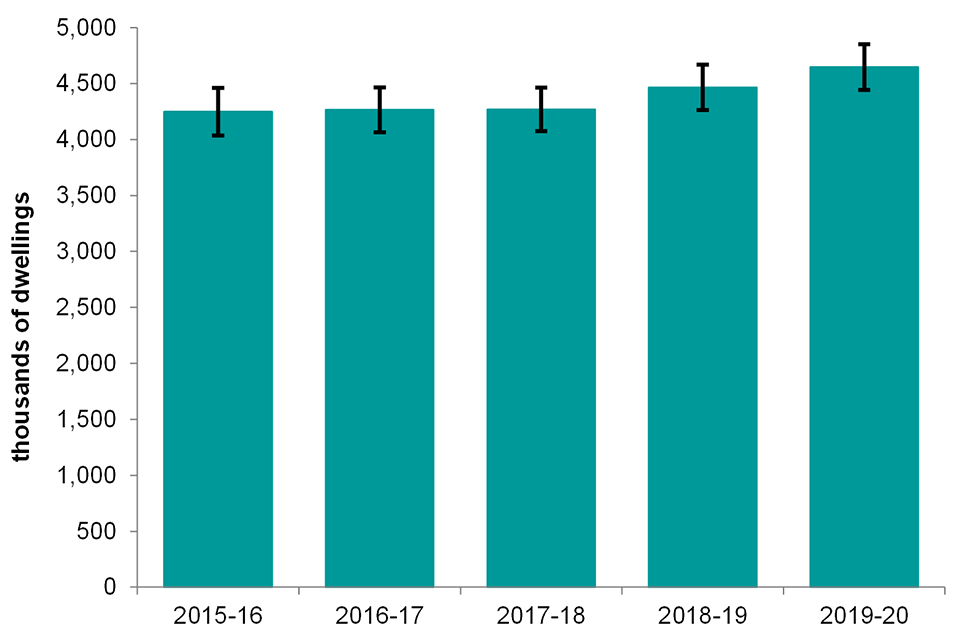
Between 2015-16 and 2017-18, the number of leasehold dwellings was around 4.3 million. The number increased to 4.5 million in 2018-19 and to 4.6 million in 2019-20, Figure 2. However, the increases were not statistically significant[footnote 2]. The apparent increase from 18% of dwellings in the years up to and including 2017-18 to 19% in 2018-19 and 2019-20 was also not statistically significant.
Figure 2: Estimated number of leasehold dwellings 2015-16 to 2019-20
Sources: English Housing Survey; HM Land Registry; MHCLG Dwelling Stock Estimates 2019; VOA Council Tax Stock of Properties 2019
Underlying data are presented in Annex Table 3.
Accompanying tables and open data
Tables
Accompanying tables are available to download alongside this release.
Technical notes
Please see the accompanying technical notes document for further details.
Enquiries
Media enquiries:
telephone: 0303 444 1209 Email: newsdesk@communities.gov.uk
Public enquiries and Responsible Statisticians:
Stephen Pottinger Email: ehs@communities.gov.uk
Information on Official Statistics is available via the UK Statistics Authority website
Information about statistics at MHCLG is available via the department’s website
-
Shared owners are included as owner occupiers ↩
-
The way the EHS sample is drawn means that a confidence interval around the estimate can be calculated, enabling comparisons between survey years. Using a 95% confidence interval, the estimate is relatively precise with a lower bound of 4.4 million leasehold dwellings and an upper bound of 4.9 million dwellings. The difference between the 2019-20 estimate and the 2017-18 and 2018-19 estimates are, respectively, 378,000 and 181,000 dwellings, that is within the confidence intervals of the 2019-20 estimates (404,000 dwellings). This means that the apparent change is not statistically significant. ↩