Land use change statistics – hectarage 2019-20 to 2021-22 statistical release
Published 24 August 2023
Applies to England

© Crown copyright 2023
This publication is licensed under the terms of the Open Government Licence v3.0 except where otherwise stated. To view this licence, visit nationalarchives.gov.uk/doc/open-government-licence/version/3 or write to the Information Policy Team, The National Archives, Kew, London TW9 4DU, or email: psi@nationalarchives.gov.uk.
Where we have identified any third party copyright information you will need to obtain permission from the copyright holders concerned.
This publication is available at https://www.gov.uk/government/statistics/land-use-change-hectarage-2019-to-2022/land-use-change-statistics-hectarage-2019-20-to-2021-22-statistical-release
1. Main points
In the three years from 2019-20 to 2021-22:
- 238,000 hectares of land in England have seen a change in use, equivalent to approximately 1.8% of England’s total land area. Of this:
- 59% (140,500 hectares) was from non-developed uses to other non-developed uses;
- 20% (48,500 hectares) was from non-developed uses to developed uses;
- 13% (32,000 hectares) was from developed uses to other developed uses; and
- 7% (17,000 hectares) was from developed uses to non-developed uses.
- Within the Green Belt, 75% (7,200 hectares) of land changing to a developed use was from non-developed uses.
- Within National Flood Zone 3, 52% (4,300 hectares) of land changing to a developed use was from non-developed uses.
2. Introduction
The Land Use Change Statistics consist of two releases, new residential addresses and changes in hectarage. This release, ‘Land Use Change – hectarage’ provides information on the amount of land changing use from previous use to its new use. These changes are recorded to and from a set of 28 land use categories (see Table A1 later in this release, or in the technical notes).
‘Land Use Change – residential addresses’ provides information on new residential addresses and the previous land use those addresses were created on. Information is also provided on the proportion of new residential addresses located within certain areas of interest such as the Green Belt, Flood Zones and other similar ‘designations’. ‘Addresses created’ for these purposes include new builds and conversions.
The Department also publishes Land Use statistics with the release and tables showing the amount of land within each individual land use category at national and local levels. Data is provided to the Department by Ordnance Survey Ltd and is derived from Ordnance Survey’s AddressBase Premium, OS MasterMap Sites Layer, OS MasterMap Topography Layer, and OS Open Greenspace products.
3. Context
England has a land area of just over 13,046,000 hectares[footnote 1] of which about 9% is of developed use,[footnote 2] with 11% being deemed ‘built-up’.[footnote 3] Just over 37% (4.9 million hectares) of the area of England is protected against development by designation[footnote 4] as Green Belt, National Parks, Area of Outstanding Natural Beauty (AONBs) and Sites of Special Scientific Interest (SSSIs).
In addition, there are other designations of interest such as land at risk from flooding. Approximately 10% of England’s land area is located within Flood Zone 3 (not accounting for flood defences) with 8% at risk from flooding from rivers and sea (after accounting for flood defences). See the Definitions section for more information.
Statistical information on these other designations are available within the Green Belt statistics publication, specifically the ‘Land designations by LA’ table in the Accompanying tables and within the Green Belt and other designations the interactive dashboard.
The Land Use statistics provide a clear distinction between land that is of ‘developed use’ and land that is of ‘non-developed use’ by separating land into one of 28 defined land use or land cover categories. Land that is of ‘developed use’ and land that is of ‘non-developed use’ can be broadly associated with the terms ‘brownfield’ and ‘greenfield’ which, although more commonly used, do not have a consistent and specific definition, which limits their usefulness for statistics or analysis. ‘Built-up areas’ are defined as land which is ‘irreversibly urban in character’, meaning that they are characteristic of a town or city. ‘Built-up areas’ are likely to therefore contain a higher proportion of land that is of ‘developed use’ but they will also contain land that is of ‘non-developed use’ such as areas of grassland or residential gardens.
4. Changes in land use
In the three years between 2019-20 to 2021-22:
- 238,000 hectares of land in England have seen a change in use, equivalent to approximately 1.8% of England’s total land area. Of this:
- 59% (140,500 hectares) was from non-developed uses to other non-developed uses, equivalent to approximately 1.1% of England’s total land area;
- 20% (48,500 hectares) was from non-developed uses to developed uses, equivalent to approximately 0.4% of England’s total land area;
- 13% (32,000 hectares) was from developed uses to other developed uses, equivalent to approximately 0.2% of England’s total land area; and
- 7% (17,000 hectares) was from developed uses to non-developed uses, equivalent to approximately 0.1% of England’s total land area.
The proportions and number of hectares of land changing to and from each use are available within the accompanying live tables and the interactive dashboard, with Live Table P360 providing the above summary figures.
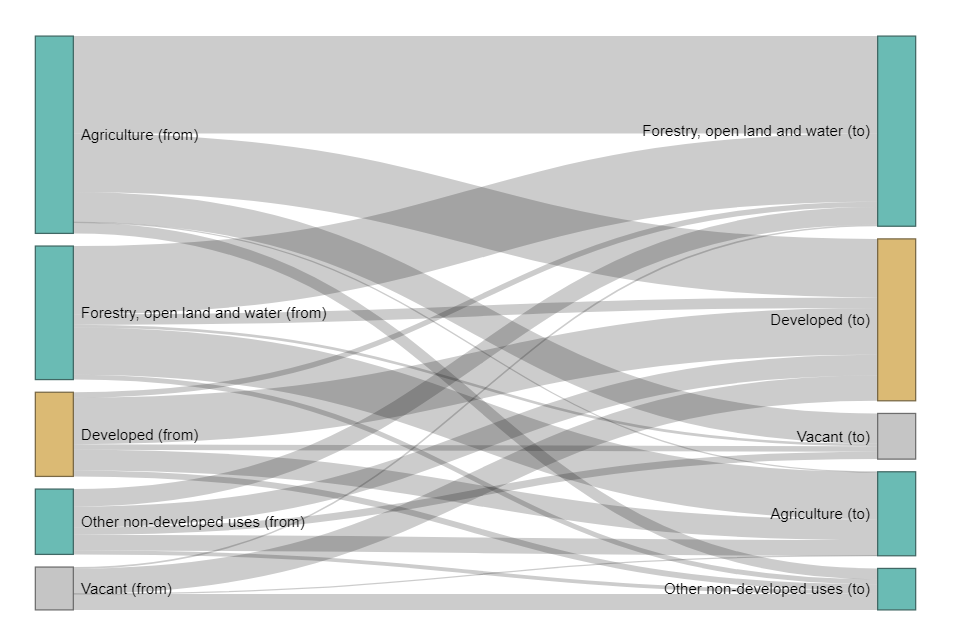
Figure 1: Land changing to from previous use (left) to new use (right), England 2019-20 to 2021-22
4.1 Land changing to developed use
In the three years between 2019-20 and 2021-22:
- 80,500 hectares of land in England changed to a developed use, equivalent to approximately 0.6% of England’s total land area and accounting for 34% of total land use change. Of this:
- 60% (48,500 hectares) was from non-developed uses; and
- 40% (32,000 hectares) was between developed uses.
- The top three previous land use groups changing to developed use, as measured by area were: ‘Agriculture’ (33% or 26,300 hectares), ‘Other developed use’ (13% or 10,800 hectares), and ‘Industry and commerce’ (13% or 10,200 hectares). See Live Table P350 and the interactive dashboard.
- During the same period, 17,000 hectares of land in England changed from developed uses to non-developed uses resulting in a net increase of 31,500 hectares in land that is of developed use, equivalent to approximately 0.2% of England’s total land area.
Figure 2: Land changing to developed use from previous land use group, England 2019-20 to 2021-22

Map 1: Land changing to developed use from non-developed use, England 2019-20 to 2021-22

Each hexagon has a height of 5 kilometres.
4.2 Land changing to residential use
- 6% (15,300 hectares) of total land use change was to residential use, equivalent to approximately 0.1% of England’s total land area. Of this:
- 75% (11,400 hectares) of land changing to residential use was from non-developed uses.
- The top three previous land use groups changing to residential use, as measured by area were: ‘Vacant - previously non-developed’ (28% or 4,400 hectares), ‘Agriculture’ (26% or 4,000 hectares), and ‘Other developed use’ (11% or 1,700 hectares).
This does not mean 75% of new homes were created on non-developed land. This figure does not account for new housing built on land that is already of ‘Residential’ use (because it does not involve a change of use), and ‘Residential gardens’ are included within the land changing to ‘Residential’ category.[footnote 5] See the Land use change - new residential address statistics for the proportion of new residential addresses created on previously developed and previously non-developed land.
Figure 3: Land changing to residential use from previous land use group, England 2019-20 to 2021-22

5. Regional breakdown
There was wide variation in the proportion of land changing to developed use from non-developed use between regions in England. In 2019-20 to 2021-22, South East had the highest proportion with 68% of land changing from non-developed use to developed use followed by East Midlands with 67%. London had the lowest proportion with 32%. See Live Table P350a and the interactive dashboard.
Figure 4: Land changing to developed use by previous land use type, England 2019-20 to 2021-22

There was also wide variation in the proportion of land changing to developed use from non-developed use at local authority level. In 2019-20 to 2021-22, Tandridge had the highest proportion with 88% of land changing from non-developed use to developed use followed by Reigate and Banstead with 84%. City of London had the lowest proportion with 3%. See Live Table P350a and the interactive dashboard.
6. Land use change within the Green Belt
The National Planning Policy Framework states the Government attaches great importance to Green Belts. The fundamental aim of Green Belt policy is to prevent urban sprawl by keeping land permanently open; the essential characteristics of Green Belts are their openness and their permanence. For further information, please see our Green Belt statistics publication.
The extent of land designated as Green Belt in England as at 31 March 2022 was estimated at 1,638,150 hectares, around 12.6% of the land area of England.
In the three years between 2019-20 and 2021-22:
- 75% (7,200 hectares) of land changing to a developed use was from non-developed uses.
- 7% (1,100 hectares) of land changing to residential use was within the Green Belt, of which 71% (800 hectares) was from non-developed uses with 29% (300 hectares) from developed uses.
See Live Tables P380, P382, P383, and the interactive dashboard.
7. Land use change within areas at risk of flooding
7.1 Flood Zone 3
Flood Zone 3 is the Environment Agency’s best estimate of the areas of land at risk of flooding, when the presence of flood defences is ignored and covers land with a 1 in 100 (1%) or greater chance of flooding each year from Rivers; or with a 1 in 200 (0.5%) or greater chance of flooding each year from the Sea.
- 52% (4,300 hectares) of land changing to a developed use was from non-developed uses.
- 4% (600 hectares) of land changing to residential use was within the Flood Zone 3, of which 63% (400 hectares) was from non-developed uses with 37% (200 hectares) from developed uses.
See Live Table P390, and the interactive dashboard.
7.2 Risk of Flooding from Rivers and Sea (RoFRS)
Risk of Flooding from Rivers and Sea (RoFRS) is an assessment of flood risk for England produced using local data and expertise. It shows the chance of flooding from rivers and the sea presented in categories taking account of flood defences and the condition they are in. High risk: each year, there is a chance of flooding of greater than 1 in 30 (3.3%). Medium risk: each year, there is a chance of flooding of between 1 in 30 (3.3%) and 1 in 100 (1%).
- 61% (3,100 hectares) of land changing to a developed use was from non-developed uses.
- 3% (400 hectares) of land changing to residential use was within areas at high/medium Risk of Flooding from Rivers and Sea, of which 67% (300 hectares) was from non-developed uses with 33% (100 hectares) from developed uses.
See Live Table P390, and the interactive dashboard.
8. Accompanying tables and open data
8.1 Tables
Accompanying tables are available to download alongside this release.
8.2 Definitions of terms used in this release
National Flood Zone 3
Land assessed as having a 1 in 100 or greater annual probability of river flooding (>1%), or a 1 in 200 or greater annual probability of flooding from the sea (>0.5%) in any year.
Flood Zone 3 ignores the presence of flood defences.
Risk of Flooding from Rivers and Sea (RoFRS)
An assessment of flood risk for England produced using local data and expertise. It shows the chance of flooding from rivers and the sea presented in categories taking account of flood defences and the condition they are in, and describes the suitable uses of the data.
- High risk: each year, there is a chance of flooding of greater than 1 in 30 (3.3%).
- Medium risk: each year, there is a chance of flooding of between 1 in 30 (3.3%) and 1 in 100 (1%).
RoFRS takes account of flood defences and the condition they are in.
Risk of Flooding from Surface Water (RoFSW)
Land assessed for flooding scenarios as a result of rainfall with a 1 in 100 (1%) chance of occurring in any given year.
Table A1: Land use and land use change classification table
Developed uses
| Group | Category | Code |
|---|---|---|
| Community services | Community buildings | C |
| Community services | Leisure (indoor) | L |
| Defence buildings | Defence buildings | D |
| Industry and commerce | Industry | I |
| Industry and commerce | Offices | J |
| Industry and commerce | Retail | K |
| Industry and commerce | Storage and warehousing | S |
| Minerals and landfill | Minerals and mining | M |
| Minerals and landfill | Landfill and waste disposal | Y |
| Other developed use | Unidentified building | ~B |
| Other developed use | Unidentified general manmade surface | ~M |
| Other developed use | Unidentified structure | ~S |
| Other developed use | Unknown surface type with no classification | ~U |
| Residential | Communal accommodation | Q |
| Residential | Residential | R |
| Transport and utilities | Highways and roads | H |
| Transport and utilities | Transport (other) | T |
| Transport and utilities | Utilities | U |
| Vacant land | Vacant - developed | V - DL |
Non-developed uses
| Group | Category | Code |
|---|---|---|
| Agriculture | Agricultural land | A |
| Agriculture | Agricultural buildings | B |
| Forestry, open land and water | Forestry and woodland | F |
| Forestry, open land and water | Rough grassland | G |
| Forestry, open land and water | Natural land | N |
| Forestry, open land and water | Water | W |
| Outdoor recreation | Outdoor recreation | O |
| Residential gardens | Residential gardens | RG |
| Undeveloped land | Undeveloped land | X |
| Vacant land | Vacant non-developed | V - NDL |
Vacant land
| Group | Category | Code |
|---|---|---|
| Vacant land | Vacant land | V |
Definitions for the 28 individual land use categories are provided in the Technical Notes.
9. Technical notes
Please see the accompanying Technical Notes document for further details of definitions, related statistics and other technical details.
Information on the UK Statistical System is available via the UK Statistics Authority website.
Information about statistics at Department for Levelling Up, Housing and Communities is available via the Department’s website.
10. Enquiries
Date of next release: To be announced later
Media enquiries: 0303 444 1209 newsdesk@levellingup.gov.uk
Public enquiries and responsible statistician: Alex Reynolds
Email: planning.statistics@levellingup.gov.uk
-
Please note, changes to ‘Residential’ use include residential dwellings, private gardens and any outbuildings. ‘Residential gardens’ is only a ‘from’ use. ↩