Interactive Health Atlas of Lung conditions in England (INHALE): November 2021 update
Published 2 November 2021
Applies to England

© Crown copyright 2021
This publication is licensed under the terms of the Open Government Licence v3.0 except where otherwise stated. To view this licence, visit nationalarchives.gov.uk/doc/open-government-licence/version/3 or write to the Information Policy Team, The National Archives, Kew, London TW9 4DU, or email: psi@nationalarchives.gov.uk.
Where we have identified any third party copyright information you will need to obtain permission from the copyright holders concerned.
This publication is available at https://www.gov.uk/government/statistics/interactive-health-atlas-of-lung-conditions-in-england-inhale-november-2021-update/interactive-health-atlas-of-lung-conditions-in-england-inhale-november-2021-update
The INHALE tool has been refreshed and updated.
New in this update
New mortality data has been added to the INHALE profile
This update includes new data for 12 indicators in the INHALE profile:
-
mortality from pneumonia (underlying cause) in all persons, all ages
-
mortality from pneumonia (all mentions) in all persons, all ages
-
mortality from chronic obstructive pulmonary disease (COPD) as a contributory cause in all persons, all ages
-
mortality rate from asthma in all persons, all ages
-
mortality rate from respiratory disease in all persons aged under 75
-
mortality rate from respiratory disease considered preventable in all persons aged under 75
-
smoking status recorded in the last 12 months
-
smoking cessation support and treatment offered
-
smoking status at time of delivery
-
percentage of patients with COPD
-
percentage of patients with COPD who have had influenza immunisation in the preceding 1 August to 31 March
-
percentage of patients with COPD and Medical Research Council (MRC) dyspnoea scale greater than or equal to 3, with an offer of referral to a pulmonary rehabilitation programme recorded
Due to the potential impact of coronavirus (COVID-19) on mortality data, indicators are now being presented in views for both 3-year up to 2017 to 2019 and 1-year up to 2020 where numbers allow. The mortality indicators have been recalculated for the new 2021 Clinical Commissioning Group (CCG) configurations and local authority configurations and back series data has been adjusted to also take into account the changes in cause of death coding software and ICD-10 coding making data comparable to the most recent 2020 data.
Main findings
This update shows:
-
respiratory disease continues to be a major cause of disability and premature mortality in England
-
mortality rates from pneumonia (underlying cause) have continued to decline but have higher rates in the most deprived areas
-
in 2020 the rate of pneumonia mortality (all mentions) significantly increased to 190.9 (189.7 to 192.0) per 100,000 from a rate of 155.4 (154.4 to 156.5) per 100,000 in 2019
-
mortality from COPD as a contributory cause continues to increase. The mortality from COPD as a contributory cause significantly increased to 68.8 (68.1 to 69.5) per 100,000 in 2020 from 54.0 (53.4 to 54.6) per 100,000 in 2019
-
the mortality rate from asthma has remained stable
-
the under 75 mortality rate from respiratory disease (underlying cause) in 2020 was 29.4 (28.9 to 29.8) per 100,000, a significant drop from the 2019 value of 33.3 (32.7 to 33.8) per 100,000. This may represent displacement of the underlying cause of death by COVID-19
-
in 2020 there was a significant decrease in mortality from respiratory disease considered preventable (2019 definition) from 20.1 (19.7 to 20.5) per 100,000 in 2019 to 17.1 (16.7 to 17.5) per 100,000 in 2020. This could also represent displacement of the underlying cause of death by COVID-19
Summary
Mortality rate from pneumonia (underlying cause)
This indicator has been updated and previous data refreshed to present data from the year 2006 to 2008, up to 2017 to 2019 for persons using the 2021 Clinical Commissioning Group configurations. One-year data from 2006 to 2020 is also being presented.
The mortality rate from pneumonia (underlying cause) has steadily decreased from 72.6 per 100,000 in 2006 to 33.4 per 100,000 in 2020.
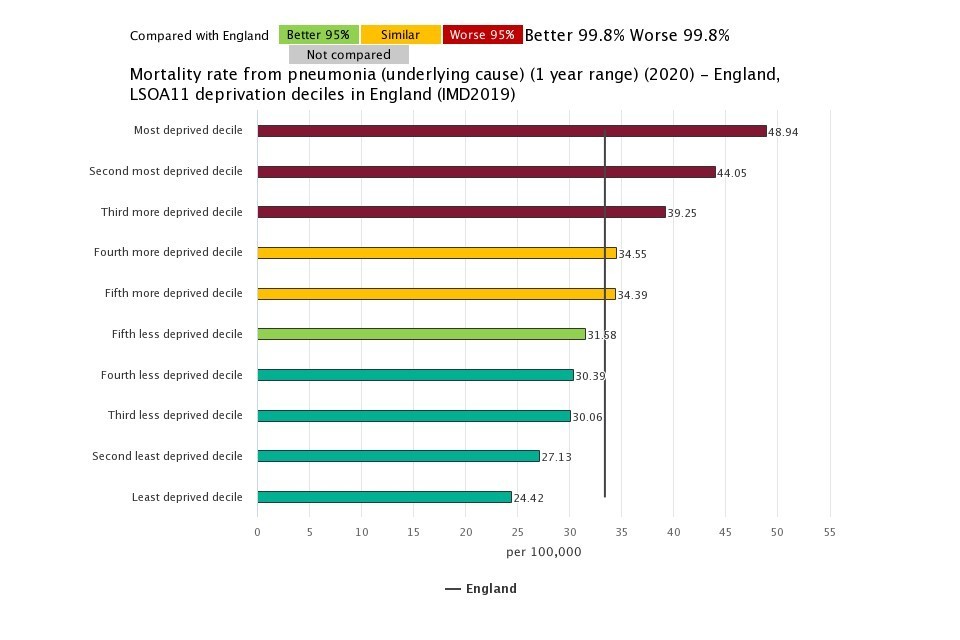
Mortality from pneumonia (underlying cause) is higher in areas of deprivation. In 2020, the rate of mortality from pneumonia in the most deprived decile was 2-fold that of the rate in the least deprived decile, the gap has widened since 2006 where there was a 1.5-fold difference.
The CCG with the highest rate of mortality from pneumonia (underlying cause) was NHS Knowsley CCG, with a rate of 59.9 per 100,000, significantly higher than the England rate of 33.4, and 2.7-fold higher than the CCG with the lowest rate of 22.4 per 100,000 (NHS West Suffolk CCG).
Figure 1: mortality rate from pneumonia (underlying cause), per 100,000 population, all ages, 2020, by IMD 2019 lower super output area deciles in England
Mortality rate from pneumonia (all mentions)
This indicator has been updated and previous data refreshed to present data from the year 2006 to 2008, up to 2017 to 2019 for persons using the 2021 Clinical Commissioning Group configurations. One-year data from 2006 to 2020 is also being presented.
The mortality rate from pneumonia (all mentions) has significantly increased from 155.4 (154.4 to 156.5) per 100,000 population in 2019 to 190.9 (189.7 to 192.0) in 2020. From 2006 to 2019 the mortality rate had been decreasing.
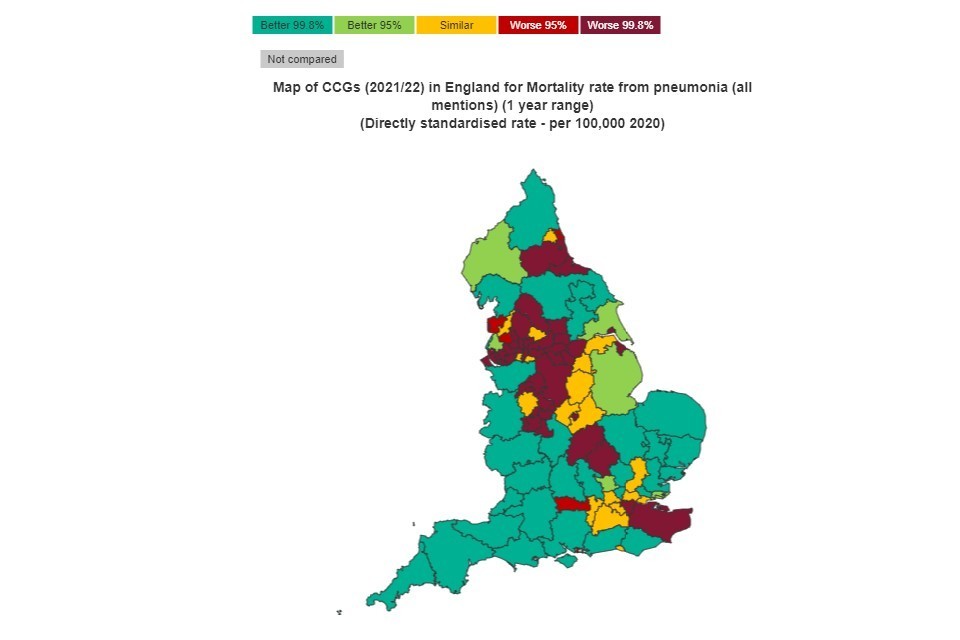
The CCG with the highest rate of mortality from pneumonia (all mentions) in 2020 was NHS Manchester CCG (403.5 per 100,000) with a rate 3.6-fold that of the CCG with the lowest rate of mortality, NHS Somerset CCG (111.2 per 100,000).
Most CCGs experienced an increase in the 1-year mortality rate from 2019 to 2020.
Regionally, the northern and midlands regions have more CCGs with significantly higher rates than England than the southern regions notable exceptions are NHS Kent and Medway CCG, NHS South East London CCG, NHS Bedfordshire, Luton and Milton Keynes CCG and NHS Northamptonshire CCG
Figure 2: mortality rate from pneumonia (all mentions) per 100,000 population, CCGs. 2020
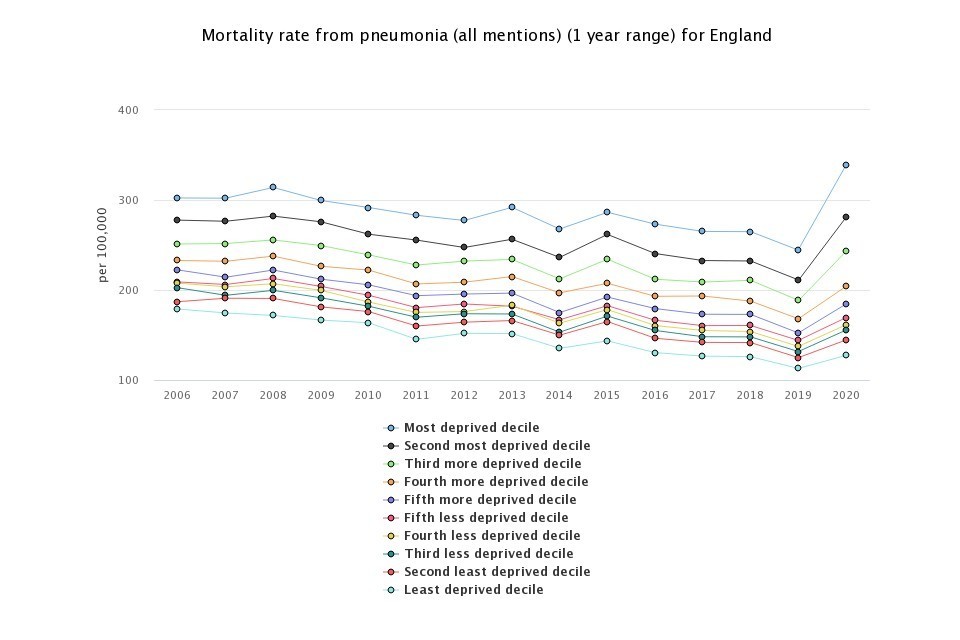
Both the 3-year and the 1-year range show the association between deprivation and higher rates of mortality from pneumonia. In 2020, the most deprived lower super output area deprivation decile had a mortality rate 2.7-fold higher than that of the least deprived decile. In 2020, the mortality rate from pneumonia increases in all deprivation deciles with the greatest increase in the 3 most deprived deciles.
Figure 3: mortality rate from pneumonia (all mentions) per 100,000 population, all ages, 2006 to 2020 by IMD 2019 lower super output area deciles in England
Mortality rate from COPD as a contributory cause
This indicator has been updated and previous data refreshed to present data from the year 2006 to 2008, up to 2017 to 2019 for persons using the 2021 Clinical Commissioning Group configurations. One-year data from 2006 to 2020 is also being presented.
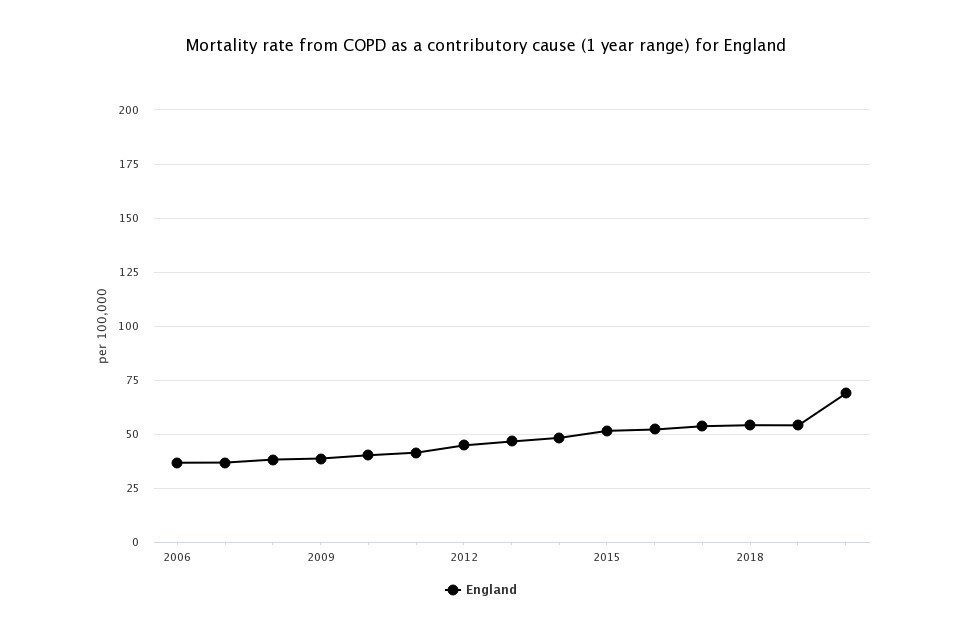
The mortality rate from COPD as a contributory cause in England has been steadily increasing since 2006 but the 1-year mortality data significantly increased from 54.0 (53.4 to 54.6) per 100,000 in 2019 to 68.8 (68.1 to 69.5) per 100,000 in 2020.
Figure 4: mortality rate from COPD as a contributory cause per 100,000 population, all ages, 2006 to 2020, England
More deprived areas have a higher rate of death from COPD as a contributory factor. The most deprived decile had a rate of 159.4 per 100,000 people in 2020, over five times higher than the rate of the least deprived decile (30.9 per 100,000). Overall England rates have been increasing in all deprivation deciles from 2006; each decile experienced a sharp increase in mortality rates from 2019 to 2020.
Across the CCGs, rates varied from the highest rate of 178.7 per 100,000 population in NHS Manchester CCG (count 480) to 34.7 per 100,000 in NHS Dorset CCG (count 365). NHS Kent and Medway CCG had the largest count of deaths from COPD as a contributory cause with 1,529 deaths (80.0 per 100,000) in 2020. Every CCG experienced an increase in the rate of mortality from COPD as a contributory cause in 2020.
Mortality rate from asthma
This indicator has been updated and previous data refreshed to present data from the year 2006 to 2008, up to 2017 to 2019 for persons using the 2021 Clinical Commissioning Group configurations. One-year data from 2006 to 2020 is also being presented.
The 3-year mortality rate from asthma rate has remained relatively stable.
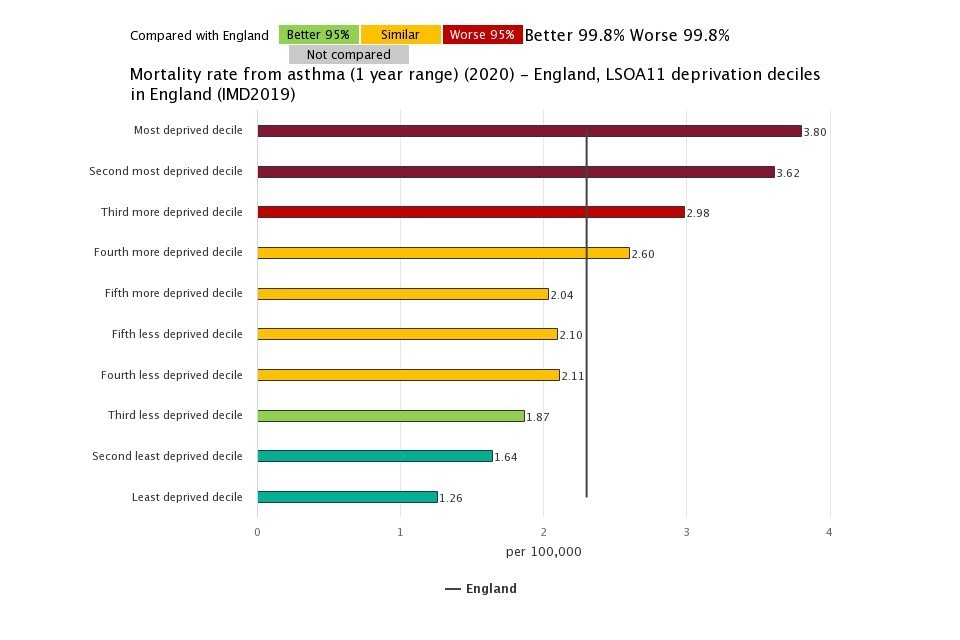
Deprivation is associated with higher rates of mortality from asthma. The more deprived groups have consistently had higher mortality rates. In 2020, there was an over 3-fold difference between the mortality rates of the most and least deprived.
CCG rates (1-year) varied from the highest mortality rate from asthma in NHS Cannock Chase CCG at 9.3 per 100,000 population (13 deaths) to the lowest rate in NHS Hampshire, Southampton and Isle of Wight CCG at 1.2 per 100,000 population (23 deaths). The CCG with the largest count of deaths from asthma was NHS North West London with 57 (3.7 per 100,000 population).
Figure 5: mortality rate from asthma, per 100,000 population, all ages, 2020, by IMD 2019 lower super output area deciles in England
Background and further information
The INHALE respiratory disease profile provide an invaluable resource relating to one of the leading causes of death in England. The profile contains data for CCGs, lower tier local authorities and upper tier local authorities. These indicators will support the work of health and wellbeing boards presenting local key statistics and highlighting questions to ask locally about current action to prevent respiratory disease.
Further details about the profile methodology are available within the definitions section of the online version of the INHALE profile.
Responsible statistician, product lead: Liz Rolfe, Julia Verne
For queries relating to this document, please contact healthcare.variation@phe.gov.uk