Interactive Health Atlas of Lung conditions in England (INHALE): February 2022 update
Published 1 February 2022
Applies to England

© Crown copyright 2022
This publication is licensed under the terms of the Open Government Licence v3.0 except where otherwise stated. To view this licence, visit nationalarchives.gov.uk/doc/open-government-licence/version/3 or write to the Information Policy Team, The National Archives, Kew, London TW9 4DU, or email: psi@nationalarchives.gov.uk.
Where we have identified any third party copyright information you will need to obtain permission from the copyright holders concerned.
This publication is available at https://www.gov.uk/government/statistics/interactive-health-atlas-of-lung-conditions-in-england-inhale-2022-update/interactive-health-atlas-of-lung-conditions-in-england-inhale-february-2022-update
1. New in this update
1.1 New emergency admissions data has been added to the INHALE Profile
This update includes new data for 5 indicators in the INHALE profile for the financial years 2019/20 and 2020/21. They are emergency hospital admissions for:
-
respiratory disease (all ages)
-
COPD (Chronic Obstructive Pulmonary Disease) (all ages)
-
pneumonia (all ages)
-
asthma in adults (aged 19 years and over)
-
bronchiolitis in children aged under 2 years
The indicators are based on primary diagnosis code only and do not include admissions for which COVID-19 was the primary diagnosis.
The indicators have been recalculated for all years to fit the new 2021 Clinical Commissioning Group (CCG) configurations. Due to these reconfigurations, some values may not match those previously published.
The respiratory disease, COPD, pneumonia and asthma in adults indicators are presented as directly standardised rates (DSRs). The bronchiolitis in children aged under 2 years indicator is presented as a crude rate.
2. Main findings
This update shows there has been a significant drop in emergency hospital admissions for respiratory disease from 1,592 per 100,000 population in the financial year ending 2020 to 711 per 100,000 population in the financial year ending 2021. From 2013/14 to 2019/20 the rate of respiratory disease admissions had been increasing.
Emergency hospital admissions for COPD have significantly dropped in the financial year ending 2021, from 246.7 per 100,000 population in the financial year ending 2020 to 133.5 per 100,000 population in the financial year ending 2021. Rates remain high in England’s formerly industrial areas of the North and Midlands.
There has been a significant drop in emergency hospital admissions for pneumonia from 489.7 per 100,000 population in the financial year ending 2020 to 241.7 per 100,000 population in the financial year ending 2021. A significant drop was observed in all CCGs.
The total number of emergency admissions for asthma aged 19 years and over in the financial year ending 2021 was less than half that in the previous financial year (21,125 patients in the financial year ending 2021, 44,820 patients in the financial year ending 2020).
There has been a large drop in the number of emergency patients admitted to hospital with bronchiolitis in children aged under 2 years, from 47,506 admissions in the financial year ending 2020 to 6,633 admissions in the financial year ending 2021. There was a significant drop in the rate of emergency admissions in all CCGs during the same time period.
The reasons for these significant falls in admissions are complex and may include:
- displacement of these primary admission diagnoses by COVID-19, especially in older people with co-morbid risk factors such as COPD
- less exposure to other respiratory infections which could trigger admission from these diagnoses due to lockdowns
- mask wearing and other infection control measures
- enhanced management of people in the community instead of hospital
3. Summary
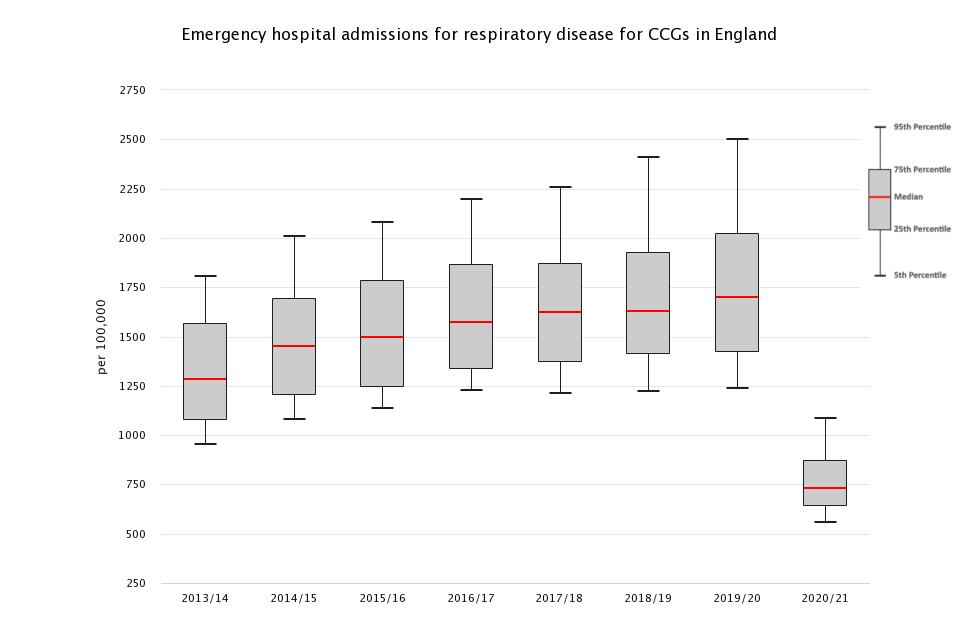
3.1 Emergency hospital admissions for respiratory disease (all ages)
This indicator has been updated and previous data refreshed to present data from the financial year 2013/14 to 2020/21 for persons of all ages, using the 2021 CCG configurations. This indicator is presented as a DSR and based on admissions for which respiratory disease was the primary diagnosis. This does not include admissions for which COVID-19 was the primary diagnosis.
The emergency hospital admissions rate in England for respiratory disease has steadily and significantly increased year on year from the financial year ending 2014, with a rate of 1,228 (1,225 to 1,231) per 100,000 population, to the financial year ending 2020, with a rate of 1,592 (1,588 to 1,595) per 100,000 population. There was a significant decrease in the rate to 711 (709 to 713) per 100,000 population in the financial year ending 2021. In the financial year ending 2020 there were 917,209 admissions, whereas in the financial year ending 2021 there were only 407,719 admissions, less than half the admissions in the previous time period.
In the financial year ending 2021,the rate of emergency admissions for respiratory disease varied across CCGs from the highest in NHS Knowsley CCG at 1,145 (1,091 to 1,201) per 100,000 population to the lowest rate in NHS Mid Essex CCG at 511 (489 to 533) per 100,000 population. The CCG with the largest count of emergency admissions for respiratory disease is NHS Hampshire, Southampton and Isle of Wight CCG at 12,475 while the CCG with the lowest count of admissions was NHS West Lancashire CCG at 775, a 16-fold difference.
The interquartile range is smaller in the financial year ending 2021 than for any shown prior, indicating a smaller variation in the rates of emergency admissions for respiratory disease between CCGs.
Figure 1: Box plots of emergency hospital admission rates for respiratory disease, per 100,000 population, by CCG
3.2 Emergency hospital admissions for COPD (all ages)
This indicator has been updated and previous data refreshed to present data from the financial year 2013/14 to 2020/21 for persons of all ages, using the 2021 CCG configurations. This indicator is presented as a DSR and based on admissions for which COPD was the primary diagnosis.
The England value remained steady from 2014/15 to 2019/20, but saw a significant drop in the financial year ending 2021, down from 246.7 (245.4 to 248.0) per 100,000 population in the financial year ending 2020 to 133.5 (132.5 to 134.4) in the financial year ending 2021. In the financial year ending 2020 there were 133,916 admissions, whereas in the financial year ending 2021 there were only 73,834 admissions.
Every CCG saw a significant decrease in the rate of emergency admissions for COPD from 2019/20 to 2020/21.
In the financial year ending 2021, the CCG with the highest rate of emergency hospital admissions for COPD was NHS Knowsley CCG at 287.2 (260.4 to 316.0) per 100,000 population while NHS Buckinghamshire CCG had the lowest rate of 69.5 (62.7 to 76.8) per 100,000 population. NHS Kent and Medway CCG had the highest number of emergency hospital admissions for COPD (2,200) and NHS Bassetlaw CCG had the lowest number of admissions (120).
The interquartile range of all CCG values in the financial year ending 2021 was almost half that of previous years, indicating a smaller spread of CCG values per 100,000 population.
Figure 2 illustrates the pattern of higher rates of COPD emergency admissions in industrial areas in the North of England and Midlands. Lower rates of emergency admissions for COPD are seen throughout the South of England.
Figure 2: Map of emergency admission rates for COPD, per 100,000 population, by CCG, 2020/21

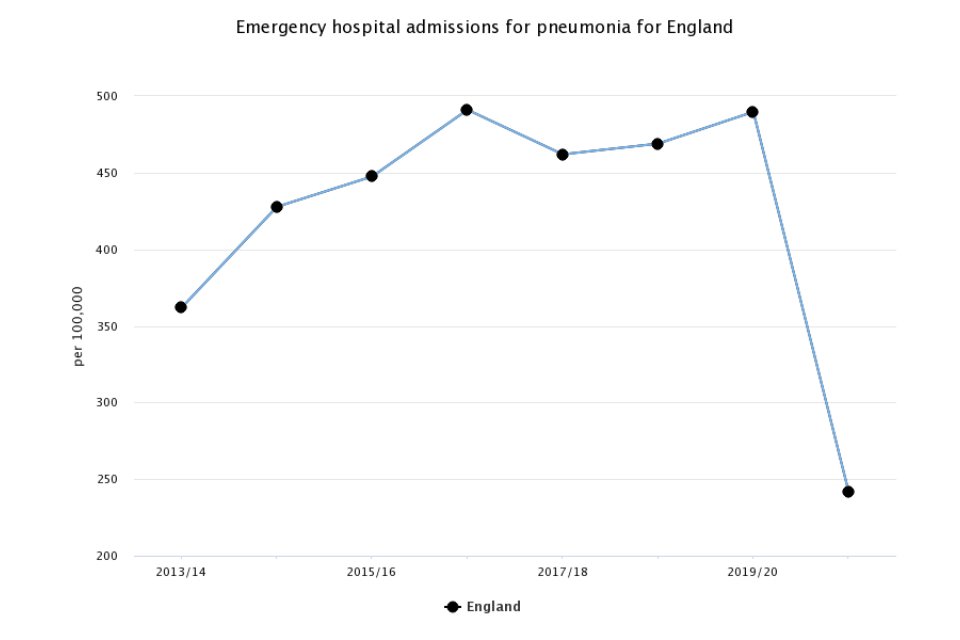
3.3 Emergency hospital admissions for pneumonia (all ages)
This indicator has been updated and previous data refreshed to present data from the financial year 2013/14 to 2020/21 for persons of all ages, using the 2021 CCG configurations. This indicator is presented as a DSR and based on admissions for which pneumonia was the primary diagnosis.
England values for pneumonia emergency admissions exhibited steady, significant increases in the financial year 2013/14 to 2016/17, followed by a significant decrease in 2017/18. Admissions then began to increase significantly from 2017/18 to 2019/20 until the sharp drop in the most recent financial year.
In the financial year ending 2021, there were half as many emergency admissions for pneumonia in England (134,999) than there were in the financial year ending 2020 (270,081) and the rate of emergency admissions for pneumonia fell from 489.7 (487.8 to 491.5) per 100,000 population in the financial year ending 2020 to 241.7 (240.4 to 243.0) per 100,000 population in the financial year ending 2021.
Emergency admissions for pneumonia are higher in the North of England and parts of the Midlands. All CCGs experienced a significant decrease in rates of emergency admissions for pneumonia from 2019/20 to 2020/21. The CCG with the highest rate of emergency admissions for pneumonia was NHS Salford CCG at 473.7 (443.7 to 505.1) per 100,000 population. NHS Morecambe Bay CCG has the lowest rate at 174.4 (161.4 to 188.1) per 100,000 population.
Figure 3: Trend chart of emergency hospital admission rate for pneumonia, per 100,000 population, England
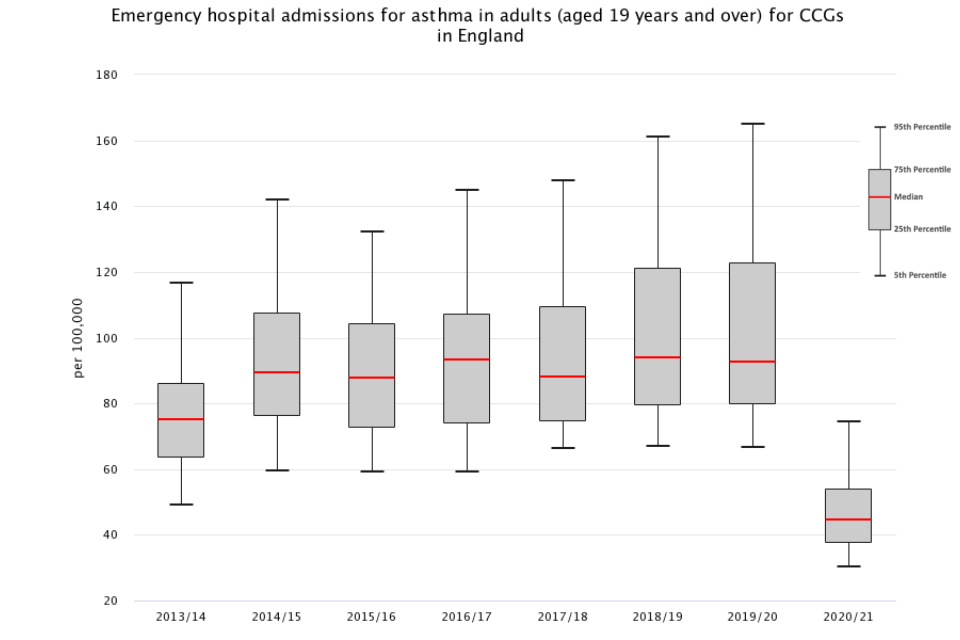
3.4 Emergency hospital admissions for asthma in adults (aged 19 years and over)
This indicator has been updated and previous data refreshed to present data from the financial year 2013/14 to 2020/21 for persons aged 19 and over, using the 2021 CCG configurations. This indicator is presented as a DSR and based on admissions for which asthma was the primary diagnosis.
In England, the rate of admissions dropped from 95.9 (95.0 to 96.8) per 100,000 population in the financial year ending 2020 to 44.4 (43.8 to 45.0) in the financial year ending 2021, with fewer than half as many patients admitted in the financial year ending 2021 (21,125) than were admitted in the previous financial year (44,820).
In the financial year ending 2021 NHS Wirral CCG had the highest rate of admissions at 85.5 (74.5 to 97.6) per 100,000 population while NHS Mid Essex CCG had the lowest of 28.3 (22.7 to 34.8) per 100,000 population. NHS North West London CCG had the highest count (730) of emergency admissions from asthma in adults in England while NHS Bassetlaw CCG had the lowest count (30).
The interquartile range in the box and whisker plot in Figure 4 illustrates a smaller interquartile range in the financial year ending 2021 than in any year previously shown, reflecting a smaller spread of data.
Figure 4: Box plots of emergency hospital admission rates for asthma in adults (aged 19+), per 100,000 population, by CCG
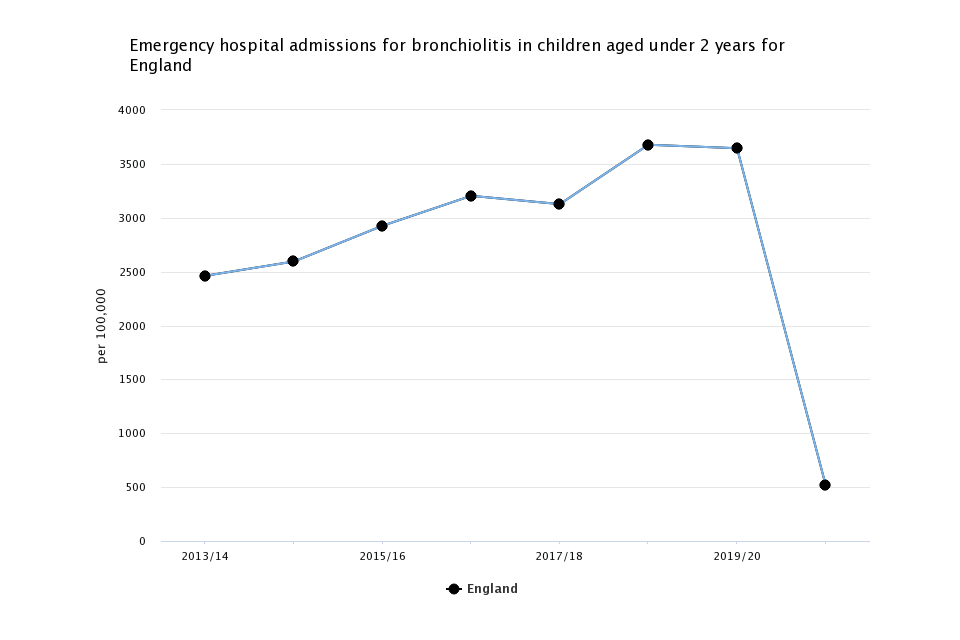
3.5 Emergency hospital admissions for bronchiolitis in children aged under 2 years
This indicator has been updated and previous data refreshed to present data from the financial year 2013/14 to 2020/21 for children aged under 2 years, using the 2021 CCG configurations. This indicator is presented as a crude rate and based on admissions for which bronchiolitis was the primary diagnosis.
In England, the rate of emergency hospital admissions for bronchiolitis in children under 2 years dropped from 3,645 (3,612 to 3,678) per 100,000 population in the financial year ending 2020 to 518 (506 to 531) per 100,000 population in the financial year ending 2021. In the financial year ending 2020 there were 47,506 admissions, in the financial year ending 2021 there were only 6,633 admissions.
NHS East Lancashire had the highest rate of emergency hospital admissions for bronchiolitis in children aged under 2 years with a rate of 1,289 (1,064 to 1,547) per 100,000 population in the financial year ending 2021. NHS Thurrock CCG had the lowest rate of 200 (96 to 368) per 100,000 population.
All CCGs experienced a significant decrease in rates of emergency hospital admissions for bronchiolitis from 2019/20 to 2020/21.
Figure 5: Trend chart of emergency hospital admission rate for bronchiolitis in children aged under 2 years per 100,000 population, England
4. Background and further information
The INHALE respiratory disease profile provides an invaluable resource relating to one of the leading causes of death in England. The profile contains data for CCGs, lower tier local authorities and upper tier local authorities. These emergency hospital admissions indicators will support the work of health and wellbeing boards presenting local key statistics and highlighting questions to ask locally about current action to prevent respiratory disease.
Further details about the profile methodology are available within the definitions section of the online version of the INHALE profile.
Responsible statistician, product lead: Liz Rolfe, Julia Verne
For queries relating to this document, please contact: healthcare.variation@phe.gov.uk