Summary - Individual Insolvency Statistics April to June 2021
Published 30 July 2021

© Crown copyright 2021
This publication is licensed under the terms of the Open Government Licence v3.0 except where otherwise stated. To view this licence, visit nationalarchives.gov.uk/doc/open-government-licence/version/3 or write to the Information Policy Team, The National Archives, Kew, London TW9 4DU, or email: psi@nationalarchives.gov.uk.
Where we have identified any third party copyright information you will need to obtain permission from the copyright holders concerned.
This publication is available at https://www.gov.uk/government/statistics/individual-insolvency-statistics-april-to-june-2021/summary-individual-insolvency-statistics-april-to-june-2021
Total individual insolvencies in England & Wales decreased by 4% from Q1 2021 to 27,662 in Q2 2021
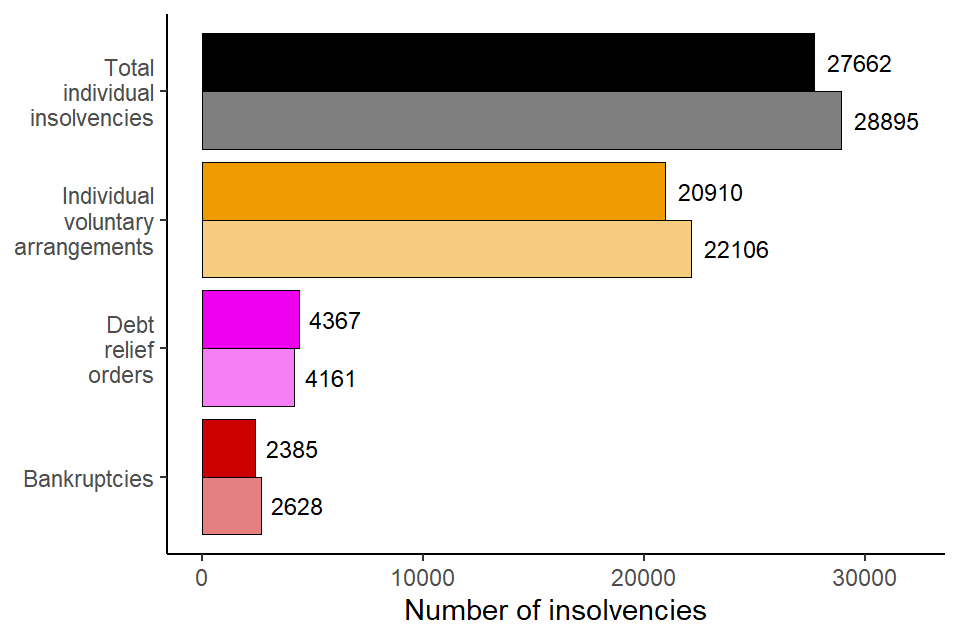
A bar chart showing the number of individual insolvencies in Q2 2021 compared to Q1 2021 by type. The data can be found in Table 1a of the accompanying tables.
| 2021 Q2 | % change from Q1 2021 | |
|---|---|---|
| Total individual insolvencies | 27,662 | -4% |
| Bankruptcies | 2,385 | -9% |
| Debt relief orders | 4,367 | +5% |
| Individual voluntary arrangements | 20,910 | -5% |
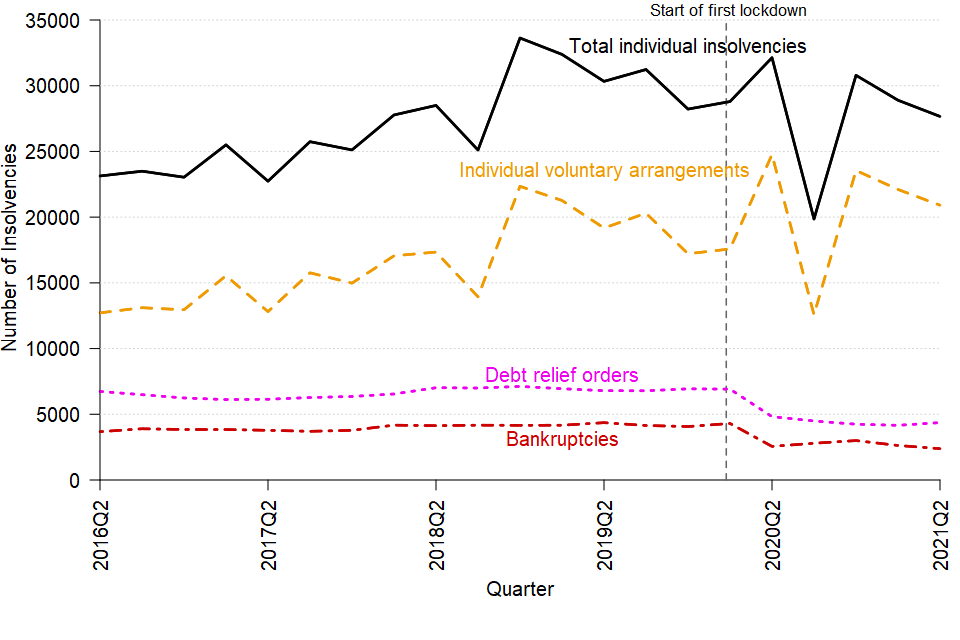
Numbers of bankruptcies and debt relief orders remained lower than pre-pandemic levels
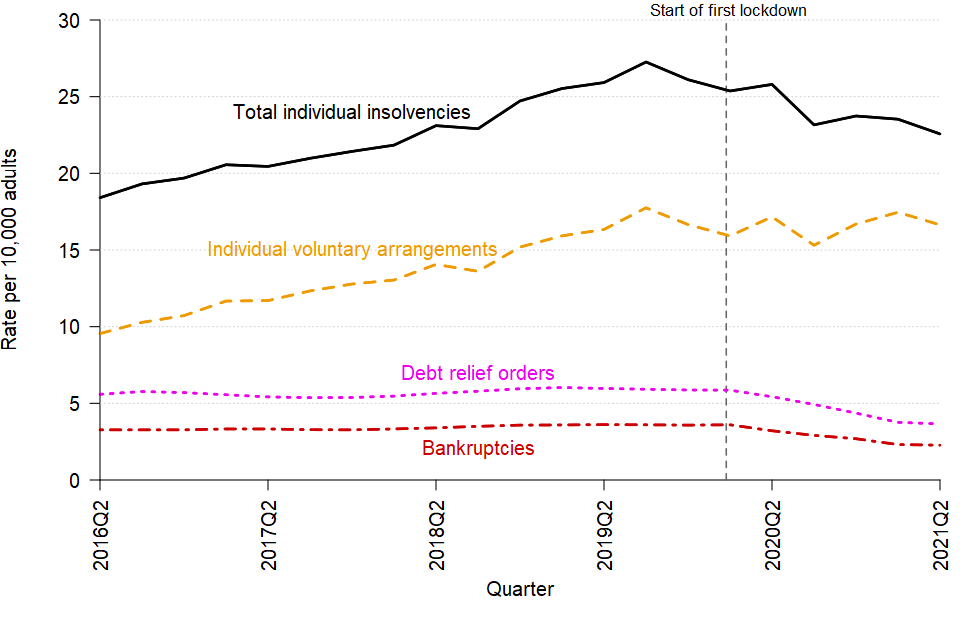
A line chart showing the change over time in the individual insolvency rate in England and Wales between Q2 2016 and Q2 2021. The data can be found in Table 2 of the accompanying tables.
The insolvency rate per 10,000 adults also fell, driven mostly by a lower rate of individual voluntary arrangements
A line chart showing the change over time in the quarterly number of individual insolvencies in England and Wales between Q2 2016 and Q2 2021. The data can be found in Table 1a of the accompanying tables.