Commentary - Individual Insolvency Statistics October 2026
Published 17 November 2026

© Crown copyright 2026
This publication is licensed under the terms of the Open Government Licence v3.0 except where otherwise stated. To view this licence, visit nationalarchives.gov.uk/doc/open-government-licence/version/3 or write to the Information Policy Team, The National Archives, Kew, London TW9 4DU, or email: psi@nationalarchives.gov.uk.
Where we have identified any third party copyright information you will need to obtain permission from the copyright holders concerned.
This publication is available at https://www.gov.uk/government/statistics/individual-insolvencies-october-2026/commentary-individual-insolvency-statistics-october-2026
Released
17 November 2026
Next release
18 December 2026
Media enquiries
press.office@insolvency.gov.uk
+44 (0)30 3003 1743
Statistical enquiries
Joseph Parker (author)
David Webster (responsible statistician)
This publication relates to individual insolvency only. Statistics relating to company insolvency can be found on the company insolvency releases page.
1. Main messages for England and Wales
-
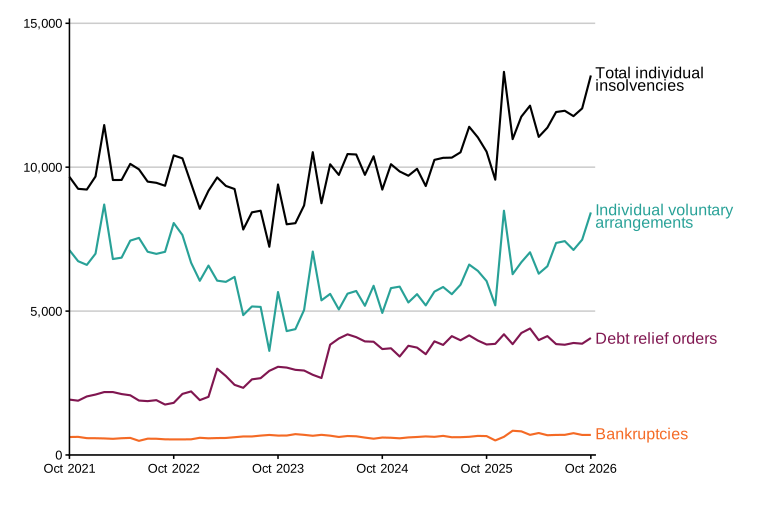
In October 2026, 13,187 individuals entered insolvency in England and Wales. This was 10% higher than September 2026 and 25% higher than in October 2025 and is the third highest monthly number of individual insolvencies on record.
-
The individual insolvencies consisted of 696 bankruptcies, 4,064 debt relief orders (DROs) and 8,427 individual voluntary arrangements (IVAs). With the exception of December 2025, which was affected by the clearing of a backlog of cases that were agreed in previous months, this is the highest monthly number of IVAs since February 2022. DRO numbers in October 2026 were 5% higher than in September 2026 and similar to the monthly average over the past 12 months. The number of bankruptcies was the same as in September 2026 and 6% higher than in October 2025.
-
In the 12 months ending 31 October 2026, one in 352 adults in England and Wales entered insolvency (at a rate of 28.4 per 10,000 adults). This is higher than the rate of 25.0 per 10,000 adults (one in 400) who entered insolvency in the 12 months ending 31 October 2025.
-
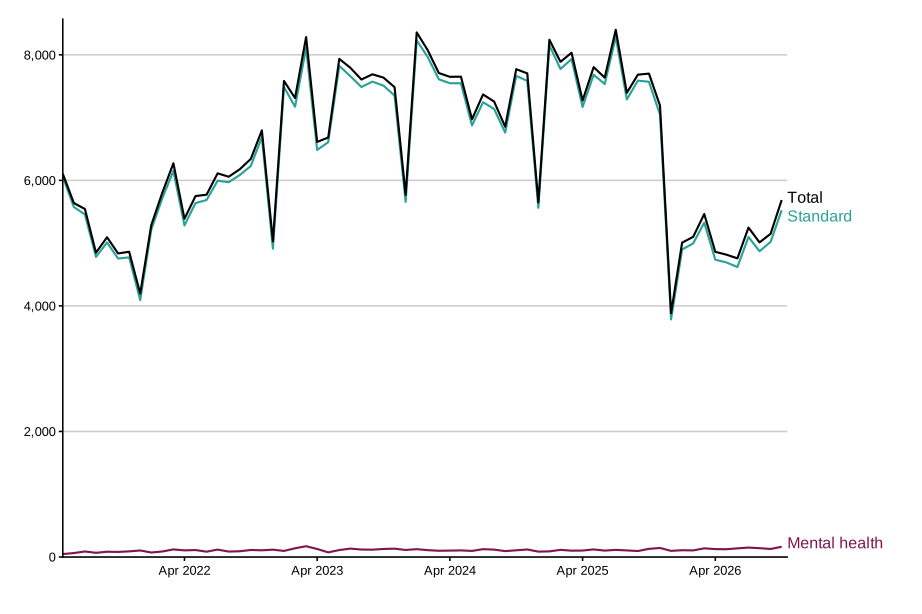
There were 5,687 Breathing Space registrations in October 2026. This is 26% lower than in October 2025. Numbers of breathing spaces have been lower since December 2025 after the largest money advisor group by number of cases updated its suitability criteria for its clients to apply for a breathing space.
Figure 1: Individual insolvency numbers in October 2026 were higher than in both September 2026 and October 2025.
Monthly individual insolvencies by type, England and Wales, October 2021 to October 2026, seasonally adjusted
Source: Insolvency Service
The long-term series back to January 2000 (where applicable) can be found in the comma-separated values (CSV) file that accompanies this release. Data prior to 2000 can be found in the long-run individual insolvencies CSV file or back to 1960 (where available) on the National Archives website.
1.1 Things you need to know about this release
This statistics release contains the latest data on individual insolvency in the United Kingdom, presenting the numbers of individuals who have entered a formal insolvency procedure after being unable to pay their debts. Informal debt solutions, such as debt management plans, are not included in these statistics. Information is presented separately for England and Wales, Scotland and Northern Ireland.
Underlying data for these monthly statistics for England and Wales were adjusted using an autoregressive integrated moving average (ARIMA) model where there was evidence of seasonality. This removal of systematic calendar-related variation enables comparisons to be made between months and the underlying trend in insolvency numbers to be determined. In accordance with the outcome of the April 2026 Seasonal Adjustment Review, bankruptcies, DROs and IVAs were all seasonally adjusted. Where applicable, seasonally adjusted numbers are used and referred to throughout this commentary. For the series which have been seasonally adjusted, the underlying (non-seasonally adjusted) numbers can be found in Tables 1b, 3b and 4b of the accompanying tables. Breathing space registration figures are not seasonally adjusted as the time series is not yet sufficiently long to support reliable adjustment. Data for Scotland and Northern Ireland are not seasonally adjusted.
Sections on bankruptcies by self-employment status and Tables 4a and 4b of the accompanying tables were unavailable between November 2025 and August 2026. This was due to a delay in the recording of trader bankruptcy status and associated SIC codes following the introduction of a new case management system. Monthly publication of bankruptcy numbers by self-employment status resumed in September 2026.
However, information relating to numbers of self-employed bankruptcies by industry remains unavailable. We are still working with operational and data engineering colleagues to resolve this and will update users on progress no later than January 2027.
The numbers of breathing space registrations under the Debt Respite Scheme are included in these statistics. Individuals that register for breathing space may or may not end up entering a formal insolvency procedure. Those that do enter a formal insolvency procedure will be counted accordingly in Tables 1 to 5 of the accompanying tables.
Population estimates for people over the age of 18, as published by the Office for National Statistics, were used to calculate individual insolvency rates per 10,000 adults. The 2024-based population projections were used to calculate rates for 2025 and 2026.
All figures presented within this release are provisional and subject to review. Further detail can be found in the accompanying Individual Insolvency Statistics Methodology and Quality document.
1.2 Designation as accredited official statistics
These accredited official statistics were independently reviewed by the Office for Statistics Regulation (OSR) in July 2024. They comply with the standards of trustworthiness, quality and value in the Code of Practice for Statistics and are labelled ‘accredited official statistics’.
Further details of the OSR’s review of these statistics can be found in their published Compliance Check. You are welcome to contact us directly with any comments about how we meet these standards. Alternatively, you can contact OSR by emailing regulation@statistics.gov.uk or via the OSR website.
2. Individual insolvency in England and Wales
2.1 Number of individual insolvencies
Latest month
In October 2026, 13,187 individuals entered insolvency in England and Wales. This was 10% higher than in September 2026 and 25% higher than in October 2025, and is the third highest monthly number of individual insolvencies in the time series, which goes back to 1960. Only December 2025 and May 2020 had higher numbers of individual insolvencies, and both of these months were affected by delays in the registration of IVAs on Insolvency Service administrative systems, resulting in a large number of IVAs agreed in previous months being registered in these months. The change of 10% compared to September 2026 is higher than the average absolute change of 7% between consecutive months over the past three years.
IVAs were higher than in September 2026 and higher than average numbers observed over the past 12 months. With the exception of December 2025, which was affected by the clearing of a backlog of cases that were agreed in previous months, this is the highest monthly number since February 2022. The number of DROs made in October 2026 was higher than in September 2026 and similar to the average monthly numbers seen over the past 12 months. Bankruptcy numbers were the same as in September 2026 and 6% higher than in October 2025.
Long-term trends
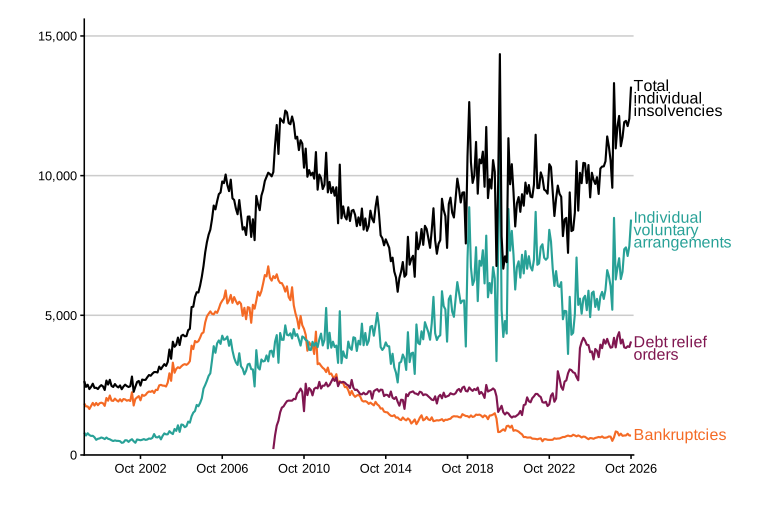
Total individual insolvency numbers peaked in 2009 and 2010 following the 2008-09 recession, then decreased over the next five years as the number of bankruptcies declined. Between 2015 and 2019, a rise in IVA numbers resulted in a corresponding increase in overall insolvency figures. During the COVID-19 pandemic, numbers of bankruptcies and DROs fell, and the increase in IVA numbers slowed. This resulted in lower overall individual insolvency figures between 2020 and 2022 compared to 2019, despite a record high in the annual number of IVAs in 2022.
The number of IVAs declined in 2023, reaching the lowest level since 2017. This drop coincided with a number of changes to the wider regulatory landscape. The Financial Conduct Authority introduced a ban on debt packagers receiving remuneration for referrals to IVA firms. Additionally, Recognised Professional Bodies adopted a new Statement of Insolvency Practice in relation to take-on procedures. In 2024, IVAs increased slightly on 2023 levels, and in 2025, they increased further, but remained below the record annual numbers seen between 2018 and 2022.
Annual numbers of DROs increased every year from 2021 to 2025. Numbers rose following the expansion of the eligibility criteria in June 2021 and the introduction of new DRO hubs in February 2023. Further larger increases followed the removal of the £90 administration fee to obtain a DRO from 6 April 2024 and the expansion of eligibility criteria in June 2024. Numbers in 2025 were higher than 2024, making it the year with the highest volume of DROs since their introduction in 2009.
In 2025, bankruptcy numbers were slightly lower than in 2024 and remained at less than half of pre-2020 levels, but were higher than the 40-year low seen in 2022.
Figure 2: Individual insolvency numbers in October 2026 were higher than in September 2026, driven by an increase in IVA volumes.
Monthly individual insolvencies by insolvency type, England and Wales, January 2000 to October 2026, seasonally adjusted
Source: Insolvency Service
The long-term series back to January 2000 can be found in the CSV file that accompanies this release. Data prior to 2000 can be found in the long-run individual insolvencies CSV file or back to 1960 (where available) on the National Archives website.
These monthly statistics are seasonally adjusted to account for seasonal variation in insolvencies across the year and allow the underlying trend to be determined. Both adjusted and unadjusted numbers can be found in the accompanying data tables.
In the 12 months to 31 October 2026, 60% of individual insolvencies were IVAs, 34% were DROs, and 6% were bankruptcies. In the previous 12 months (ending October 2025), 57% of individual insolvencies were IVAs, 37% were DROs, and 6% were bankruptcies. The long-term trend shows a decrease in the proportion of individual insolvencies that are bankruptcies. In 2016, for example, 54% of individual insolvencies were IVAs, 29% were DROs and 17% were bankruptcies.
Table 1: The number of individual insolvencies in October 2026 was higher than in both September 2026 and October 2025, driven primarily by an increase in IVAs.
| Period | Total individual insolvencies | Bankruptcies | Debt relief orders | Individual voluntary arrangements |
|---|---|---|---|---|
| Oct 2025 | 10,539 | 656 | 3,840 | 6,043 |
| Jul 2026 | 11,960 | 699 | 3,830 | 7,431 |
| Aug 2026 | 11,774 | 758 | 3,892 | 7,124 |
| Sep 2026 | 12,042 | 696 | 3,866 | 7,480 |
| Oct 2026 | 13,187 | 696 | 4,064 | 8,427 |
| Percentage change, latest month compared to: | ||||
| vs Oct 2025 | 25% | 6% | 6% | 39% |
| vs Sep 2026 | 10% | 0% | 5% | 13% |
Source: Insolvency Service
The long-term series back to January 2000 can be found in the CSV file that accompanies this release. Data prior to 2000 can be found in the long-run individual insolvencies CSV file or back to 1960 (where available) on the National Archives website.
IVAs
The 8,427 IVAs registered in October 2026 was 13% higher than in September 2026 and 39% higher than in October 2025. IVA numbers in the first 10 months of 2026 were 18% higher than the 2025 monthly average. With the exception of December 2025, which was affected by the clearing of a backlog of cases that were agreed in previous months, this is the highest monthly number since February 2022.
Additional information relating to IVA numbers, including numbers by date of approval of creditors and numbers of registered IVAs by the firm managing the case can be found in Tables 1a, 1b, 1c and 7b of the accompanying data tables. Further information on the status of IVAs and the duration of terminated IVAs can be found in the annual IVA outcomes and provider publication.
DROs
In October 2026, there were 4,064 DROs, which was 5% higher than September 2026 and 6% higher than October 2025. Following the removal of a fee for entering a DRO in April 2024, monthly numbers over the past two years have been higher than at any point since their introduction. In the first 10 months of 2026, average monthly DRO numbers were similar to those seen in 2025.
Additional information relating to DRO numbers, including numbers by authorising body, can be found in Tables 1a, 1b and 7a of the accompanying data tables.
Bankruptcies
The number of bankruptcies in October 2026 was 696, which is equal to the number in September 2026 and 6% higher than in October 2025. Average monthly numbers of bankruptcies between March and October 2026 were 14% higher than the 2025 monthly average.
Additional information relating to bankruptcy numbers can be found in the sections below and in Tables 1a and 1b of the accompanying data tables. Information relating to Income Payment Agreements and Income Payment Orders in bankruptcy cases can be found in Table 5.
2.2 Breathing Space registrations
There were 5,687 breathing spaces registered under the Debt Respite Scheme in October 2026. This is 26% lower than in October 2025. Of the 5,687 breathing space registrations, 5,524 were Standard breathing space registrations and 163 were Mental Health breathing space registrations.
Between the start of the scheme in May 2021 and 31 October 2026, StepChange Debt Charity registered 55% of breathing spaces. However, in November 2025 StepChange updated its suitability criteria for its clients to apply for Breathing Space, which has led to a reduction in the volume of applications both for this provider and overall.
More information on numbers of Breathing Spaces, including by money advisor group, can be found in Tables 6 and 7c of the accompanying data tables.
Figure 3: The number of Breathing Spaces in October 2026 was lower than in October 2025.
Monthly Breathing Space registrations by type, England and Wales, May 2021 to October 2026, not seasonally adjusted
Source: Insolvency Service
2.3 Rates of individual insolvency per 10,000 adults
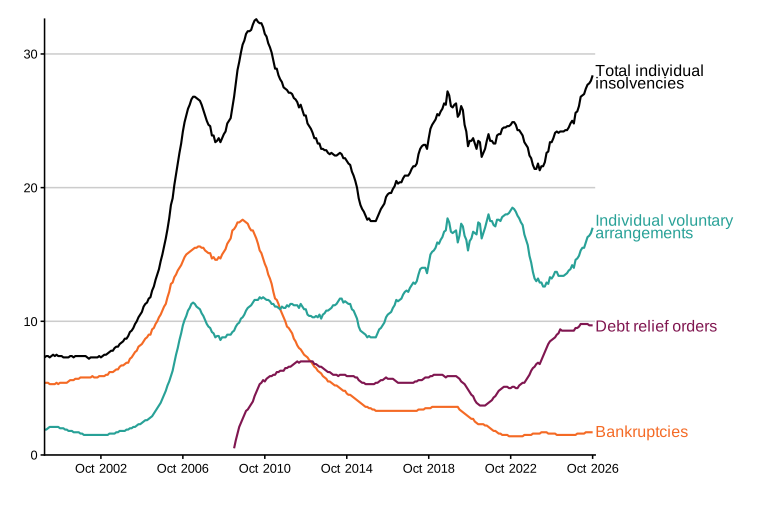
The individual insolvency rate in the 12 months to October 2026 was 28.4 per 10,000 adults in England and Wales (as shown in Table 2 and Figure 4 below). This corresponds to one in 352 adults having entered an insolvency procedure in the past 12 months.
The rate in the 12 months to October 2026 was higher than the rate in the 12 months to October 2025. This was mostly driven by the increase in the IVA rate, although rates of DROs and bankruptcies also increased slightly. Although the total number of individual insolvencies in the 12 months to October 2026 was similar to the highest 12-month period on record, the individual insolvency rate remains lower than the peak of 32.6 per 10,000 adults recorded in May 2010. This is due to population growth since that time. Nevertheless, the individual insolvency rate in October 2026 was the highest since May 2011.
The insolvency rate is calculated as a proportion of the adult population, and is therefore more comparable over longer time periods than absolute numbers. A 12-month rolling rate is presented to reduce the volatility associated with estimates based on single months. The October 2026 rates, for example, were calculated using data covering the period 1 November 2025 to 31 October 2026.
Table 2: The rate of individual insolvency in the 12 months to October 2026 was higher than for October 2025. This was mostly driven by an increase in the IVA rate.
England and Wales, 12 month rolling rate per 10,000 adults, October 2025 to October 2026
| Period | Total individual insolvencies | Bankruptcies | Debt relief orders | Individual voluntary arrangements |
|---|---|---|---|---|
| Oct 2025 | 25.0 | 1.5 | 9.3 | 14.2 |
| Jul 2026 | 27.7 | 1.7 | 9.8 | 16.3 |
| Aug 2026 | 27.8 | 1.7 | 9.7 | 16.4 |
| Sep 2026 | 28.0 | 1.7 | 9.7 | 16.6 |
| Oct 2026 | 28.4 | 1.7 | 9.7 | 17.0 |
| Change in rate, latest month compared to: | ||||
| vs Oct 2025 | 3.4 | 0.2 | 0.4 | 2.8 |
Please note that the total values may not equal the sum of their components due to rounding.
The long-term series back to January 2000 (where applicable) can be found in the CSV file that accompanies this release. Data prior to 2000 can be found in the long-run individual insolvencies CSV file or back to 1960 (where available) on the National Archives website.
In the 12 months to October 2026:
-
the IVA rate increased by 2.8 in comparison to the 12 months ending October 2025
-
the rate of DROs increased by 0.4
-
the rate of bankruptcy increased by 0.2
Further details can be found in Table 2 of the accompanying data tables.
Figure 4: The individual insolvency rate in the 12 months to October 2026 was higher than in the 12 months to October 2025.
12-month rolling insolvency rate per 10,000 adults, England and Wales, January 2000 to October 2026
Source: Insolvency Service
The long-term series back to January 2000 (where applicable) can be found in the CSV file that accompanies this release. Data prior to 2000 can be found in the long-run individual insolvencies CSV file or back to 1960 (where available) on the National Archives website.
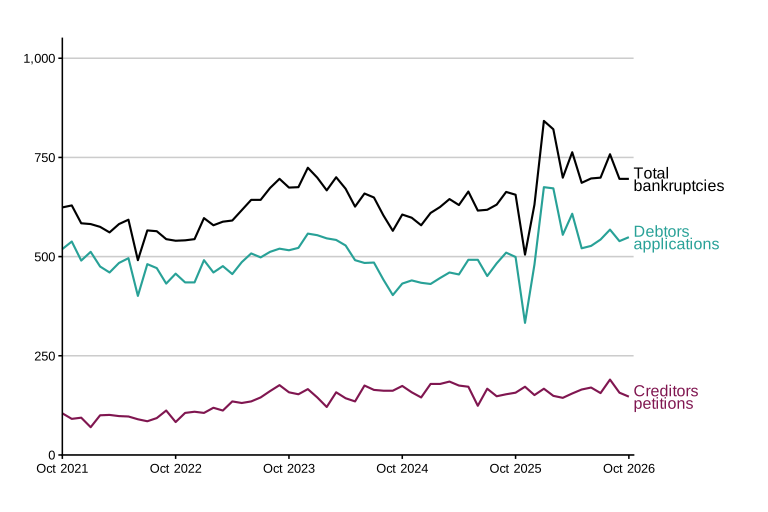
2.4 Bankruptcies by petition type
There were 696 bankruptcies in October 2026, consisting of:
-
549 resulting from debtors’ applications, which was 2% higher than in September 2026 and 10% higher than in October 2025
-
147 resulting from creditors’ petitions, which was 6% lower than in September 2026 and 6% lower than October 2025
Some creditor bankruptcies for the latest month may not yet have been entered onto the administrative system at the time of data extraction, so this number may be revised upwards in next month’s publication.
In the 12 months between November 2025 and October 2026, 77% of bankruptcies resulted from debtors’ applications, an increase from 74% over the preceding 12 months.
More detail can be found in Tables 3a and 3b of the accompanying data tables.
Figure 5: Bankruptcies resulting from debtors’ applications in October 2026 were higher than in both September 2026 and October 2025.
Monthly bankruptcies by petition type, England and Wales, October 2021 to October 2026, seasonally adjusted
Source: Insolvency Service
The long-term series can be found in the CSV file that accompanies this release. Data prior to 2000 can be found in the long-run individual insolvencies CSV file or back to 1960 (where available) on the National Archives website.
2.5 Bankruptcies by self-employment status
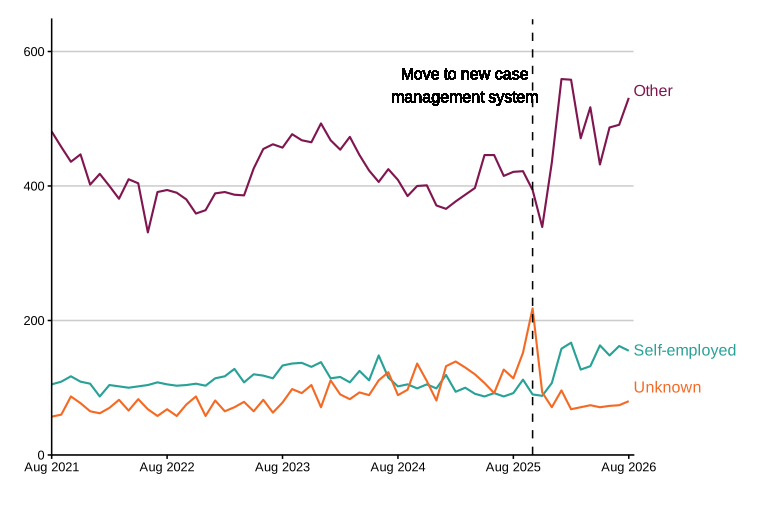
Sections on bankruptcies by self-employment status and Tables 4a and 4b of the accompanying tables were unavailable between November 2025 and August 2026. This was due to a delay in the recording of trader bankruptcy status and associated SIC codes following the introduction of a new case management system. Monthly publication of bankruptcy numbers by self-employment status resumed in September 2026.
However, information relating to numbers of self-employed bankruptcies by industry remains unavailable. We are still working with operational and data engineering colleagues to resolve this and will update users on progress no later than January 2027.
Bankruptcies by self-employment status are presented with a lag of two months compared to most of the other statistics in this release. This is because it can take several weeks for information relating to trading status to be recorded following the date of the bankruptcy order.
In August 2026, there were 155 bankruptcies where the individual was self-employed. This is 4% lower than in July 2026 but 68% higher than in August 2025. In August 2026, there were 80 bankruptcies with unknown employment status, lower than the 114 in August 2025. Following the Insolvency Service’s move to a new case management system on 1 November 2025, more complete data is available on the trader status of bankruptcies. The increases in the recorded number of self-employed and other bankruptcies are likely to be partially linked to the lower number of cases where the trader status is unknown.
There were 531 bankruptcies among other individuals in August 2026, which is 8% higher than in July 2026 and 26% higher than in August 2025.
Figure 6: The number of self-employed individuals entering bankruptcy in August 2026 was lower than in July 2026.
Monthly bankruptcies by employment status, England and Wales, August 2021 to August 2026, seasonally adjusted
Source: Insolvency Service
The long-term series can be found in the CSV file that accompanies this release. Data prior to 2000 can be found in the long-run individual insolvencies CSV file or back to 1960 (where available) on the National Archives website.
More detail can be found in Tables 4a and 4b of the accompanying data tables. In approximately 15% of bankruptcy cases in the past three years, the employment status is unknown. However, in the 10 months since the introduction of the new case management system, 11% of bankruptcy cases had unknown employment status, lower than the 20% unknown in the previous 12 months.
3. Individual insolvency in Scotland
Legislation relating to individual insolvency in Scotland is devolved. The Accountant in Bankruptcy (AiB), Scotland’s Insolvency Service, administers individual insolvency in Scotland. The figures below are not seasonally adjusted. The AiB produces individual insolvency statistics on a quarterly basis. Therefore, the numbers in this section are updated once every three months only.
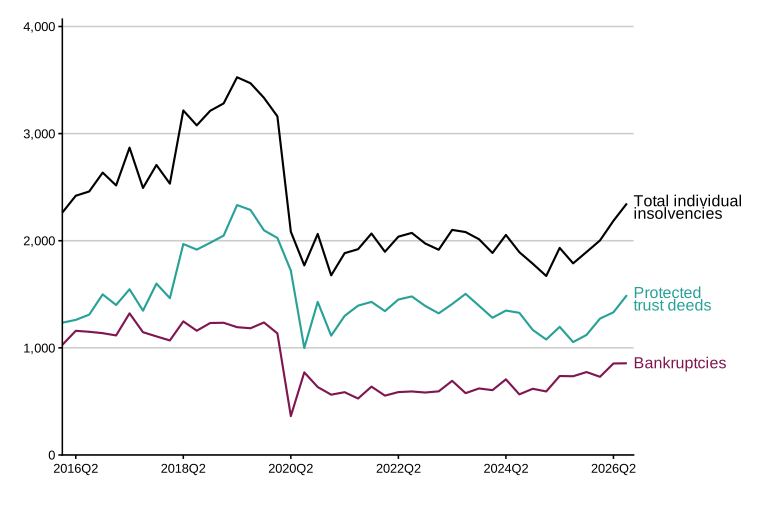
The quarters referred to are calendar year quarters, such that Q3 2026 covers the period 1 July to 30 September 2026. In Q3 2026, there were 2,348 individual insolvencies in Scotland, which was 31% higher than in the same quarter of 2025.
The individual insolvencies were comprised of 1,492 protected trust deeds and 856 bankruptcies (also known as sequestrations), of which 446 went into bankruptcy via the minimal asset process route. The rules regarding bankruptcy differ to those in England and Wales, so numbers of bankruptcies are not directly comparable.
Figure 7: The number of individual insolvencies in Scotland in Q3 2026 was higher than in Q3 2025.
Quarterly individual insolvencies by type. Scotland, Q1 2016 to Q3 2026, not seasonally adjusted
Source: Accountant in Bankruptcy, Scotland
The long-term series can be found in the long-run individual insolvencies CSV file.
More detail can be found in the AiB statistical release.
4. Individual insolvency in Northern Ireland
Individual insolvency in Northern Ireland is governed by separate, but broadly similar, legislation to England and Wales. Therefore, figures are presented separately.
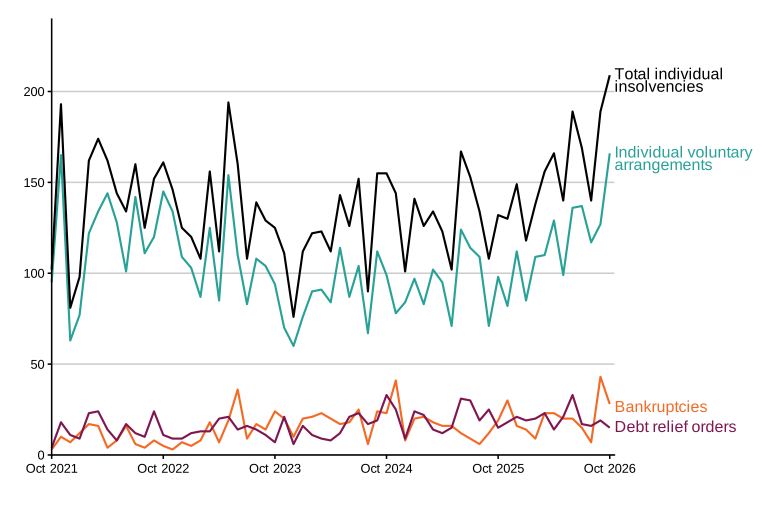
In October 2026, there were 209 individual insolvencies in Northern Ireland. This was 58% higher than in October 2025. There were 166 IVAs, 15 DROs and 28 bankruptcies.
Figure 8: Total individual insolvencies in Northern Ireland in October 2026 were higher than in October 2025, driven by an increase in IVAs.
Monthly individual insolvencies by type, Northern Ireland, October 2021 to October 2026, not seasonally adjusted
Source: Department for the Economy, Northern Ireland
The quarterly long-term series can be found in the long-run individual insolvencies CSV file.
5. Data and Methodology
5.1 Data sources
Individual insolvency data for England and Wales were sourced from the Insolvency Service Case Management System. Individual insolvency data for Northern Ireland were sourced from the Department for the Economy. Numbers for Scotland were sourced from AiB Official Statistics. Breathing space data for England and Wales were sourced from the Breathing Space register.
Population estimates for people over the age of 18, as published by the Office for National Statistics, were used to calculate individual insolvency rates per 10,000 adults. The 2024-based population projections were used to calculate rates for 2025 and 2026.
Sections on bankruptcies by self-employment status and Tables 4a and 4b of the accompanying tables were unavailable between November 2025 and August 2026. This was due to a delay in the recording of trader bankruptcy status and associated SIC codes following the introduction of a new case management system. Monthly publication of bankruptcy numbers by self-employment status resumed in September 2026.
However, information relating to numbers of self-employed bankruptcies by industry remains unavailable. We are still working with operational and data engineering colleagues to resolve this and will update users on progress no later than January 2027.
More information on the administrative systems used to compile insolvency statistics can be found in the accompanying Individual Insolvency Statistics Methodology and Quality document.
5.2 Coverage
This statistical release presents individual insolvency statistics for England and Wales, Scotland and Northern Ireland. More detailed individual insolvency statistics for Scotland can be found on the AiB website. Insolvency statistics for Scotland and Northern Ireland are presented separately to statistics for England and Wales as they are covered by separate legislation and policy responsibility lies with the devolved administrations and may therefore not be directly comparable.
Informal debt solutions, such as debt management plans, are not included in these statistics.
5.3 Methodology and data quality
Detailed methodology and quality information for the monthly insolvency statistical releases can be found in the accompanying Individual Insolvency Statistics Methodology and Quality document.
The main quality and coverage issues to note:
-
This statistical release presents the numbers of IVAs based on their date of registration on Insolvency Service systems. Where there are significant delays in the registration of IVAs, numbers presented here will not reflect the number of IVAs agreed in a given month. Table 1c of the accompanying data tables presents numbers by approval date.
-
Underlying data for these monthly statistics for England and Wales were adjusted using an ARIMA model where there was evidence of seasonality. This removal of systematic calendar-related variation enables comparisons to be made between months and the underlying trend in insolvency numbers to be determined. Data for Scotland and Northern Ireland were not adjusted. The seasonal adjustment models are reviewed on an annual basis. In accordance with the outcome of the April 2026 Seasonal Adjustment Review, bankruptcies, DROs and IVAs were all seasonally adjusted. Seasonal adjustment in this publication typically results in numbers being adjusted by up to 10%. There are a few cases where the adjustment is larger. For example, bankruptcy numbers tend to be 20-30% lower during December than other months. Therefore, the process of seasonal adjustment increases the December bankruptcy numbers by approximately 20-30% to correspond to the underlying trend.
-
Insolvency Service data for the most recent month were extracted approximately five working days after month end and may be revised in the future. In particular, some creditor bankruptcies for the latest month may not yet have been entered onto the administrative system at the time of data extraction.
-
The shift to a new case management system in November 2025 has resulted in more complete trader bankrupctcy data being recorded since. In the 10 months since the introduction of the new case management system, 11% of bankruptcy cases had unknown employment status, lower than the 20% unknown in the previous 12 months.
5.4 Revisions
These statistics are subject to revisions, as set out in the published Revisions Policy. Revisions tend to be made as a result of data being entered onto administrative systems after the cut-off date for data being extracted to produce the statistics. In addition, seasonally adjusted numbers are revised in subsequent publications, as the ARIMA model used is updated with additional data. Any future revisions will be noted in the accompanying data tables.
6. Glossary
6.1 Key terms used within this statistical bulletin
| Term | Definition |
|---|---|
| ARIMA model | Autoregressive integrated moving average, or ARIMA, is a model fitted to time-series data to understand the underlying trend, or to forecast future data points. In this publication, ARIMA models with both non-seasonal and seasonal components are fit to insolvency data. The model removes the seasonal component of the data, including effects resulting from the time of year, as well as the varying number of trading days in different months. This allows month-to-month comparisons to be made. |
| Bankruptcy | A form of debt relief available for anyone who is unable to pay their debts. Assets owned will vest in a trustee in bankruptcy, who will sell them and distribute the proceeds to creditors. Discharge from debts usually takes place 12 months after the bankruptcy order is granted. Bankruptcies result from either a debtor application, where the individual is unable to pay their debts and applies online to make themselves bankrupt, or a creditor petition, where a creditor owed £5,000 or more can apply to the court to have the individual declared bankrupt. These statistics relate to petitions that resulted in a court order, although not all petitions lead to a bankruptcy order. |
| Breathing Space | For individuals, the Breathing Space scheme, launched on 4 May 2021, gives people legal protections from their creditors for 60 days, with most interest and penalty charges frozen, and enforcement action halted. Because problem debt can be linked to mental health issues, these protections are also available for people in mental health crisis treatment – for the full duration of their crisis treatment plus another 30 days. |
| Debt Relief Order (DRO) | A form of debt relief available to those who have a low income, low assets and debt no more than a specified value. There is no distribution to creditors, and discharge from debts takes place 12 months after the DRO is granted. DROs were introduced in April 2009. Following an announcement on 6 March 2024, the £90 administration fee to obtain a DRO was abolished on 6 April 2024. Furthermore, on 28 June 2024, the criteria for DRO eligibility were expanded. The debt threshold was increased from £30,000 to £50,000 and the allowable value of an exempt motor vehicle was increased from £2,000 to £4,000. |
| Individual Voluntary Arrangement (IVA) | A voluntary means of repaying creditors some or all of what they are owed. Once approved by 75% or more of creditors, the arrangement is binding on all. IVAs are supervised by licensed insolvency practitioners. |
| Standard Industrial Classification (SIC 2007) | Used in classifying business establishments and other statistical units by the type of economic activity in which they are engaged. Further information can be found on the Office for National Statistics website. |