Statistical commentary - November 2020
Published 27 November 2020

© Crown copyright 2020
This publication is licensed under the terms of the Open Government Licence v3.0 except where otherwise stated. To view this licence, visit nationalarchives.gov.uk/doc/open-government-licence/version/3 or write to the Information Policy Team, The National Archives, Kew, London TW9 4DU, or email: psi@nationalarchives.gov.uk.
Where we have identified any third party copyright information you will need to obtain permission from the copyright holders concerned.
This publication is available at https://www.gov.uk/government/statistics/income-tax-receipts-statistics-to-tax-year-2019-to-2020/statistical-commentary-november-2020
1. Summary
Key statistics for Income Tax in 2019 to 2020 are:
-
Total net Income Tax receipts in 2019 to 2020 are estimated to be £193.2 billion, 1.16% higher than in 2018 to 2019
-
Pay As You Earn (PAYE) Income Tax receipts for 2019 to 2020 are estimated to be £164.8 billion, 1.81% higher than the previous year
-
Self Assessment Income Tax receipts for 2019 to 2020 are estimated to be £32.2 billion, 2.11% higher than the previous year
-
Income Tax repayments in 2019 to 2020 are estimated at £7.7 billion
Figure 1: Income Tax Receipts 2010 to 2011 to 2019 to 2020
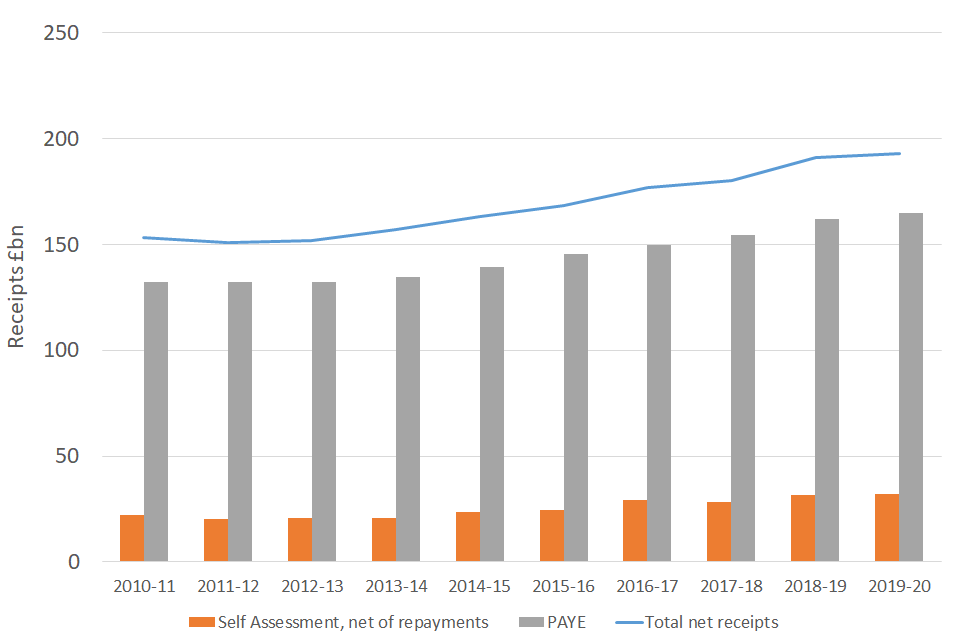
Figure 1: Income Tax Receipts 2010 to 2011 to 2019 to 2020
2. Income Tax Receipts
Table 2.8 provides a breakdown of net receipts of Income Tax by type of receipt and total repayments. It shows total net Income Tax receipts from 2008 to 2009 to 2019 to 2020. Total net receipts in 2019 to 2020 reached their highest ever level for a tax year. The overall increase from 2008 to 2009 to 2019 to 2020 is 25.94%.
Table 2.8 Income tax receipts: analysis by type 2008 to 2009 to 2019 to 2020
| £ million | 2008-09 | 2009-10 | 2010-11 | 2011-12 | 2012-13 | 2013-14 | |
|---|---|---|---|---|---|---|---|
| Receipts other than Self Assessment | 136,771 | 128,134 | 137,800 | 137,689 | 138,445 | 141,745 | |
| of which: | PAYE | 128,470 | 122,584 | 132,263 | 132,189 | 132,433 | 134,686 |
| Assessed income tax | 198 | 130 | 80 | 60 | 69 | 87 | |
| Tax deduction scheme for interest (TDSI) | 4,365 | 2,676 | 1,994 | 1,763 | 1,860 | 1,879 | |
| Other tax deducted at source | 1,615 | 1,190 | 1,003 | 1,463 | 1,504 | 1,579 | |
| Other receipts | 2,122 | 1,554 | 2,460 | 2,215 | 2,579 | 3,515 | |
| Self Assessment, net of repayments | 22,531 | 21,708 | 22,108 | 20,334 | 20,550 | 20,854 | |
| Repayments other than Self Assessment | -5,861 | -4,961 | -6,417 | -7,084 | -6,965 | -5,702 | |
| Total net receipts | 153,441 | 144,881 | 153,491 | 150,939 | 152,030 | 156,897 |
| 2014-15 | 2015-16 | 2016-17 | 2017-18 | 2018-19 | 2019-20 | ||
|---|---|---|---|---|---|---|---|
| Receipts other than Self Assessment | 145,036 | 150,985 | 155,216 | 158,664 | 166,596 | 168,781 | |
| of which: | PAYE | 139,506 | 145,652 | 149,751 | 154,266 | 161,909 | 164,841 |
| Assessed income tax | 154 | 145 | 202 | 195 | 207 | 174 | |
| Tax deduction scheme for interest (TDSI) | 1,755 | 1,543 | 648 | 328 | 297 | 243 | |
| Other tax deducted at source | 1,223 | 1,320 | 1,596 | 974 | 970 | 1,086 | |
| Other receipts | 2,399 | 2,325 | 3,018 | 2,901 | 3,213 | 2,437 | |
| Self Assessment, net of repayments | 23,645 | 24,327 | 29,293 | 28,294 | 31,518 | 32,185 | |
| Repayments other than Self Assessment | -5,572 | -6,861 | -7,443 | -6,910 | -7,083 | -7,724 | |
| Total net receipts | 163,109 | 168,451 | 177,065 | 180,048 | 191,031 | 193,242 |
- “Self Assessment, net of repayments” represents the Income Tax element only
- “Repayments other than Self Assessment” includes payments of tax credits
- “Repayments other than Self Assessment” is exclusive of public expenditure
- Totals may not equal the sum of their components because of rounding
Pay As You Earn (PAYE) figures include all receipts of tax collected from employers or pension schemes under PAYE. They include some payments of tax on investment income or in respect of income from previous years coded out under PAYE (these amounts are not separately distinguished). PAYE receipts also include deductions from sub-contractors made under the Construction Industry Scheme (CIS).
Between 2010 to 2011 and 2011 to 2012 net Income Tax receipts fell by 1.7% (or £2.6 billion) largely due to lower Self Assessment receipts. The lag in the Self Assessment payment regime means that receipts in 2010 to 2011 and 2011 to 2012 relate largely to liabilities for 2009 to 2010 and 2010 to 2011 respectively.
The introduction of the 50% additional rate of Income Tax in 2010 to 2011 had a major effect on the behaviour of taxpayers with incomes above the additional rate threshold of £150,000 with large amounts of income forestalling, i.e. income brought forward into 2009 to 2010 from later years in order to be taxed at 40% before the 50% rate came into effect. Self Assessment Income Tax liabilities were therefore inflated in 2009 to 2010 and depressed in 2010 to 2011 as the effects of forestalling started to unwind. This then boosted receipts in 2010 to 2011 and depressed them in 2011 to 2012.
In the 2017 to 2018 tax year (July 2017 onwards), HMRC introduced a new system that uses information from the customer, as well as Real-Time Information provided by employers and pension providers, to review customers’ liabilities more frequently ‘in-year’ to adjust tax codes throughout the year. This ‘In year coding’ will increase the likelihood of a customer ending the year not owing, or being owed tax. For Income Tax receipts, this causes tax to be collected earlier than it might have been previously, and also reduces the likelihood of some repayments.
Self Assessment tax receipts increased from £24.3 billion in 2015 to 2016 to £29.3 billion in 2016 to 2017 (an increase of 20.4%). This large increase is likely driven by changes to dividend taxation rules.
Figures 2 and 3 show some key components of gross Income Tax receipts.
Tax Deducted Scheme for Interest – Figure 2: Until April 2016, banks and building societies deducted tax at a rate of 20% from interest paid on accounts unless the investor was not liable to pay tax and had registered to receive interest gross. They also deducted Income Tax from their annual payments, such as interest on bonds and debentures. They then paid the Income Tax deducted to HMRC. Since April 2016, Banks and building societies have stopped deducting tax from account interest. Some non-interest payments, which are taxable, will still be deducted.
Other Receipts – Figure 3: This covers all tax deducted at source other than under PAYE and TDSI. There are two main types; (1) interest on securities paid by the Bank of England or other paying agents, who pay the tax direct to HMRC (recipients of the interest are credited with the tax deducted), (2) Income Tax payments equivalent to TDSI but made by companies other than banks. Other Receipts also includes receipts from investigation settlements and Income Tax payments which could not be allocated to a particular category.
Figure 2: Tax deduction scheme for interest (TDSI)
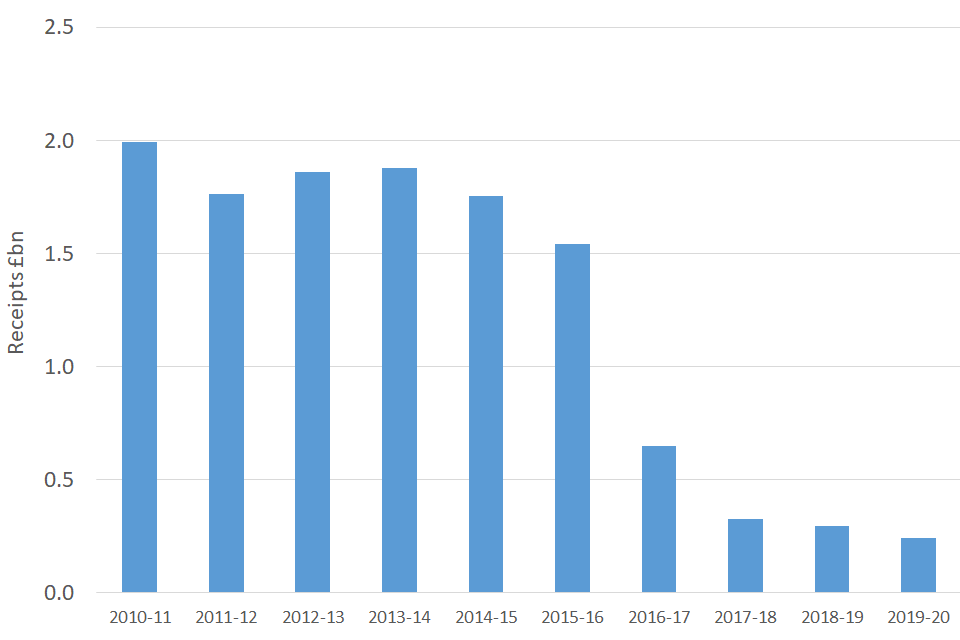
Figure 2: Tax deduction scheme for interest (TDSI)
Figure 3: Other receipts
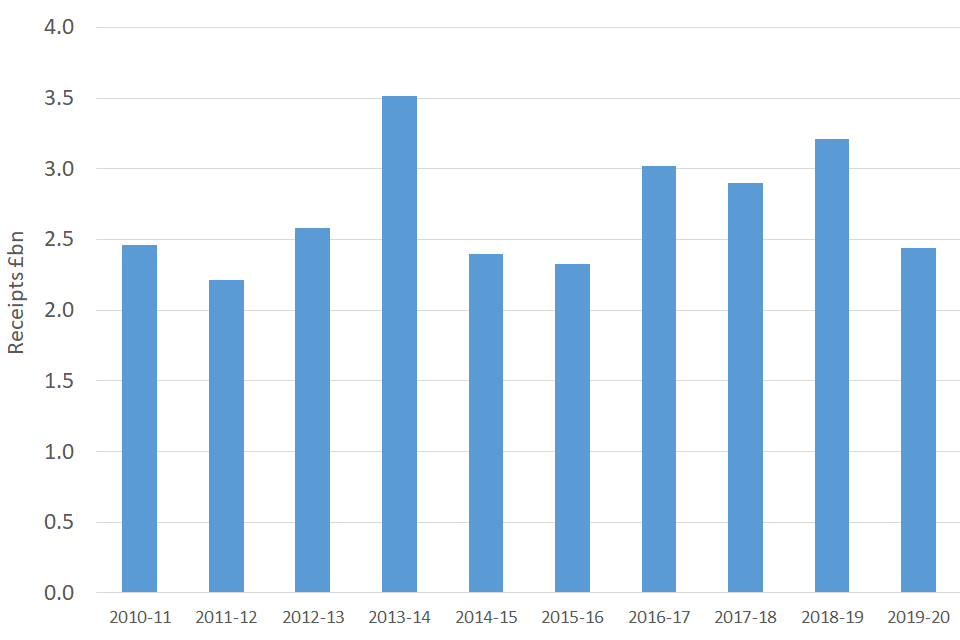
Figure 3: Other receipts
3. Income Tax Credits and Repayments
Table 2.9 provides a breakdown of Income Tax repayments by type.
Table 2.9 Income tax credits and repayments: analysis by type 2008 to 2009 to 2019 to 2020
| £ million | 2008-09 | 2009-10 | 2010-11 | 2011-12 | 2012-13 | 2013-14 | |
|---|---|---|---|---|---|---|---|
| Income tax credits | 17 | 16 | 10 | 8 | 8 | 7 | |
| Repayments | 5,844 | 4,945 | 6,407 | 7,076 | 6,957 | 5,695 | |
| of which: | Individuals | 2,100 | 1,500 | 3,050 | 3,900 | 3,550 | 2,700 |
| Personal pension contributions | 2,206 | 1,877 | 1,679 | 1,615 | 1,805 | 1,506 | |
| Charities | 912 | 922 | 978 | 1,027 | 1,049 | 1,060 | |
| Personal Equity Plans/Individual Savings Accounts | 157 | 152 | 162 | 173 | 169 | 167 | |
| Total tax credits and repayments | 5,861 | 4,961 | 6,417 | 7,084 | 6,965 | 5,702 |
| 2014-15 | 2015-16 | 2016-17 | 2017-18 | 2018-19 | 2019-20 | ||
|---|---|---|---|---|---|---|---|
| Income tax credits | 7 | 2 | 0 | 0 | 0 | 0 | |
| Repayments | 5,565 | 6,859 | 7,443 | 6,910 | 7,083 | 7,724 | |
| of which: | Individuals | 2,400 | 3,250 | 4,100 | 3,100 | 2,784 | 3,019 |
| Personal pension contributions | 1,621 | 1,862 | 1,527 | 1,908 | 2,238 | 2,759 | |
| Charities | 1,190 | 1,260 | 1,270 | 1,260 | 1,319 | 1,378 | |
| Personal Equity Plans/Individual Savings Accounts | 169 | 160 | 160 | 30 | 8 | 8 | |
| Total tax credits and repayments | 5,572 | 6,861 | 7,443 | 6,910 | 7,083 | 7,724 |
- Includes payments of tax credits
- Excludes repayments made via the Self Assessment system
- Exclusive of public expenditure
- Totals may not equal the sum of their components because of rounding
A repayment occurs when a taxpayer has paid too much tax to HMRC. Over payments may happen for a number of reasons, for example when people move in and out of work or receive changes to taxable benefits. Further information about tax repayments and ways of reclaiming overpaid tax is available on the HMRC website.
Repayments increased in 2019 to 2020 from £7.1 billion to £7.7 billion, an increase of £0.64 billion (9.04%).
Figure 4: Repayments, other than Self Assessment
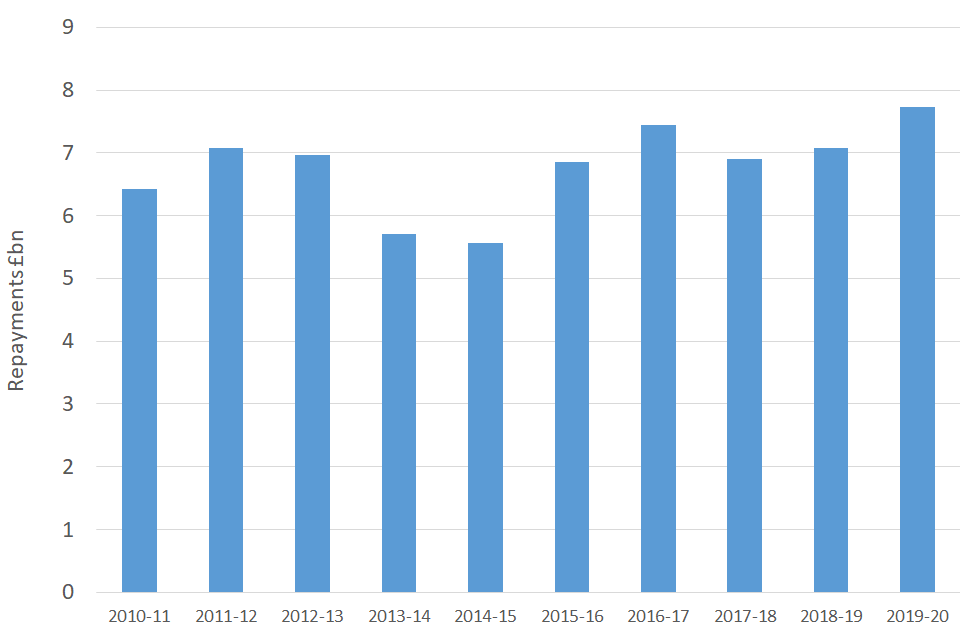
Figure 4: Repayments, other than Self-Assessment
Repayments dipped in 2009 to 2010 due to delays to the PAYE ‘end of year reconciliation’ for 2008 to 2009 linked to the introduction of a new PAYE administrative system (the National Insurance and PAYE Service, or NPS). Repayments then rose sharply in 2010 to 2011 and 2011 to 2012, reflecting the catch up from the initial NPS delays, the further speeding up of the end of year reconciliation process, and the greater accuracy of this process bringing more overpayments to light and therefore generating more repayments. The figures for 2011 to 2012 and 2012 to 2013 also reflect the clearance of a longstanding backlog of cases for tax years before 2007 to 2008.
Repayments have fluctuated over recent years. Growth in repayments due to personal pensions’ contributions has been offset by reductions in repayments to individuals. Generally overall repayments are expected to increase as receipts increase.