Summary Statistics
Published 15 July 2026

© Crown copyright 2026
This publication is licensed under the terms of the Open Government Licence v3.0 except where otherwise stated. To view this licence, visit nationalarchives.gov.uk/doc/open-government-licence/version/3 or write to the Information Policy Team, The National Archives, Kew, London TW9 4DU, or email: psi@nationalarchives.gov.uk.
Where we have identified any third party copyright information you will need to obtain permission from the copyright holders concerned.
This publication is available at https://www.gov.uk/government/statistics/income-tax-liabilities-statistics-tax-year-2023-to-2024-to-tax-year-2026-to-2027/summary-statistics
1. Income Tax payer numbers by type
-
there were 36.7 million Income Tax payers in the UK in the tax year 2023 to 2024, which is projected to increase to 40.8 million in 2026 to 2027
-
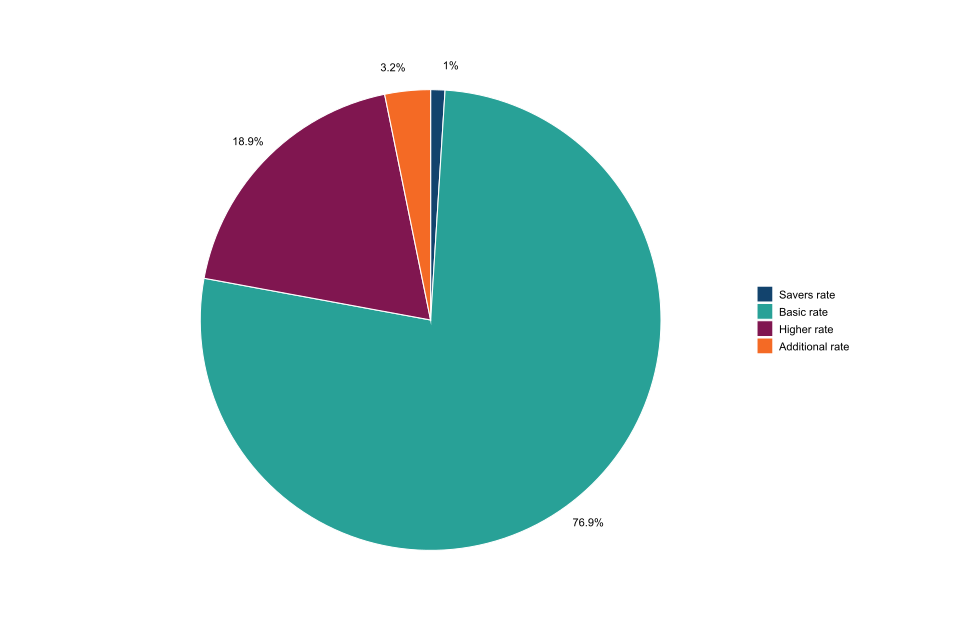
there are a projected 31.8 million basic rate and savers rate Income Tax payers in tax year 2026 to 2027, of which, 415,000 are savers rate Income Tax payers and 31.4 million are basic rate Income Tax payers. There is a 5.9% increase in basic rate Income Tax payers and savers rate Income Tax payers in 2026 to 2027 from 2023 to 2024. Basic rate Income Tax payers make up a projected 76.9%, and savers rate Income Tax payers are projected to be 1.0% of the overall Income Tax paying population in 2026 to 2027
-
there are a projected 7.70 million higher rate Income Tax payers in tax year 2026 to 2027, which is a 33.8% increase compared to 2023 to 2024. Higher rate Income Tax payers make up a projected 18.9% of the overall Income Tax paying population in 2026 to 2027
-
there are a projected 1.29 million additional rate Income Tax payers in tax year 2026 to 2027, which is a 44.4% increase from 2023 to 2024. Additional rate Income Tax payers make up a projected 3.2% of the overall Income Tax paying population in 2026 to 2027
Estimates for 2026 to 2027 are projections based on the 2023 to 2024 Survey of Personal Incomes and the Office for Budget Responsibility’s (OBR) March 2026 Economic and Fiscal Outlook. Basic rate includes savers rate Income Tax payers and both Scottish starter and intermediate rate Income Tax payers.
Figure 1: Income Tax payers by marginal rate between 2023 to 2024 and 2026 to 2027
| Tax year | All | Basic rate | Higher rate | Additional rate |
|---|---|---|---|---|
| 2023 to 2024 | 36,700,000 | 30,100,000 | 5,760,000 | 893,000 |
| 2024 to 2025 | 38,600,000 | 30,900,000 | 6,600,000 | 1,110,000 |
| 2025 to 2026 | 39,800,000 | 31,300,000 | 7,290,000 | 1,220,000 |
| 2026 to 2027 | 40,800,000 | 31,800,000 | 7,700,000 | 1,290,000 |
Figure 2: Percentage shares of Income Tax payers by marginal rate in 2026 to 2027
2. Income Tax payer numbers by UK region
-
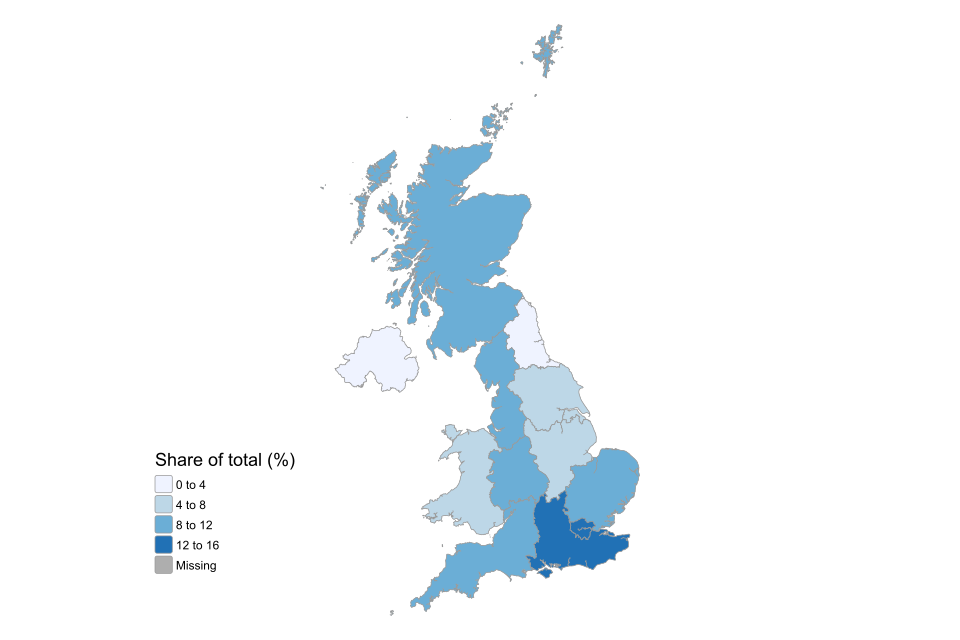
Northern Ireland had the lowest share of Income Tax payers at 2.5% in 2023 to 2024, followed by the North East at 3.7%
-
the South East had the highest share of Income Tax payers at 14.6% in 2023 to 2024, while London had the second highest at 13.2%
Figure 3: Percentage shares of Income Tax payers by country and region in 2023 to 2024
3. Distribution of income and Income Tax liabilities
-
the top 50% of Income Tax payers received 75.1% of total income in 2023 to 2024, or £1.15 trillion out of a total £1.53 trillion. This resulted in a 50.2 percentage point income inequality between the top and bottom 50% of Income Tax payers (where 0 percentage points is completely equal)
-
however, the top 50% of Income Tax payers were liable for 90.1% of total Income Tax in 2023 to 2024, or £247 billion out of a total £274 billion, indicating the progressive nature of the Income Tax system
-
the top 1% of Income Tax payers make up the majority of additional rate Income Tax payers and received 12.4% of total income in 2023 to 2024
-
in addition, the top 1% of Income Tax payers were liable for 27.2% of total Income Tax in 2023 to 2024. This is projected to decrease to a 26.6% share of total Income Tax by 2026 to 2027
Figure 4: Percentage shares of income and Income Tax for the top 50% and top 1% of Income Tax payers
| Tax year | Top 50% share of income | Top 50% share of tax | Top 1% share of income | Top 1% share of tax |
|---|---|---|---|---|
| 2023 to 2024 | 75.1% | 90.1% | 12.4% | 27.2% |
| 2026 to 2027 | 75.6% | 90.0% | 12.8% | 26.6% |
Income Tax payer distributions are based on total income before tax. Projections for the top 1% of Income Tax payers are indicative.
4. Average Income Tax rates
-
basic rate Income Tax payers are projected to have an average tax rate of 10.4% in 2026 to 2027, an increase of 0.4 percentage points compared to 2023 to 2024
-
higher rate Income Tax payers are projected to have an average tax rate of 20.8% in 2026 to 2027, a decrease of 0.2 percentage points compared to 2023 to 2024
-
additional rate Income Tax payers are projected to have an average tax rate of 37.5% in 2026 to 2027, a decrease of 0.2 percentage points compared to 2023 to 2024
Table 1: Average rate of Income Tax by marginal rate
| Tax year | Savers rate Income Tax payers | Basic rate Income Tax payers | Higher rate Income Tax payers | Additional rate Income Tax payers |
|---|---|---|---|---|
| 2023 to 2024 | 4.8% | 10% | 21% | 37.7% |
| 2026 to 2027 | 5.2% | 10.4% | 20.8% | 37.5% |