Income Dynamics: Quick guide
Published 21 March 2024

© Crown copyright 2024
This publication is licensed under the terms of the Open Government Licence v3.0 except where otherwise stated. To view this licence, visit nationalarchives.gov.uk/doc/open-government-licence/version/3 or write to the Information Policy Team, The National Archives, Kew, London TW9 4DU, or email: psi@nationalarchives.gov.uk.
Where we have identified any third party copyright information you will need to obtain permission from the copyright holders concerned.
This publication is available at https://www.gov.uk/government/statistics/income-dynamics-2010-to-2022/income-dynamics-quick-guide
Key things you need to know about Income Dynamics 2010 to 2022.
What is Income Dynamics?
Income Dynamics (ID) uses data from the Understanding Society survey to derive a measure of disposable household income for each individual.
ID presents analysis of income in the following ways:
-
Persistent Low income: statistics on percentages of individuals in low income for at least three of the previous four survey periods
-
Movements within the income distribution: looking at how individuals have moved within the income distribution
-
Movements in and out of relative low income (also called low income entries and exits): including analysis on the role of factors that may be linked to these movements
Information on persistent low income and low income entries and exits is provided for all individuals, children, working-age adults, and pensioners. These measures also include a range of breakdowns so that they can be explored by factors of interest, such as the presence of long-standing illness or disability, ethnicity, country and region, and working status.
How is income measured in ID?
ID produces a measure of income available to each individual based upon the amount of income available to their household.
Household income includes the following components:
- Labour income - usual pay and self-employment earnings, and includes income from second jobs
- Miscellaneous income - educational grants, payment from family members and any other regular payments
- Private benefit income - includes trade union or friendly society payments, maintenance or alimony and sickness or accident insurance, and income from Student Loans or Tuition Fee Loans
- Investment income - private pensioners or annuities, rents received, income from savings and investments
- Pension income - occupational pensions income
- State support - tax credits and all state benefits including State Pension and Universal Credit
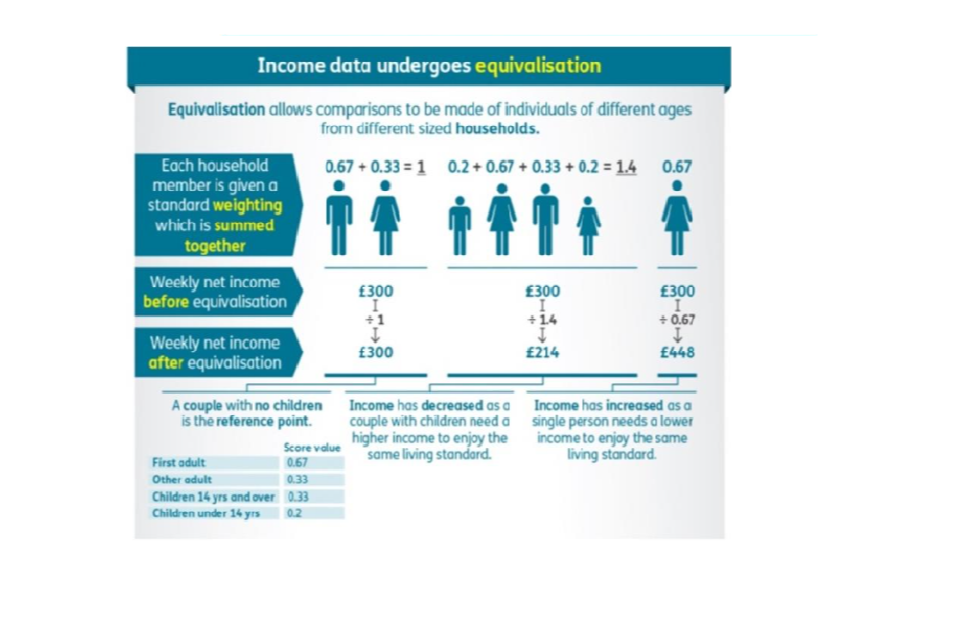
In order to estimate the amount of household income available to an individual in that household, we adjust it according to the size and composition of the household. This adjustment is called equivalisation. Equivalisation aims to make individual incomes comparable. It does this by giving each household member a weighting; this is summed together to provide a household weighting factor. Household weekly net income is divided by that factor to give an equivalised income which is the same for each member of the household. The process of equivalisation results in the income of a single person being adjusted upwards, and that of an individual in a household containing children being adjusted downwards.
Figure 1: the equivalisation process
Once each individual has been assigned an equivalised household income, a median value for this income can be identified. An individual is then determined to be in relative low income if their equivalised household income is less than 60% of the median.
ID statistics are presented both before housing costs (BHC) and after housing costs (AHC)
| BHC Income | AHC income | |
|---|---|---|
| How measured | An income measure that is net of: Income tax, National Insurance, and Council tax | Derived by deducting housing costs (mortgage interest and rent payments) from BHC income. |
| Pros and cons of approach | BHC measures can be useful if interested in net income levels, and comparing these between individuals in different types of household, particularly non-pensioner households (see opposite). | AHC measures can be useful when comparing what is left to live with after housing costs have been paid. AHC measures may be better when looking at pensioner incomes: pensioner income BHC may be lower than that of other individuals, but pensioners may also have lower housing costs. |
About the data
ID uses data from the Understanding Society (USoc) survey. USoc, led by the University of Essex, is a longitudinal survey of individuals in the United Kingdom which has been running since 2009. In 2020 to 2022, the longitudinal sample included over 25,000 individuals.
Who is and isn’t included?
Individuals not living in private households at the start of the survey in 2009 were not included. This means that the original sample excluded people living in institutional forms of accomodation such as nursing or retirement homes. USoc has complex rules about which sample members stay in the survey over time, when household circumstances change - please see the ID Background information and methodology note for more information.
How accurate are our statistics?
Results from surveys are best estimates and not precise figures – in general terms the smaller the sample size, the larger the uncertainty. We are unable to specify how accurate our estimates are, but please note that small differences between groups or changes year on year may not reflect changes in the wider population.
Which ID publication should be used to find statistics on earlier time periods?
Each year we re-run all our analysis (from 2010 and 2011) on the latest USoc data release. Each data release contains revisions made by the USoc team to make the data more accurate, based on updated information about individuals and households in the sample. This means that some statistics that we have previously published are changed in the most recent publication. Because these revisions result from improvements to data quality, it is always best to refer to the most recent ID publication.
In addition, since its first publication, ID has introduced improvements and developments over time, meaning that successive publications have become more comprehensive.
How to use ID
| ID can be used to explore | ID cannot be used for |
|---|---|
| Rates of persistent low income among different population groups, broken down by key demographic and socio-economic characteristics | Saying conclusively that differences between groups and change over time exists in the wider population (ID does not publish information on how much uncertainty surrounds the statistics). |
| How rates of persistent low income have changed over time | Estimating numbers in the general population - ID does not contain grossing factors to enable this. |
| The composition of the sample population in persistent low income, to see if certain groups appear to be over-represented among those in persistent low income | Small area level estimates of income or low income - the sample size is not large enough to provide sub-regional estimates. Please see ONS’ Income estimates for small areas, England and Wales, and DWP’s Children in Low Income Families: Local Area Statistics. |
| Income mobility over time | Single year estimates of low income - use HBAI for these. ID includes single wave estimates of low income in our methodology tables but these are based on two calendar years. |
| Rates of low income entry and exit and how different factors - such as changes in income sources or employment - are related to low income entry and exit | Establishing the causes of persistent low income or of low income entry and exit. ID analysis focuses upon associations between two variables e.g. employment and persistent low income. Other factors may influence that relationship, such as disability or qualifications, or more difficult factors to measure such as local job markets or discrimination. |
More detailed supporting information about ID can be found in our Background information and methodology report, and in our ID Tables Guide, which provides detail on what ID statistics are available, and further guidance on interpretation.
Related information and statistics
The following ONS publications provide useful information and guidance on alternative sources of data on earnings and income:
- a guide to sources of data on income and earnings
- explaining income and earnings: important questions answered
- income and earnings interactive tool
Income Dynamics is Official Statistics. Official Statistics are produced in accordance with the Statistics and Registration Service Act 2007 and the Code of Practice for Statistics.
Details of National and Official Statistics produced by the Department for Work and Pensions can be found via the following links:
Information about planned developments for DWP’s official statistics can be found in the DWP Statistical Work Programme.