Income Dynamics: income movements and the persistence of low income, 2010 to 2020
Published 31 March 2022

© Crown copyright 2022
This publication is licensed under the terms of the Open Government Licence v3.0 except where otherwise stated. To view this licence, visit nationalarchives.gov.uk/doc/open-government-licence/version/3 or write to the Information Policy Team, The National Archives, Kew, London TW9 4DU, or email: psi@nationalarchives.gov.uk.
Where we have identified any third party copyright information you will need to obtain permission from the copyright holders concerned.
This publication is available at https://www.gov.uk/government/statistics/income-dynamics-2010-to-2020/income-dynamics-income-movements-and-the-persistence-of-low-income-2010-to-2020
Income Dynamics (ID) presents information on changes in income over time. It presents findings on rates of persistent low income for different groups. Individuals are in persistent low income if they are in relative low income for at least three out of four consecutive annual interviews. Statistics on low income entry and exit are also included, as well as analysis on how these entries and exits are linked to changes in income, employment, and demographics. ID also looks at movements within the overall income distribution over time.
1. Main stories
The main stories are:
- between 2016 to 2017 and 2019 to 2020, 9% of all individuals were in persistent low income before housing costs (BHC), and 12% after housing costs (AHC). These rates tend to be stable: the BHC rate has been 9% since the first four-wave period reported on (from 2010 and 2011), and the AHC rate has been 13% in all previous four-wave periods
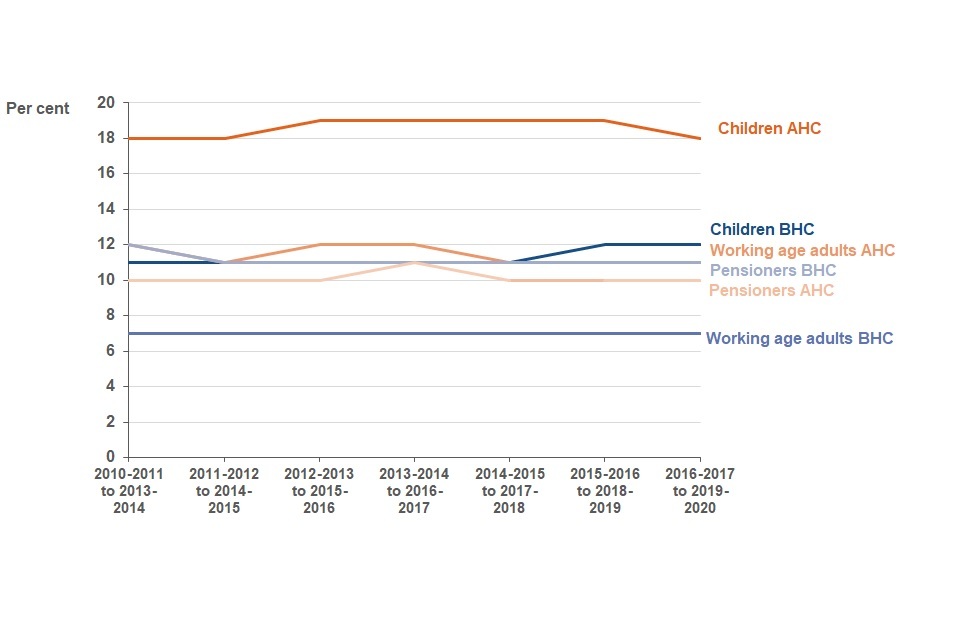
- the highest rate of persistent low income was for children AHC (18%), which was notably higher than the AHC rate for working-age adults (11%) and pensioners (10%). Children and pensioners had higher rates of persistent low income BHC than working-age adults. Rates of persistent low income for children, working-age adults, and pensioners have changed little over time
- between 2018 to 2019 and 2019 to 2020, roughly equivalent numbers of individuals moved into low income as moved out of low income. Rates of low income entry and exit for all individuals have been relatively stable over time
- a closer look at rates of low income entry and exit for different groups illustrates the overlap between risk factors associated with low income entry and those for being in persistent low income. For example, renters were more likely to enter low income than people living in other tenures, as were working-age adults with lower levels of qualification compared to those with higher qualifications
- changes in income from earnings and benefits were closely linked to low income entry and exit, as were changes in the number of people working within a household
2. What you need to know
This is the sixth annual statistics publication on Income Dynamics (ID). It provides data on changes in household incomes in the UK, including information on individuals in persistent low income. This publication meets DWP’s statutory obligation to publish a measure of persistent low income for children under Section 4 of the Welfare Reform and Work Act 2016. Findings on persistent low income among pensioners and working-age adults are also presented. Persistent low income rates are lower than the single year rates published by Households Below Average Income (HBAI). This is because fewer people remain in low income for three years out of four than experience low income in any single year.
ID also includes analysis of movements across the income distribution, including low income entry and exit rates, and statistics on how various socio-economic factors are linked to low income entry and exit.
Please refer to our new ID Quick Guide for key information on this publication.
Income measures
ID uses a disposable household income measure, adjusted for household size and composition, as a proxy for living standards. Statistics are routinely reported both before and after housing costs. A household is said to be in relative low income if their equivalised income is below 60% of median income. The income measures used in ID are subject to several statistical adjustments in line with international best practice. This means they may not always be directly relatable to the amounts understood by individuals on a day-to-day basis. These adjustments are necessary however, to allow us to make comparisons over time and across household compositions on a consistent basis.
Survey data
ID estimates are based on Understanding Society, a longitudinal survey run by the University of Essex, which follows sampled individuals over time. It has a two-year survey period (“wave”) based upon calendar years, with individuals interviewed once a year.
In 2019 to 2020, the Wave 11 longitudinal sample included over 27,000 individuals. For the purposes of the longitudinal analysis presented here, individuals are classified according to characteristics reported at the first wave of any analytical period. For example, where analysis covers the period between 2016 to 2017 and 2019 to 2020, working-age adults are adults who were below State Pension age (SPa) and over 16, not in further education and not classed as a dependent child, when they were interviewed for the 2016 to 2017 wave.
Use of survey data means that estimates in this report are subject to a margin of error. Care should therefore be taken in interpreting apparent change over time, which may reflect sampling error rather than real change from one year to the next. This holds particularly true over the short term and where percentage point differences are small. Percentages are rounded to the nearest percentage point independently, and as a result may not sum to 100.
The coronavirus (COVID-19) Pandemic: what it means for ID
The coronavirus pandemic and subsequent policy announcements resulted in several changes to Understanding Society (USoc) Wave 11 fieldwork, data collection, and processing. These are detailed in the Background information and methodology report. Key points to note are:
- Wave 11 fieldwork was conducted from January 2019 to December 2020. The first UK-wide lockdown began in March 2020
- USoc moved to a web-first approach, with telephone interviews used as follow-up. While response rates held up well overall, the shift in mode was associated with lower response rates for some groups. Weights have been adjusted accordingly
- changes were made to the USoc questionnaire at the end of July 2020 to capture the support available to employees and the self-employed via the Coronavirus Job Retention Scheme (CJRS or ‘furlough’), and the Self-Employment Income Support Scheme (SEISS) respectively
- while we have not observed any obvious changes in rates of persistent low income, or in rates of low income entry and exit, we have noted some small changes to the most recent statistics on some of the events associated with low income entry and exit. These are discussed in the relevant section below
- it is important to note that for various reasons, not least fieldwork timings and gaps in data mentioned above, that attributing any observed changes to the pandemic is beyond the scope of these statistics
Data tables
Data tables have been published alongside this release. Relevant table references are provided within the text. Please also refer to the new ID Tables Guide for details of the statistics included in the various ID tables files.
Further information
For further information on the way in which ID statistics are produced, please refer to Section 11 below, the ID Quick Guide, and the Background information and methodology report published with this 2010 to 2020 release.
3. An overview of persistent low income
Between 2016 to 2017 and 2019 to 2020 the rate of persistent low income for all individuals was 9% before housing costs (BHC) and 12% after housing costs (AHC). These rates have been relatively stable over time. The AHC rate has been 13% in all previous four-wave periods: it is too soon to tell if this reduction to 12% is part of a longer-term trend
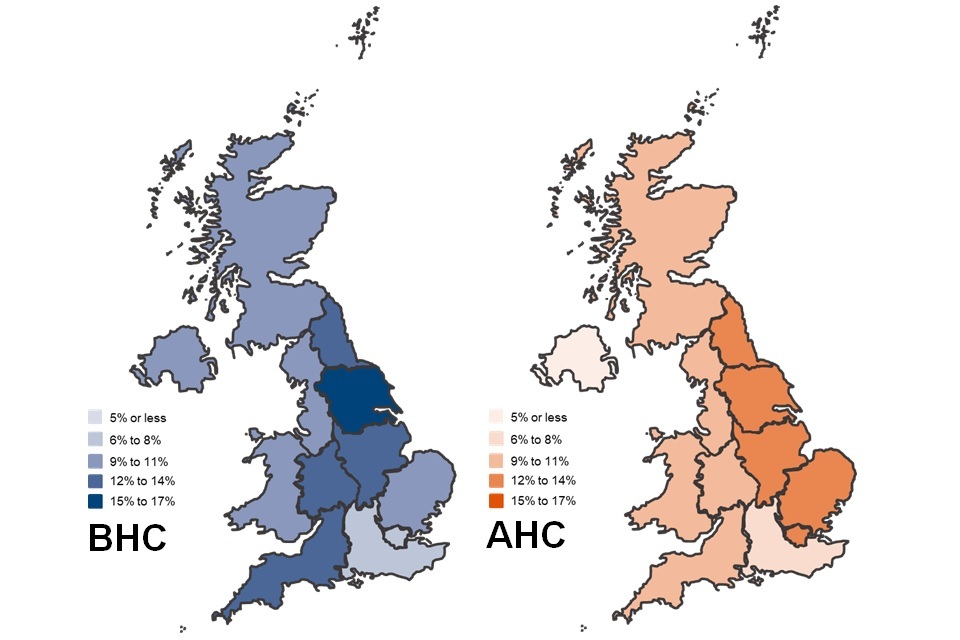
Rates of persistent low income varied across the regions and countries of the UK
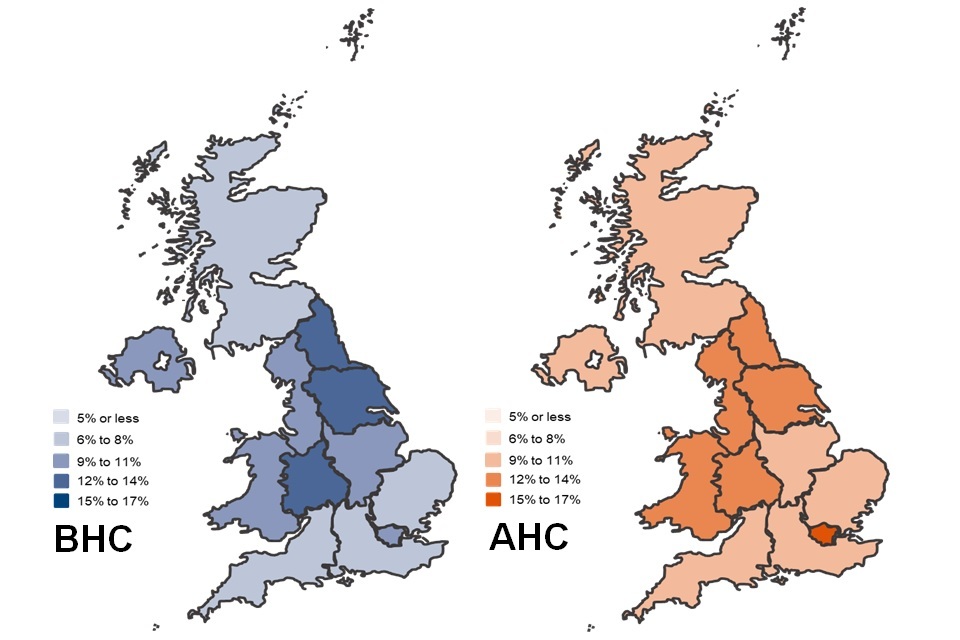
The rate of persistent low income BHC varied only slightly across the four countries of the United Kingdom, from 7% in Scotland to 9% in each of England, Northern Ireland, and Wales. Within England the highest rates of persistent low income were in Yorkshire and the Humber, the North East, and the West Midlands (all 12%). The lowest rates of persistent low income were in the East and South East (both 7%). Over time, there has been a broad difference between the higher rates of persistent low income BHC observed in regions in the north of England and the West Midlands, and lower rates seen in the south and east of England.
When looking at persistent low income after housing costs (AHC), England and Wales (both 12%) had slightly higher rates than Northern Ireland (9%) and Scotland (10%). Within England, there were similarities to the BHC pattern, with higher rates in Yorkshire and the Humber, the North East and West Midlands (all 14%), although London stood out as having the highest AHC rate at 17%, reflecting the higher housing costs experienced by those living in London. The South East had the lowest rate of persistent low income AHC (9%). This broad variation in rates across England has been present since the first four-wave period from 2010 and 2011 to 2013 and 2014.
See Tables 2.2p and 2.8p in the Individuals in persistent low income file for more information.
Families headed by couples tended to have a lower rates of persistent low income than those headed by single adults
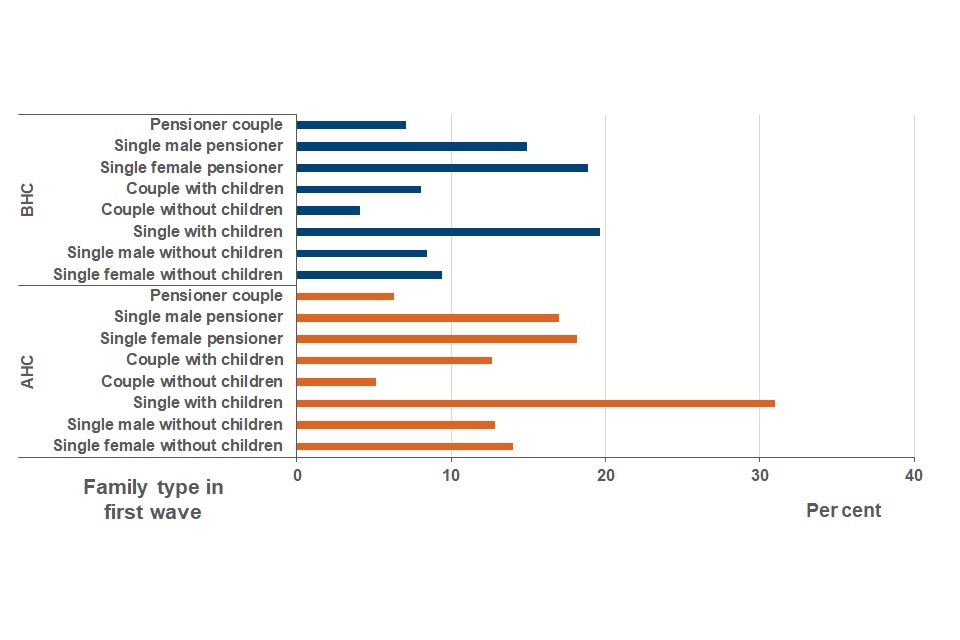
Couples without children had the lowest rates of persistent low income BHC (4%). Couples with children and pensioner couples also had relatively low rates of persistent low income BHC (8% and 7% respectively). While single, working-age adults had similar rates of persistent low income to families headed by couples (8% for single males and 9% for single females), considerably higher rates were seen among single parents (20%) and single pensioners (19% for female pensioners and 15% for male pensioners).
When looking at rates of persistent low income AHC, pensioner couples and couples without children again had relatively low rates of persistent low income, at 6% and 5% respectively. However, the AHC income distribution results in notably higher rates of persistent low income for families with children compared to their BHC rates: 13% for couples with children, and 31% for single adults with children. 53% of individuals living in persistent low income AHC were living in families with children.
See Tables 2.1p, 2.7p, and 2.7c in the individuals in persistent low income file. Please see the new ID Tables Guide for information about composition measures and how these can be used to support interpretation of ID findings.
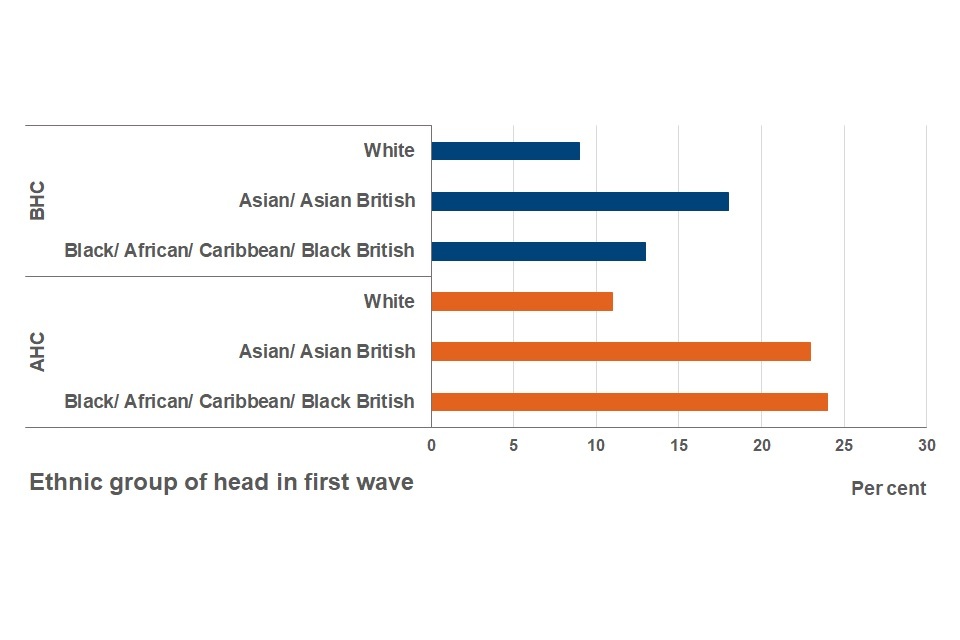
Individuals with a White head of household had lower rates of persistent low income than individuals from other ethnic groups
The sample sizes of individuals with a head of household of Mixed ethnicity or from an Other ethnic group are relatively small. This means that statistics based on these sub-groups can fluctuate. They are included in the Individuals in persistent low income tables file, but not here.
Individuals with a White head of household had lower rates of persistent low income BHC (9%) than those with an Asian/Asian British head of household, who had the highest rates of persistent low income (18%), followed by those with Black/African/Caribbean/Black British heads of household (13%).
The rate of persistent low income AHC for individuals with a Black/African/Caribbean/Black British head of household was 24%, considerably higher than their BHC rate, indicating that housing costs are more significant in terms of their effect on income for these individuals. Those with an Asian/Asian British head of household had similarly high levels of persistent low income AHC (23%), while individuals with a White head of household had the lowest AHC persistent low income rate (11%).
People with an Asian/Asian British or Black/African/Caribbean/Black British head of household have consistently experienced higher rates of persistent low income than individuals with a White head of household, both BHC and AHC. The rate of persistent low income (both BHC and AHC) among people with a Black/African/Caribbean/Black British head of household has seen an overall decrease since the first four-wave period from 2010 and 2011 to 2013 and 2014.
See Tables 2.1p, 2.7p, 2.13p, 2.1c and 2.7c in the Individuals in persistent low income file for more information.
Renters were more likely to be in persistent low income than non-renters
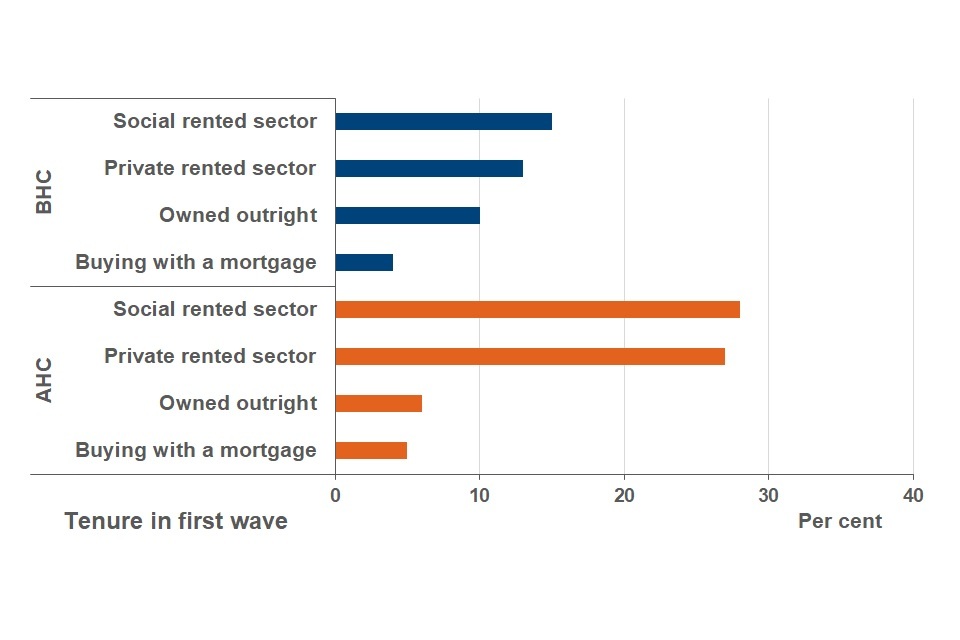
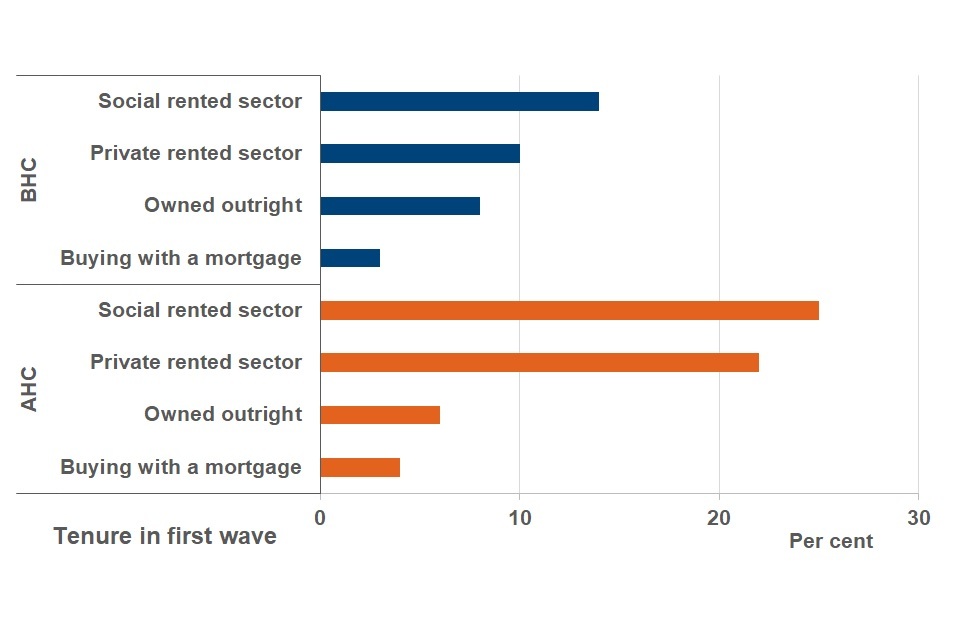
Higher rates of persistent low income BHC were seen among individuals living in the private and social rented sectors (13% and 15% respectively) compared to those who owned their homes outright (10%) and those who were buying their homes with a mortgage (4%).
After housing costs were taken into account, individuals who were renting were much more likely to be in persistent low income (AHC rates were 28% and 27% for social and private sector renters respectively). Renters were over-represented among those in persistent low income: while they comprised just under a third (31%) of the sample population, they accounted for almost a half (49%) of those in persistent low income BHC, and 70% of those in persistent low income AHC.
See Tables 2.2p, 2.8p, 2.2c, 2.8c and 2.14c in the Individuals in persistent low income file for more information.
4. Children in persistent low income
Between 2016 to 2017 and 2019 to 2020, 12% of children were living in persistent low income before housing costs (BHC) and 18% after housing costs (AHC). These figures have remained relatively stable over time.
Rates of AHC persistent low income among children were higher than BHC rates across every country and region of the UK
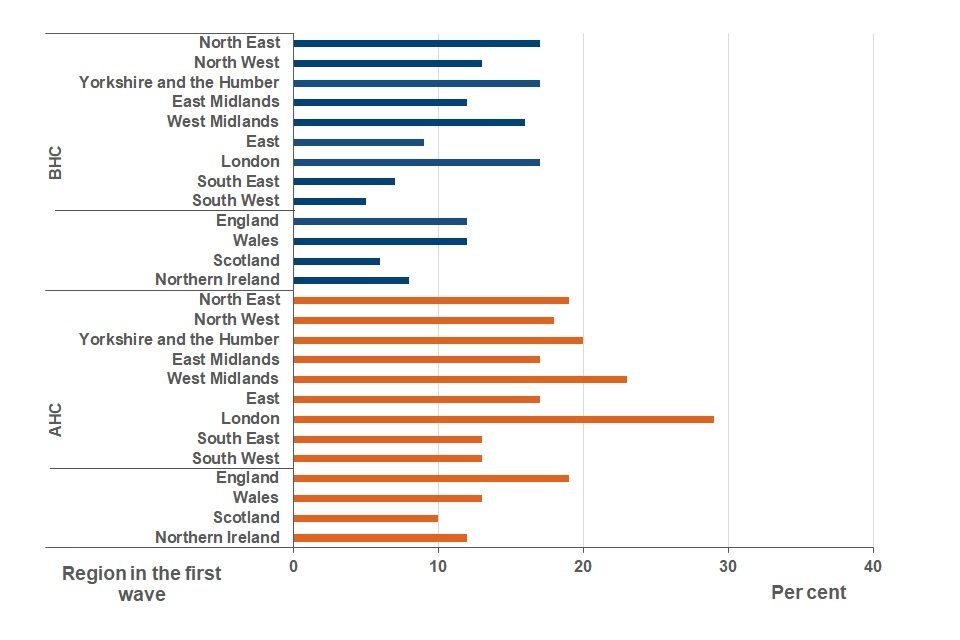
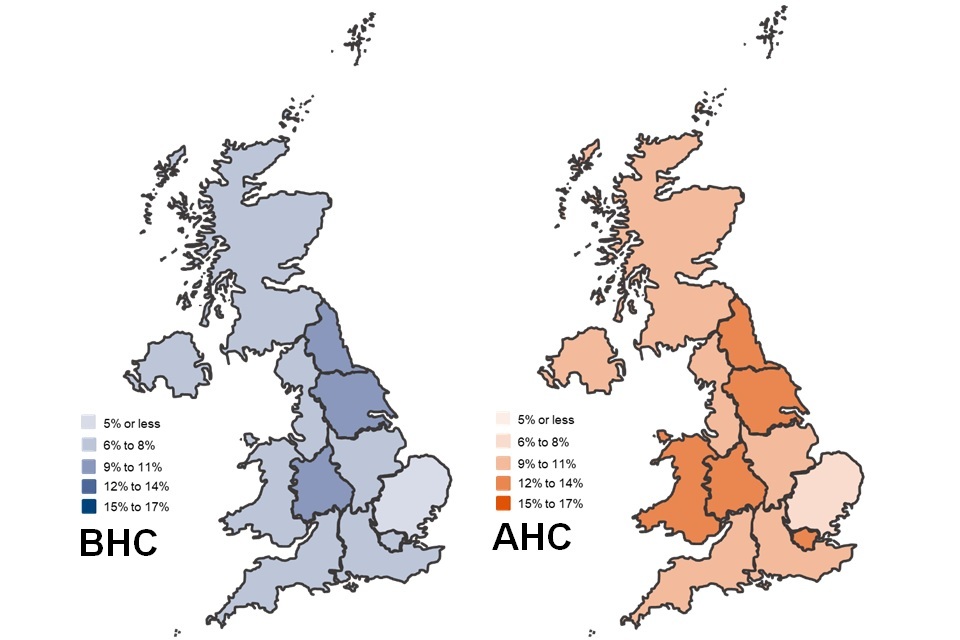
Across the countries of the UK, England and Wales (both 12%) had higher rates of persistent low income BHC than Northern Ireland (8%) and Scotland (6%). AHC rates were higher for all four countries. England had the highest rate of AHC persistent low income (19%), followed by Wales (13%), Northern Ireland (12%) and Scotland (10%).
Within England, the South West (5%) and South East (7%) stood out as having lower rates of persistent low income BHC, compared to much higher rates in London, the North East, Yorkshire and the Humber (all 17%), and the West Midlands (16%). Housing costs have a particularly negative effect on rates of persistent low income for children, and for all regions, rates of persistent low income AHC were higher than their BHC rates. The difference was most marked in London, where AHC rates of persistent low income were the highest, at 29%. AHC rates were also relatively high in the West Midlands, where 23% of children were living in persistent low income
See Tables 3.2p and 3.8p in the Children in persistent low income file for more information.
Children who lived in workless families had higher rates of persistent low income
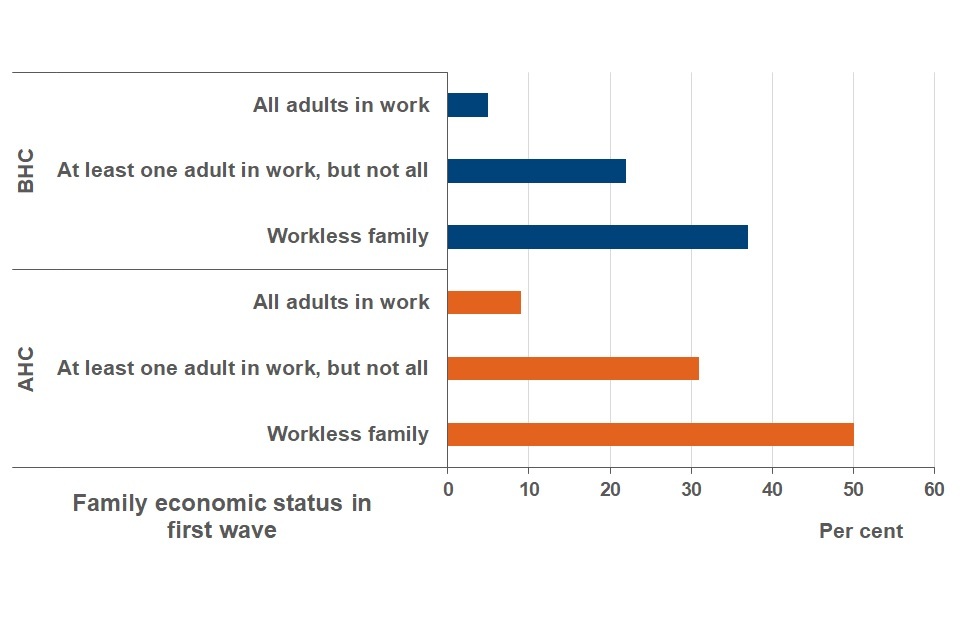
Rates of persistent low income among children were clearly affected by whether adults in the family were working or not: children who lived in workless families were much more likely to be in persistent low income both BHC and AHC (37% and 50% respectively) compared to those where all adults were in work (5% BHC and 9% AHC).
Children who lived in families where at least one adult was in work but not all were less likely to be in persistent low income than those in workless families, but more likely than those where all adults were in work. Since the four-wave period starting in 2010 and 2011, the likelihood of being in persistent low income has increased for children living in these families: from 14% to 22% BHC, and from 24% to 31% AHC. Rates of persistent low income for children in workless families and families where all adults were working have been more stable.
See Tables 3.1p and 3.7p in the Children in persistent low income file for more information.
Children in rented accomodation were more likely to be in persistent low income
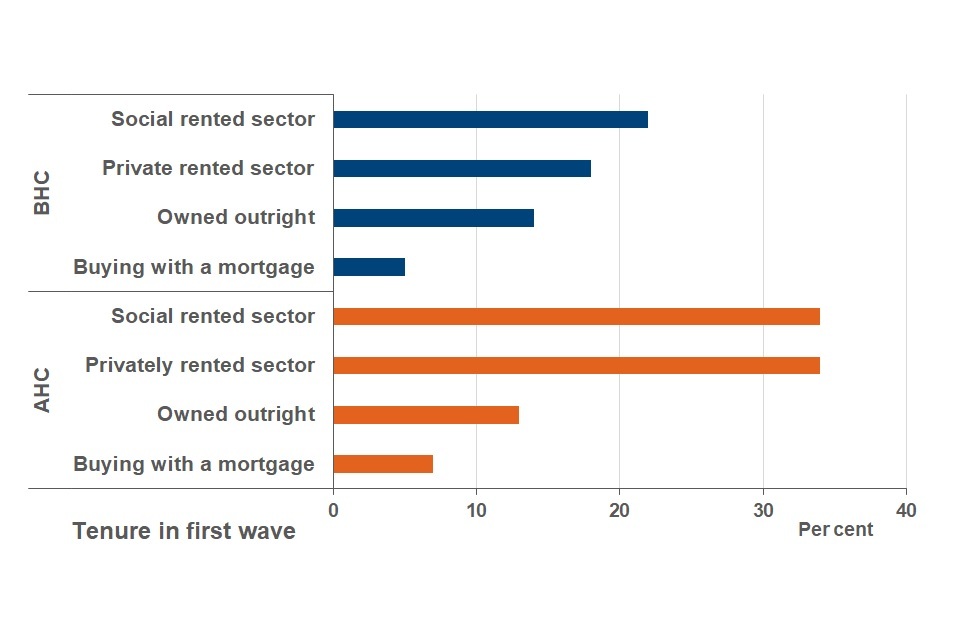
Both before and after housing costs, children living in rented homes were more likely to be in persistent low income than children whose households owned their homes outright or had a mortgage on their home. 22% of children living in the social rented sector, and 18% of children living in privately rented homes were in persistent low income BHC. After housing costs were taken into account, these rates both rose to 34%, meaning around a third of children in rented homes were living in persistent low income AHC. Almost three-quarters (74%) of children in persistent low income AHC were living in rented homes, even though they made up 38% of children in the four-wave sample.
See Tables 3.2p, 3.8p, 3.8c and 3.14c in the Children in persistent low income file for more information.
Rates of persistent low income in children were lower in families headed by couples
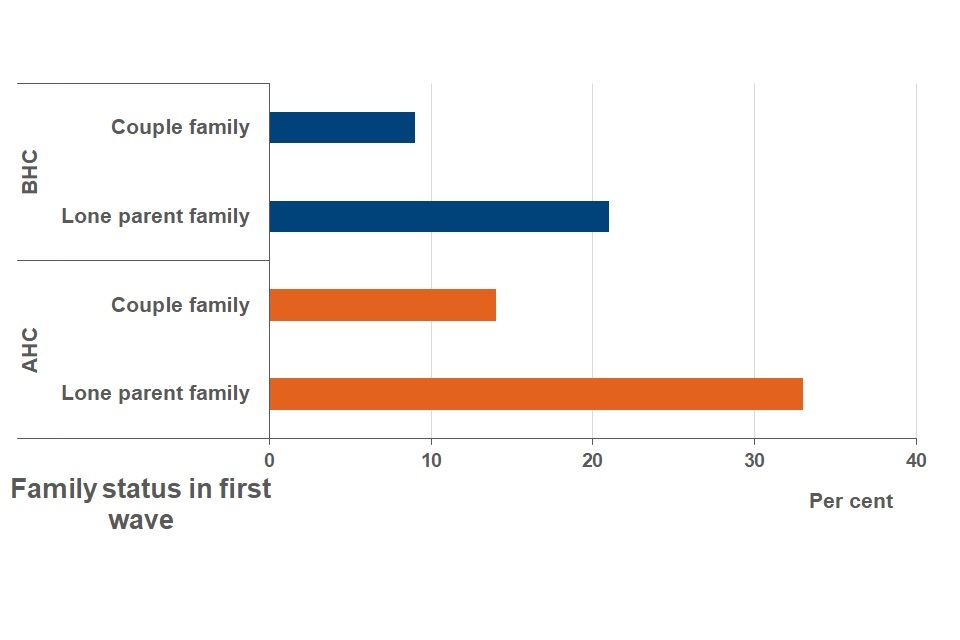
Children living in a family headed by a couple had much lower rates of persistent low income than those living in a lone parent family, both BHC, where 9% of children living in a couple family were in persistent low income compared to 21% of children in lone parent families; and AHC, where rates of persistent low income were 14% and 33% respectively. Although 82% of children in the sample were living in families headed by a couple, they accounted for around two-thirds of children in persistent low income, both BHC and AHC. This reflects their lower risk of being in persistent low income compared to those children living in lone parent families.
See Tables 3.1p, 3.7p, 3.1c, 3.7c and 3.13c in the Children in persistent low income file for more information.
Children in families with more children were more likely to be in persistent low income than those in families with fewer children
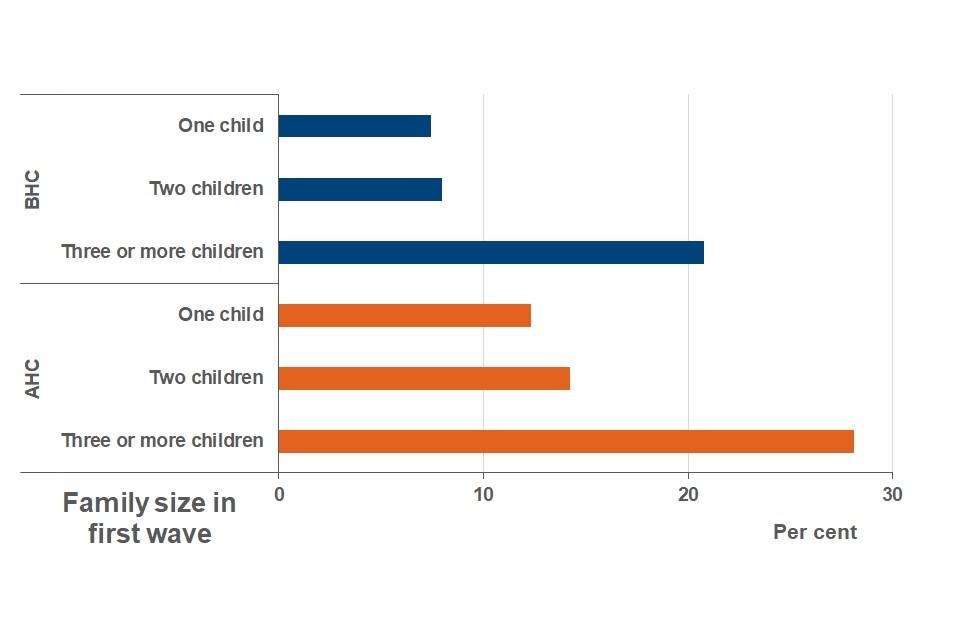
Children in families with one or two children had similar rates of persistent low income, both BHC (7% and 8% respectively), and AHC (12% and 14% respectively). Children in families with three or more children were much more likely to be living in persistent low income (21% BHC and 28% AHC).
See Tables 3.1p and 3.7p in the Children in persistent low income file for more information.
5. Working-age adults in persistent low income
Between the period 2016 to 2017 and 2019 to 2020, the rate of persistent low income for working-age adults was 7% before housing costs (BHC) and 11% after housing costs (AHC). This rate has been relatively stable over time.
Rates of persistent low income among working-age adults varied relatively little by country of the UK, but more by region
The rate of persistent low income BHC for working-age adults was similar for the four countries of the UK: 7% in both England and Scotland, and 8% in both Northern Ireland and Wales. Within the English regions, Yorkshire and the Humber (10%), the North East (10%), and the West Midlands (9%) had the highest rates of persistent low income. Lower rates of persistent low income BHC were seen in the East (5%), and in London and the South East (both 6%). This broad regional pattern has been seen for some time.
Across the four countries of the UK, rates of AHC persistent low income for working-age adults were also relatively similar, ranging from 10% in both Northern Ireland and Scotland, 11% in England, and 13% in Wales. Within England, the regional pattern of persistent low income AHC for working-age adults was similar to the BHC pattern, with the exception of London, where taking housing costs into account resulted in the highest rate of persistent low income alongside Yorkshire and the Humber (both 13%). The East and the East Midlands had the lowest rates (8% and 9% respectively).
See Tables 4.2p and 4.8p in the working-age adults in persistent low income file for more information.
Working-age adults in workless families were more likely to be in persistent low income than those in families where someone was in work
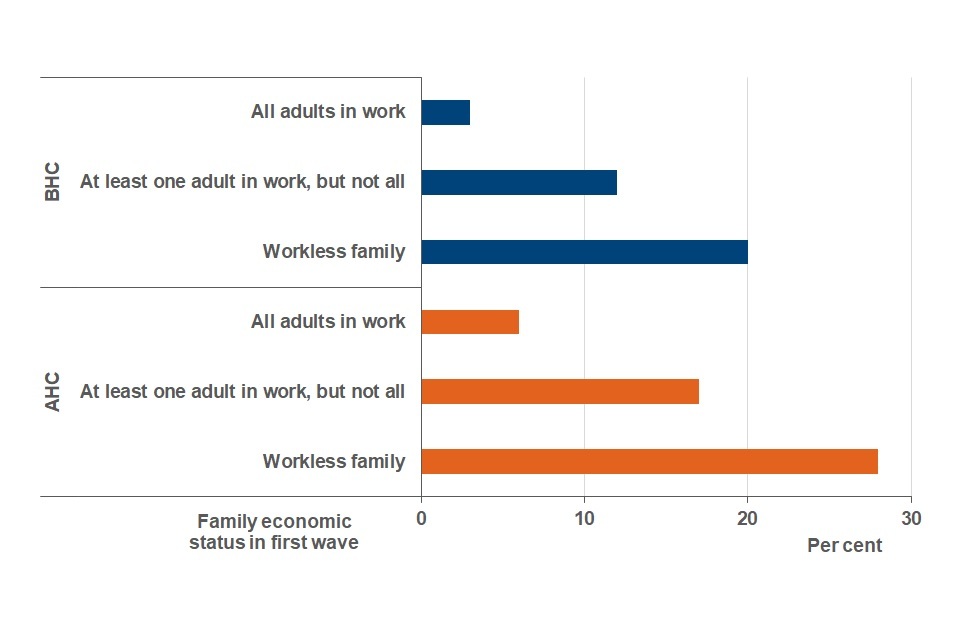
70% of working-age adults in the sample were living in families where all adults were in work. Rates of persistent low income for these adults were low (3% BHC and 6% AHC). In contrast, working-age adults in workless families had much higher rates of persistent low income both BHC and AHC (20% and 28% respectively) compared to working-age adults in families where at least one adult was in work but not all (12% BHC and 17% AHC).
Rates of persistent low income among working-age adults where all adults are in work have remained relatively stable over time. There have been small increases in the rate of persistent low income BHC for working-age adults where one adult is in work but not all since 2010 to 2011 (the AHC picture is less clear-cut). Simultaneously, there has been a steady decrease in the percentage of working-age adults in workless families who were in persistent low income over the same period, both BHC and AHC.
See Tables 4.1p, 4.7p and 4.13c in the working-age adults in persistent low income file for more information.
Working-age adults who rented their homes had higher rates of persistent low income, particularly AHC
Working-age adults who were buying their homes with a mortgage had the lowest rate of persistent low income BHC (3%). Those who owned their homes outright had higher rates of persistent low income (8%), and those who rented had the highest rates, particularly those living in the social rented sector (14%), while 10% of private renters were in persistent low income.
Taking housing costs into account resulted in large increases in the rate of persistent low income for both social and private sector renters. A quarter (25%) of working-age adults in the social rented sector were in persistent low income, and 22% of those in the private rented sector. Rates of persistent low income for working-age adults who owned their homes outright or who were buying with a mortgage were barely affected by housing costs (6% and 4% respectively). Although 32% of working-age adults in our sample population rented in the private or social sector, they were over-represented among working-age adults in persistent low income, accounting for 55% of working-age adults in persistent low income BHC, and 71% AHC.
See Tables 4.2p, 4.8p, 4.2c, 4.8c and 4.14c in the working-age adults in persistent low income file for more information.
Rates of persistent low income were higher for working-age adults with lower levels of educational qualifications, BHC and AHC
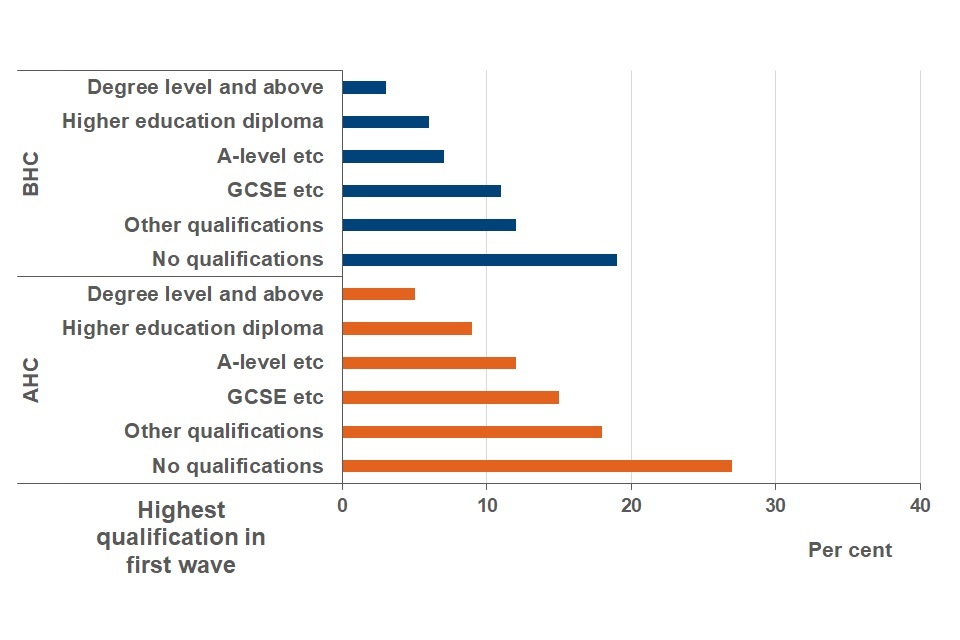
Rates of persistent low income increased as level of educational qualification decreased. Working-age adults with no qualifications had the highest rates: 19% BHC and 27% AHC, although it is worth pointing out that those with no qualifications only accounted for 5% of the sample population. Working-age adults with degree level qualifications (31% of the sample population) had the lowest rate of persistent low income: 3% BHC and 5% AHC. This pattern is likely to reflect the fact that working-age adults with higher levels of educational qualifications have access to a wider range of employment opportunities with higher pay than those with lower levels of qualifications, although there may be other contributing factors. These rates of persistent low income have changed little over time.
See Tables 4.2p, 4.8p, 4.2c, 4.8c and 4.14c in the working-age adults in persistent low income file for more information.
6. Pensioners in persistent low income
Between the period 2016 to 2017 and 2019 to 2020, the rate of persistent low income for pensioners was 11% before housing costs (BHC) and 10% after housing costs (AHC). Both rates have varied little over time. Unlike children and working-age adults, rates of BHC and AHC persistent low income were roughly the same for pensioners. This reflects the fact that most pensioners own their homes outright (73% of the sample population).
Persistent low income for pensioners varied by region, both BHC and AHC
Rates of persistent low income BHC were roughly the same across the four countries of the UK: 11% in England, Northern Ireland and Wales, and 10% in Scotland. Rates of persistent low income AHC were similar to BHC rates for all countries except Northern Ireland, where the rate of persistent low income for pensioners was 5%. Northern Ireland has consistently had relatively low rates of AHC persistent low income for pensioners.
Within England, pensioners in Yorkshire and the Humber and the East Midlands had the highest rates of BHC persistent low income: 15% and 14% respectively. BHC rates were lowest in London and the South East (7% and 8% respectively). Rates of persistent low income AHC were highest in the North East (14%), London (13%), and Yorkshire and the Humber (13%), illustrating that housing costs play a particularly important role in persistent low income rates for pensioners in London given the low BHC rates.
See Tables 5.2p, 5.8p and 5.14c in the Pensioners in persistent low income file for more information.
Rates of persistent low income among pensioners varied more by tenure AHC than BHC
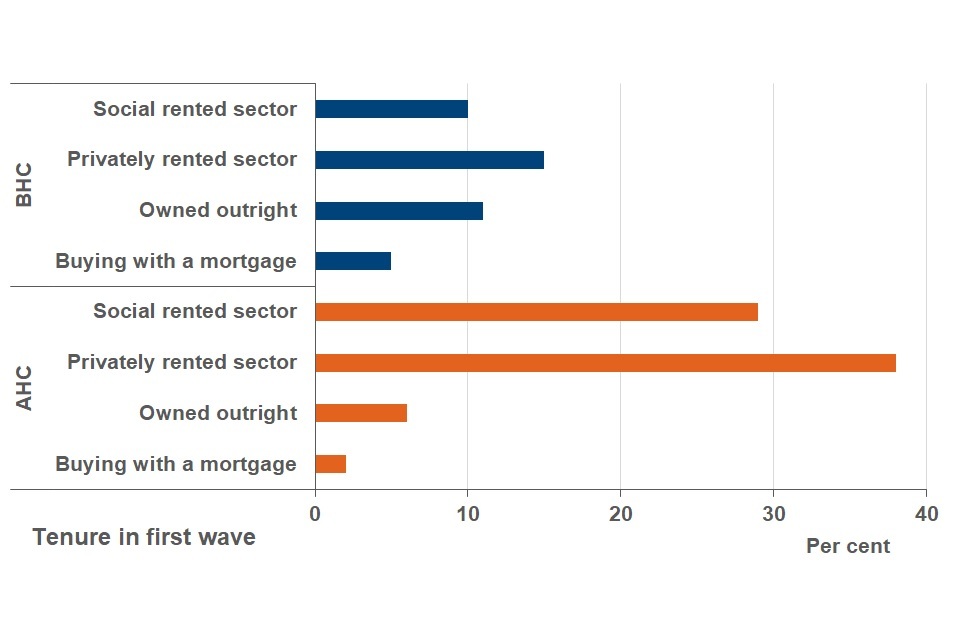
Pensioners who were buying their homes with a mortgage had the lowest rates of persistent low income BHC of all tenures (5%). Pensioners who owned their homes outright or who were living in the social rented sector had higher rates of BHC persistent low income (11% and 10% respectively), while those in the private rented sector had the highest rates of persistent low income (15%).
Taking housing costs into account resulted in much higher rates of persistent low income for renters, particularly those in the private rented sector, 38% of whom were in persistent low income. Of those pensioners living in the social rented sector, 29% were in persistent low income, while pensioners buying their homes with a mortgage or who owned their homes outright had much lower AHC rates (2% and 6% respectively). Pensioners who were renting their homes accounted for 59% of all pensioners in persistent low income AHC, although they represented just 20% of the ID sample population.
See Tables 5.2p, 5.8p, 5.8c and 5.14c in the Pensioners in persistent low income file for more information.
7. Long-standing illness or disability and persistent low income
The way in which information on long-standing illness or disability is gathered by USoc changed between Waves 7 and 8. Prior to Wave 8, only those who reported having a long-standing illness or disability were asked if that condition was limiting or not. In the Wave 8 questionnaire (2016 to 2017), which is the wave used as the basis for the figures discussed here, limiting health problems or disabilities did not necessarily have to be linked to long-standing illness or disability. The way in which we describe the findings in this section has been revised to reflect these changes. Please refer to the Background information and methodology document for more detail.
Overall, pensioners were more likely than working-age adults to report having a long-standing illness or disability (55% compared to 31%).
Working-age adults who reported a limiting health problem or disability alongside long-standing illness or disability had higher rates of persistent low income than those without a limiting health problem or disability. This pattern was not observed among pensioners
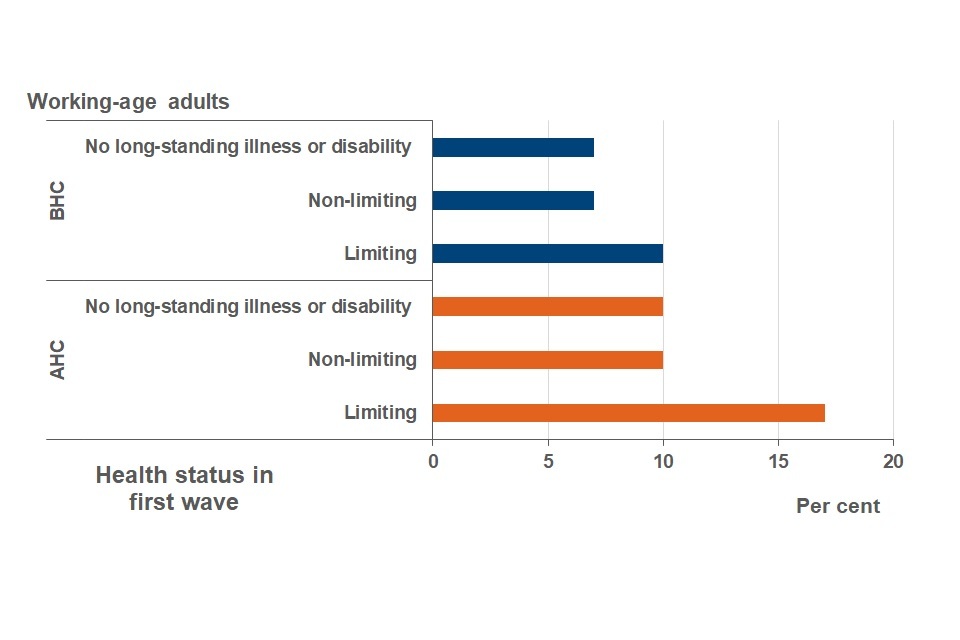
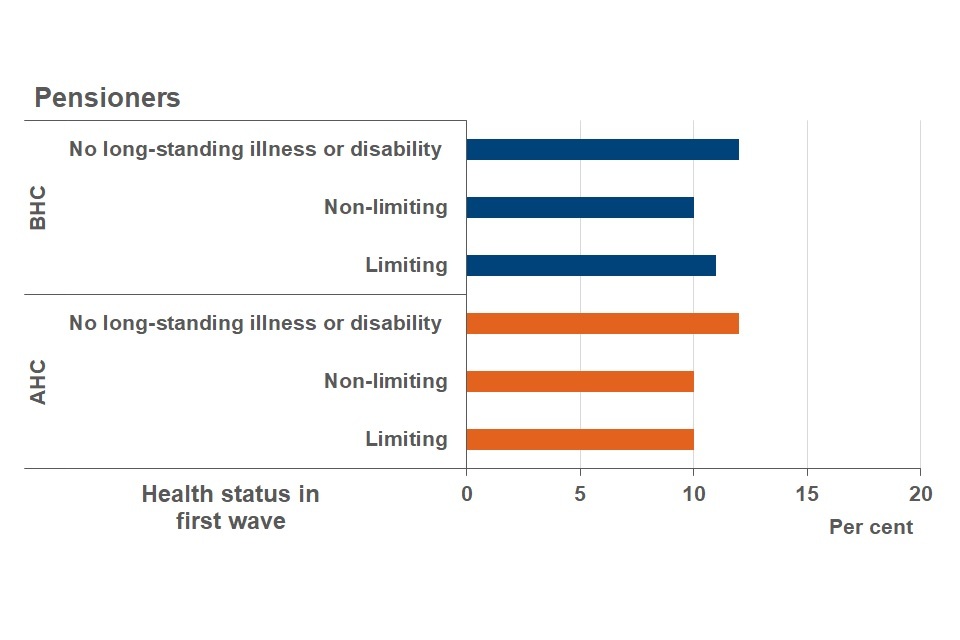
Rates of persistent low income BHC for pensioners with a long-standing illness or disability were almost the same whether they reported a limiting or non-limiting health problem or disability (11% and 10% respectively). For working-age adults with a long-standing illness or disability, the rate of persistent low income BHC for those with a limiting health problem or disability was 10%, compared to 7% for those who did not report one.
The presence of a limiting health problem or disability was associated with notably higher rates of persistent low income AHC for working-age adults (17%), compared to 10% of those who reported a long-standing illness or disability but no limiting health problems. For pensioners with a long-standing illness or disability however, the rate of persistent low income AHC was the same (10%) whether they had a limiting health problem or not. The patterns observed here are likely to reflect both the effect of a limiting health problem or disability on the income of working-age adults as well as the higher levels of home ownership among pensioners.
See Tables 4.1p, 4.7p and 4.13c in the Working-age adults in persistent low income file and 5.1p, 5.7p and 5.13c in the Pensioners in persistent low income file for more information.
8. Movement between income quintiles
The data used in Income Dynamics is longitudinal, meaning that it follows the same individuals over time. This section compares where individuals were in the income distribution in 2010 to 2011 to where they were in the income distribution in 2019 to 2020. It does this using income quintiles, both before and after housing costs. It does not look at where individuals were in the income distribution in the intervening years.
Income quintiles divide the population, when ranked by household income, into five equally sized groups. Quintile 1 (Q1) represents the fifth of the population with the lowest household incomes. Quintile 5 (Q5) represents the fifth of the population with the highest household incomes.
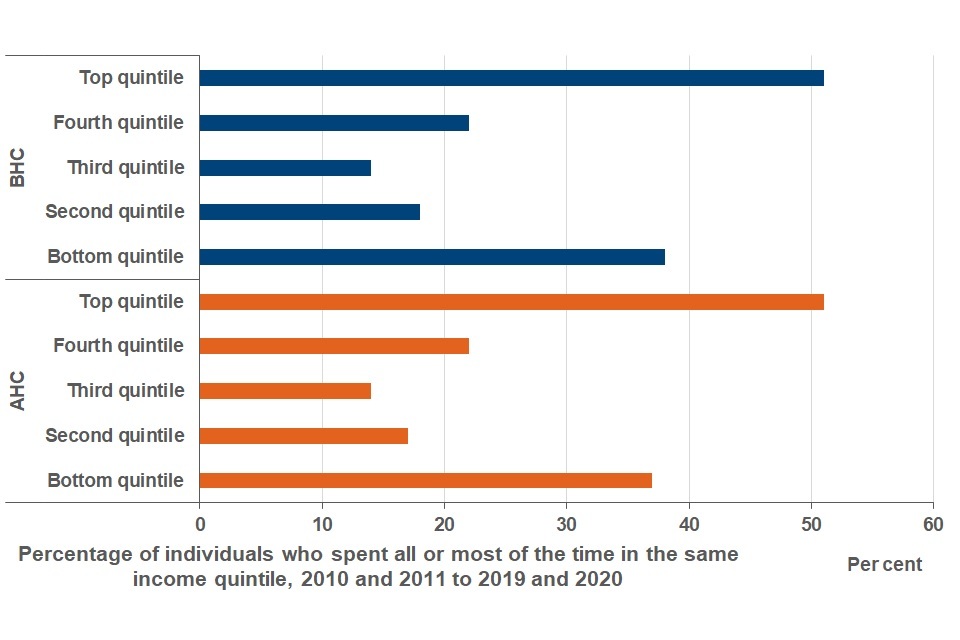
Individuals in the top income quintile in 2010 to 2011 were considerably more likely to be in the same income quintile in 2019 to 2020 than those in other income quintiles, both BHC and AHC
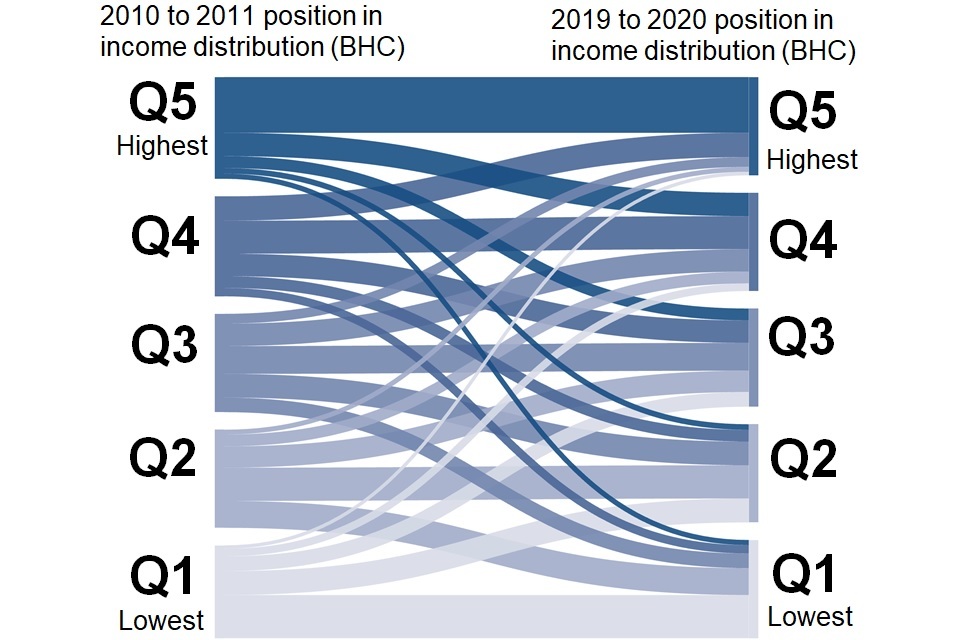
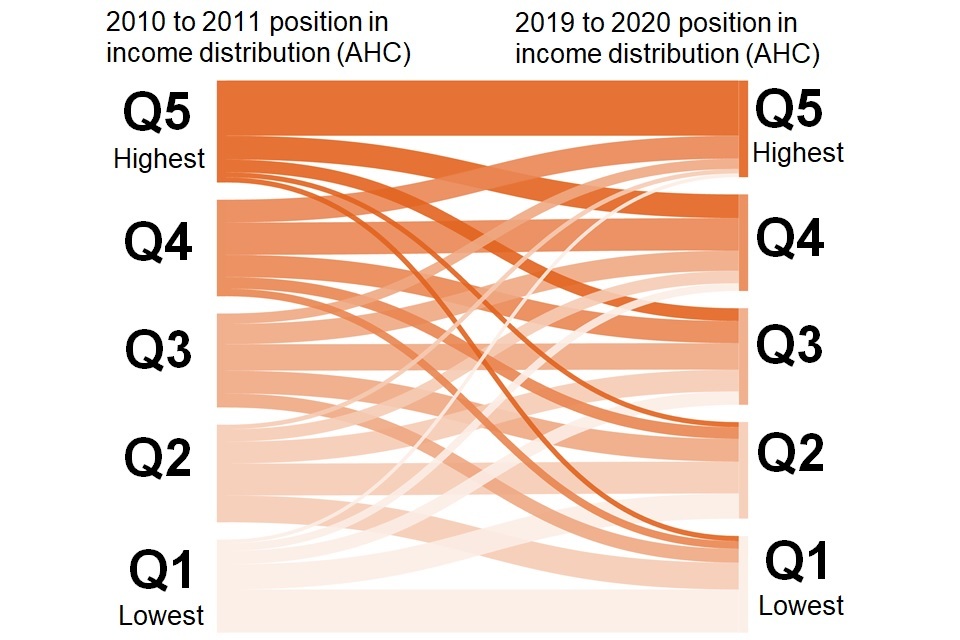
Individuals in the top (5th) quintile in 2010 to 2011 were more likely to be in the same quintile in 2019 to 2020 (53% both BHC and AHC) than individuals in any other income quintile in 2010 to 2011. Those in the bottom (1st) quintile in 2010 to 2011 were the individuals next most likely to be in the same quintile in 2019 to 2020 (36% BHC and 38% AHC). Those in the second to fourth quintiles were more likely to have moved into adjacent income quintiles by 2019 to 2020: for example, just 28% of those in the third income quintile (BHC) in 2010 to 2011 were still in this quintile in 2019 to 2020, while 45% of those in the third income quintile BHC in 2010 to 2011 had moved to an adjacent income quintile by 2019 to 2020. AHC analysis showed a similar pattern.
A closer look at the income quintiles in which individuals spent most of their time in the years between 2010 to 2011 and 2019 to 2020 shows that most individuals experienced movement into other income quintiles at some point. However, those in the top quintile were most likely to spend all or most of the intervening years in the same quintile (51% for BHC and AHC), followed by those in the bottom quintile (38% BHC and 37% AHC). Individuals in Quintiles 2 to 4 were less likely to do so: rates ranged from 14% to 22% (BHC and AHC).
For more information, please see Table 6.1 in the Movements between Quintiles file and 7.1 from Quintile movements over time file, both of which are in the tables accompanying this release.
9. Entries into and exits from low income
The number of individuals who entered and exited low income across the period 2018 and 2019 to 2019 and 2020 were very similar, both BHC and AHC. Rates of low income entry and exit were, however, very different because they are based upon different sized populations.
Rates of entry into low income between 2018 to 2019 and 2019 to 2020
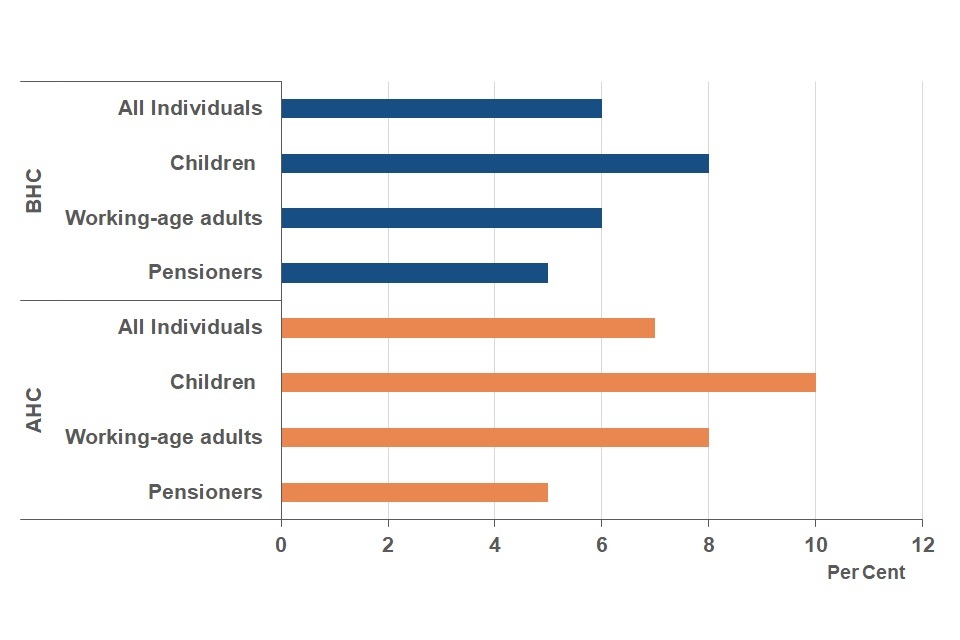
The rate of entry into low income for all individuals was 6% BHC and 7% AHC. The highest risk of entering low income was for children both BHC (8%) and AHC (10%). In contrast to this, pensioners had the lowest risk of entering low income (5% both BHC and AHC). Rates of entry into low income - including for different types of individual - have been relatively stable over time, both BHC and AHC.
Rates of exit from low income between 2018 to 2019 and 2019 to 2020
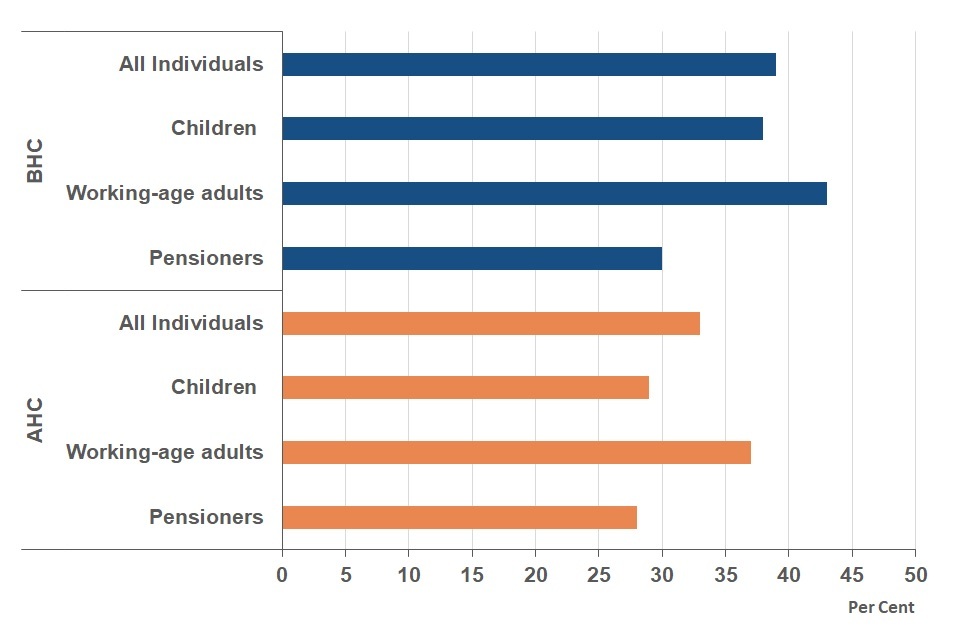
Note: Numbers entering and exiting low income were roughly equivalent. However, because those in low income are a smaller group than those who are not, rates of exit from low income are greater than rates of entry.
The rate of exit from low income for all individuals was 39% BHC and 33% AHC. Working-age adults were most likely to exit low income both BHC (43%) and AHC (37%) whereas pensioners were least likely to exit low income, both BHC (30%) and AHC (28%).
Pensioners experienced the lowest rates of low income entry and exit, with minimal differences between BHC and AHC rates. This reflects the fact that pensioners are more likely to own their own homes and may experience less fluctuation in their incomes.
Rates of low income entry and exit associated with other characteristics
ID also produces entry and exit statistics for other sub-groups using rates averaged over three, two-wave periods: the following analysis therefore spans the period between 2016 to 2017 and 2019 to 2020. Individuals are classified according to their status in the first of each of the two-wave periods. For those characteristics which are less likely to stay the same over time, Section 10 - which looks at events associated with low income entry and exit - offers better insight because it examines how status changes – e.g. a change in the number of workers in a household – are associated with low income movements. The focus in this section is on characteristics that are not examined via Section 10, as well as those which are less likely to see frequent change.
Ethnicity
Analysis of entry and exit rates by ethnicity shows that there were differences in low income entry rates: individuals with a White head of household were less likely to enter low income (6% across the most recent four-wave period) than individuals with Asian/ Asian British heads of household (11%) and with Black/ African/ Caribbean/ Black British heads of household (10%). A similar pattern - but with higher rates of entry - was observed AHC, and these rates of entry have changed little over time. Rates of low income entry for individuals with heads of household from mixed or multiple ethnic groups, or from an Other ethnic group have been more variable over time, but in the most recent four-wave period, BHC rates were 9% and 8% respectively; AHC rates were 14% and 8% respectively.
Rates of low income exit also varied by ethnicity, but patterns and trends were less clear. Some of the variation observed when looking at low income exit by ethnicity are likely to be driven by smaller sample sizes, particularly for individuals with a head of household of mixed or multiple ethnicity or from the Other ethnic group category. Individuals with an Asian/ Asian British head of household were less likely to exit low income, both BHC (30%) and AHC (28%), than those with a White head of household (37% BHC and 34% AHC) or a Black/ African/ Caribbean/ Black British head of household (43% BHC and 32% AHC).
Tenure
Across tenure types, individuals living in the social rented sector were most likely to enter low income, both BHC (11%) and AHC (17%); this was followed by those renting privately (8% BHC and 14% AHC). Those who owned their homes outright and those who were buying with a mortgage were least likely to enter low income, both BHC (5% and 4% respectively) and AHC (4% and 5% respectively). Rates of low income entry across tenure have changed little over time.
Owner occupiers were least likely to exit from low income BHC (32%): this is likely to reflect the demographics associated with this tenure type, with older age groups – particularly pensioners (who are associated with lower levels of low income exit) - being more likely to own their own homes. Renters (both private and social sector) had slightly higher BHC exit rates than owner occupiers (35% and 37% respectively), but the lowest likelihood of exiting low income AHC (26% and 29% respectively). Those who were buying their homes with a mortgage had the highest rate of low income exit (47% both BHC and AHC). Over time, rates of low income exit have been relatively stable for individuals in all tenure types with the exception of the private rented sector, which has seen decreasing exit rates both BHC and AHC.
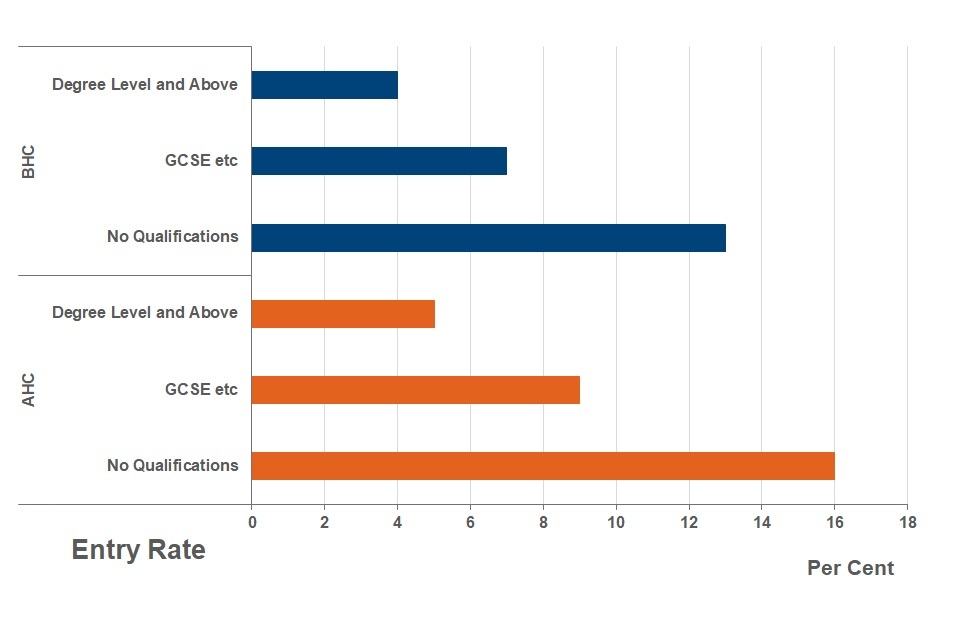
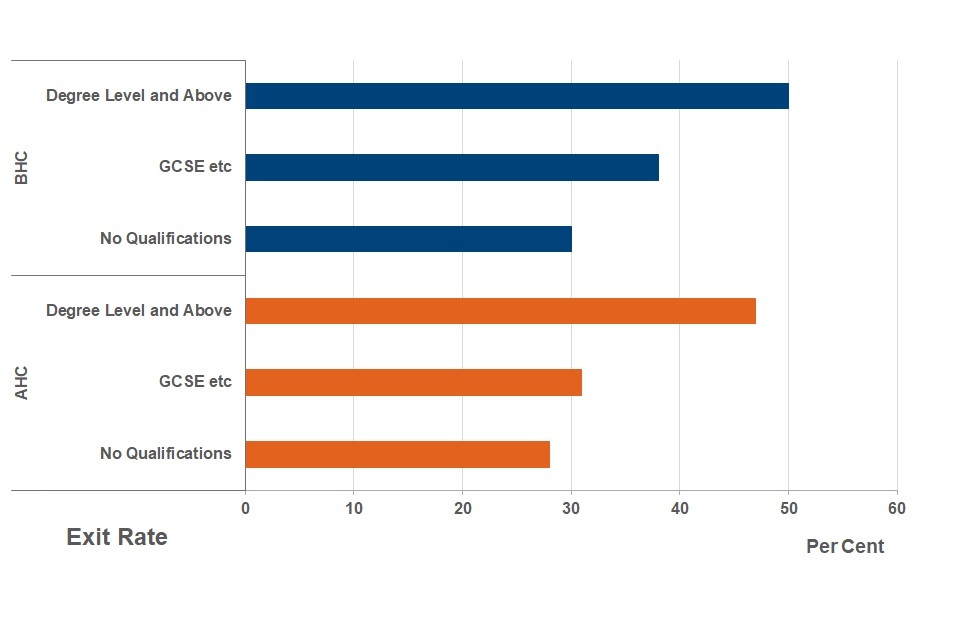
Qualifications
When looking at the qualifications of working-age adults, there is a clear pattern across low income entry and exit, which has been consistent over time. Those with no qualifications are at greatest risk of entering low income: 13% BHC and 16% AHC did so over the most recent four-wave period. This contrasts with individuals with GCSE level qualifications who had 7% BHC and 9% AHC low income entry rates. Individuals with degree level qualifications were least likely to enter low income (4% BHC and 5% AHC).
Working-age adults with lower levels of qualification were least likely to exit from low income (30% BHC and 28% AHC). By contrast, 50% of those with degree level qualifications exited BHC low income over the period 2016 to 2017 and 2019 to 2020, and 47% exited AHC low income. While 38% of those with GCSE level qualifications exited BHC low income over this period, 31% exited AHC low income.
See Tables 8.6 and 8.14 in the Low-income entry and exit rates file for rates of entry and exit for working-age adults with other levels of qualification.
Family type
Single adults with children were most likely to enter low income compared to other family types, both BHC (11%) and AHC (18%). Compared to this, couples without children and pensioner couples had the lowest rates of entry into low income, both BHC (4% for both) and AHC (5% and 4% respectively). Rates of low income entry by family type have changed little over time.
Compared to couples without children, who were most likely to exit low income (46% BHC and 48% AHC), single adults with children had low rates of exit from low income, both BHC (28%) and AHC (24%). Single pensioners had similarly low rates of exit from low income (for single male pensioners: 28% BHC and 26% AHC; and for single female pensioners 27% BHC and 28% AHC). There has been relatively little change in these rates or the pattern observed, over time.
Analysis of entries and exits only includes ‘clear’ transitions. For an entry or exit to count, household incomes must cross the 60 per cent of median income threshold and be at least 10 per cent higher or lower than the threshold in the following wave. As individuals live in households and we assume that all members of the household benefit equally from the household’s income, they will be affected by changes at the household level.
These are just some of the sub-groups covered in the entry and exit tables. For more breakdowns see Tables 8.1 to 8.16 in the Low-income entry and exit rates file for more information.
10. Events associated with entries into and exits from low income
The role of different events associated with movements into and out of low income are explored in this section. We consider the role of changes in income components, as well as changes in employment within a household, and in the demographic composition of a household. We also consider changes in housing costs and tenure, but only on an AHC basis. For this reason and in order to manage the length of this section, only the AHC findings over the most recent two waves are presented in this summary, but BHC tables and data from previous waves are available as part of this release.
For each event, we present three statistics. These will be explained using the following example:
| Prevalence (%) | Entry rate (%) | Share of entries (%) | |
|---|---|---|---|
| Fall in earnings | 12 | 23 | 37 |
Prevalence – this tells us how common an event is among the population at risk of either entering or exiting low income. When considering the relationship between a fall in earnings and low income entry, the prevalence statistic tells us that 12% of those who were not in low income in the first wave experienced a fall in earnings between the two waves.
Rate of entry or exit if experienced event - in the above example, 23% of those who were not in low income in 2018 to 2019 and who experienced a decrease in earnings, entered low income in 2019 to 2020.
Share of entries – this tells us what percentage of all those who entered or exited low income experienced each event. In the above example, 37% of all those who entered low income experienced a fall in earnings.
In defining these events, attempts have been made to limit the effects of other, potentially important factors, which might have a bearing on the event. For example, when looking at a change in earnings, there must be no change in the number of workers in the household. Please note that not all such factors are controlled for.
Events associated with entering low income between 2018 to 2019 and 2019 to 2020, AHC: key findings[1]
| Prevalence (%) | Entry rate (%) | Share of entries (%)[2] | |
|---|---|---|---|
| Fall in earnings [3] | 12 | 23 | 37 |
| Fall in benefit income [3] | 17 | 13 | 30 |
| Fall in investment income [3] | 19 | 6 | 14 |
| Fall in occupational pension income [3] | 6 | 7 | 6 |
| Fall in the number of workers in household - same household size | 10 | 17 | 22 |
| Fall in the number of full-time workers in household - same household size | 10 | 18 | 25 |
| Change in household type | 14 | 11 | 21 |
| Change to a lone parent household | - | .. | 2 |
| Change from living as a couple to single person status [4] | 1 | 17 | 1 |
| Change from single person status to living as a couple [4] | 1 | 6 | 1 |
| Increase in number of children | 3 | 11 | 5 |
| Change in tenure | 8 | 13 | 13 |
| Rise in housing costs | 9 | 8 | 10 |
“..” indicates that the figure has been suppressed due to small sample size
“-” indicates that the figure is negligible (less than 0.5%).
[1] Not all events are included here. Please refer to Events associated with low income entries and exits tables for findings on all events, including changes in number of workers where household size changes, as well as changes in ‘other’ income sources.
[2] The share of entries column does not sum to 100% as individuals can experience more than one event.
[3] For a change in monthly income or housing costs to be considered an event, it must have risen or fallen by at least 20% and a minimum of £10. Certain demographic changes are controlled for when examining income events: changes in household earnings are only included if the number of workers stays the same. For all other income events, the number of people in the household must not change.
[4] These households do not have children in either wave.
Decreases in earnings and benefit income were the income-related events most closely linked to low income entry. Twelve per cent of those not in low income experienced a fall in earnings between 2018 to 2019 and 2019 to 2020, and 23% of them entered low income. Of those individuals who entered low income between 2018 to 2019 and 2019 to 2020, 37% experienced a fall in earnings. This event represents the highest single share of entries into low income out of all the events in this analysis. A fall in benefit income was experienced by 17% of individuals not in low income in 2018 to 2019. While more households experienced this than a fall in earnings, it was less likely to be associated with an entry into low income (13%). A fall in benefit income was experienced by 30% of those who entered low income, making it the second highest single share of all entries.
The two events which involved a reduction in the number of workers (but where there was no change in household size) were both experienced by 10% of individuals not in low income in 2018 to 2019. Just under a fifth of individuals who experienced reduction in the number of household workers subsequently entered low income. Of all individuals who entered low income between 2018 to 2019 and 2019 to 2020, 22% experienced a fall in the number of workers where household size stayed the same, and a quarter (25%) experienced a fall in the number of full-time workers where household size stayed the same.
A change from living as a couple to single person status only occurred for 1% of those who were not in low income in 2018 to 2019. However, of those, 17% entered low income. Partly to provide context, we include a measure of household type change. While this measure does not refer to specific types of change, it does highlight how prevalent a household type change is (14%) and, more relevantly, identify that household type change is associated with a fifth (21%) of low income entries.
See Tables 9.1n to 9.16n in the Events associated with entries and exits tables for more information.
Events associated with exiting low income between 2018 to 2019 and 2019 to 2020, AHC: key findings [1]
| Prevalence (%) | Exit rate (%)[2] | Share of exits (%)[3] | |
|---|---|---|---|
| Rise in household earnings [4] | 22 | 55 | 36 |
| Rise in benefit income [4] | 29 | 48 | 41 |
| Rise in investment income [4] | 11 | 49 | 16 |
| Rise in occupational pension income [4] | 6 | 63 | 12 |
| Rise in the number of workers in household - same household size | 12 | 41 | 15 |
| Rise in the number of full-time workers in household - same household size | 11 | 55 | 19 |
| Change in household type | 16 | 40 | 20 |
| Change from a lone parent household | 2 | .. | 3 |
| Change from living as a couple to single person status [5] | - | .. | - |
| Change from single person status to living as a couple [5] | 1 | .. | 2 |
| Decrease in number of children | 8 | 36 | 9 |
| Change in tenure | 8 | 36 | 9 |
| Decrease in housing costs | 10 | 24 | 7 |
“..” indicates that the figure has been suppressed due to small sample size
“-” indicates that the figure is negligible (less than 0.5%).
[1] Not all events are included here. Please refer to Events associated with low income entries and exits tables for findings on all events, including changes in number of workers where household size changes, as well as changes in ‘other’ income sources.
[2] Because those in low income are a smaller group than those who are not, and are, by definition, closer to the low income threshold, they have a greater chance of exiting low income if they experience a particular event than those not in low income have of entering low income if they experience the same event. This explains why exit rates tend to be higher than entry rates.
[3] The share of entries column doesn’t sum to 100% as individuals can experience more than one event.
[4] For a change in monthly income or housing costs to be considered an event, it must have risen or fallen by at least 20% and a minimum of £10. Certain demographic changes are controlled for when examining income events: changes in household earnings are only included if the number of workers stays the same. For all other income events, the number of people in the household must not change.
[5] These households do not have children in either wave.
A rise in household earnings and a rise in benefit income had the highest prevalence rate among individuals in low income (22% and 29% respectively) between 2018 to 2019 and 2019 to 2020. Of the individuals who experienced a rise in household earnings, 55% exited low income, and of those who experienced a rise in household benefit income, 48% exited low income. An increase in these two income sources was closely linked to all low income exits between 2018 to 2019 and 2019 to 2020, 36% of whom experienced a rise in household earnings, and 41% experienced an increase in benefit income. Although relatively few individuals in low income experienced an increase in occupational pension income (6%), it was associated with 63% rate of exit.
Of the individuals who were in low income in 2018 to 2019, 12% saw an increase in the number of workers in their household in 2019 to 2020, 41% of whom exited low income. When looking at an increase in the number of full-time workers in households who were in low income in 2018 to 2019, this was experienced by a similar proportion of individuals (11%), but was associated with a higher rate of exiting low income (55%). This event also accounted for a slightly greater share of all low income exits (19%) compared to 15% when considering an increase in the number of workers regardless of hours worked.
Events analysis and the coronavirus pandemic
In reviewing the findings from ID events analysis, consideration has been given to whether any changes have been observed which might be directly or indirectly linked to the coronavirus pandemic. This is discussed here. Please bear in mind caveats set out in Section 1 above and refer to the Background information and methodology section to support interpretation of the findings.
Firstly, low income entries analysis shows that there appears to be a slight increase in the percentage of individuals experiencing a fall in household earnings, from 10% across all previous two-wave periods to 12% in the most recent one. A loss in earnings was also associated with a higher share of low income entries than in previous waves. These changes could be linked to employment loss or a reduction in working hours. It is likely that this event has not captured the experience of furlough in relation to a reduction in earnings, since it requires at least a 20% fall in earnings to qualify as a real change (workers on furlough received at least 80% of their pre-pandemic income). Another point to bear in mind is that when reporting earnings, USoc respondents were asked to report ‘usual’ levels of pay, and so may not have reported reduced amounts.
Secondly, low income exits analysis shows no increase in the prevalence of an increase in benefit income. Although Universal Credit and Working Tax Credit claimants received an additional £20 per week in benefits from April 2020, and we would expect some of those claimants to have been surveyed after this change, it is plausible that for many claimants, the £20 increase did not meet the threshold required for our events analysis to capture an increase in benefits (this must be an increase of 20%).
Finally , there were slight increases across the most recent two waves in all three statistical measures used to explore the link between a fall in the number of workers in a household and low income entry, i.e.: a fall in the number of workers was slightly more prevalent; it was associated with a slightly increased risk of low income entry; and it accounted for a slightly greater share of all low income entries. These slight increases were not observed when looking at reductions in the number of full-time workers (BHC), but were seen in the AHC statistics. These changes may be reflecting some employment loss associated with the coronavirus pandemic.
Note: for events which rely on counting the number of workers in a household, a change to our code was made to ensure that individuals who reported being on furlough (which was possible via the survey but only from the end of July 2020), were also included in the count of workers. Had we not made this change, any individual reporting a furlough status would have appeared as a reduction in the number of workers in the household. This decision was made because it was felt that retention of at least 80% of earnings was, in income terms, much closer to retaining an employed status than to being classed as not working. In reality, this change made very little difference to our findings on workers (never more than a 1 percentage point change), not least due to the fact that relatively few individuals actually reported themselves as being on furlough.
See Tables 9.1x to 9.16x in the Events associated with low income entries and exits tables for more information.
11. About these statistics
ID uses data from Understanding Society to derive a measure of disposable household income. A household income measure implicitly assumes that all members of the household benefit equally from the combined income of the household, and so all members of a household will appear at the same position in the income distribution. Adjustments are made to take into account the size and composition of households to make figures comparable – see section on equivalisation, below.
Definitions
Understanding Society
Understanding Society, led by the University of Essex, is a longitudinal survey of individuals in the United Kingdom which has been running since 2009. The Wave 11 sample (2019 and 2020) included over 27,000 individuals. Those not in private households at the start of the survey in 2009 are not included.
Income
This includes:
- Labour income – usual pay and self-employment earnings. Includes income from second jobs. For Wave 11 (2019 and 2020), this will include any income received via the government Coronavirus Job Retention Scheme (‘furlough’ income). Support received by self-employed individuals via the Self-Employment Income Support Scheme (SEISS) will typically be factored into income calculations in 2021. Please see our Background information and methodology note for more information.
- Miscellaneous income – educational grants, payments from family members and any other regular payments.
- Private benefit income – includes trade union/friendly society payments, maintenance or alimony and sickness or accident insurance.
- Investment income – private pensions/annuities, rents received, income from savings and investments.
- Pension income – occupational pensions income.
- State support – tax credits and all state benefits including State Pension and Universal Credit.
Before Housing Costs (BHC) Income
Often used for non-pensioner analysis and is net of the following: income tax payments and National Insurance contributions, council tax
After Housing Costs (AHC) Income
Derived by deducting housing costs (mortgage interest and rent payments) from the BHC income measure. It is often used for pensioner analysis.
Equivalisation
An adjustment is made to income to make it comparable across households of different size and composition. For example, this process of equivalisation would adjust the income of a single person upwards, so their income can be compared directly to that of a couple.
Relative Low Income
This is defined for this publication as an individual in a household with an equivalised household income of less than 60% of median income. A household is in persistent low income if they are in low income for at least three of the last four survey periods.
Inflation
This concerns how goods and services increase in price (generally) over time. ID uses an adjustment based on the Consumer Prices Index (CPI), also used in HBAI, to compensate for the effects of inflation over time.
Sampling Error
Results from surveys are estimates and not precise figures – in general terms the smaller the sample size, the larger the uncertainty. We are unable to calculate sampling uncertainties for these statistics, but please note that small changes are unlikely to be statistically significant.
Non-sampling Error
Survey data represents the best data from respondents to the survey. If people give inaccurate responses or certain groups of people are less likely to respond, this can introduce bias and error. This non-sampling error can be minimised through effective and accurate sample and questionnaire design and extensive quality assurance of the data. However, it is not possible to eliminate it completely, nor can it be quantified.
Equivalisation explained
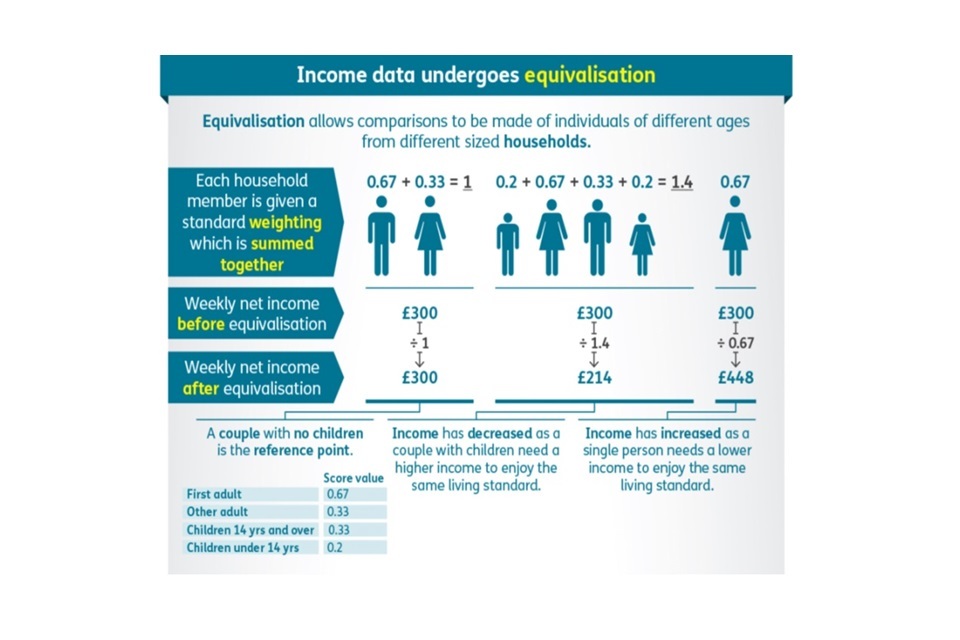
Equivalisation allows comparisons of income levels to be made between individuals of different ages from different sized households.
Each household member is given a weighting which is summed together to provide a household weighting factor. Household weekly net income is divided by that factor to give equivalised income. A couple with no children is the reference point.
Weights are:
- first adult 0.67
- other adult or child 14 years and over 0.33
- child under 14 years 0.2
Official Statistics
Income Dynamics is Official Statistics.
National, Official and Experimental Statistics are produced in accordance with the Statistics and Registration Service Act 2007 and the Code of Practice for Statistics. National Statistics status means that official statistics meet the highest standards of trustworthiness, quality and public value, signifying compliance with all aspects of the Code. Official and Experimental Statistics may be awarded National Statistics status following an assessment by the Office for Statistics Regulation, the regulatory arm of the UK Statistics Authority.
Further information about National, Official and Experimental Statistics status can be found in the Code glossary.
Contact information and feedback
DWP would like to hear your views on our statistical publications. If you use any of our statistics publications, we would be interested in hearing what you use them for and how well they meet your requirements.
Press enquiries should be directed to the:
DWP Press Office
Telephone: 0115 965 8781.
Enquiries about these statistics should be directed by email to: teamincome.dynamics@dwp.gov.uk
Lead Analyst: Helen Smith
ISBN: 978-1-78659-398-6
12. Related information and statistics
Reference tables and the ID Background information and methodology report, provide further detail on how we estimate ID measures, together with a new ID Quick Guide and a new ID Tables Guide.
Analysis of Income Dynamics data from previous years, as well as further guidance and information about the statistics is available.
Estimates of numbers in low income in a single year from Households Below Average Income.
The following ONS publications provide useful information and guidance on alternative sources of data on earnings and income:
- a guide to sources of data on income and earnings
- a new interactive tool which enables users to quickly locate information about key statistics on income and earnings
- explaining income and earnings: important questions answered
Please refer to the ID Background note and methodology report for more information on related statistics.