How many people do we grant asylum or protection to?
Published 30 November 2017

© Crown copyright 2017
This publication is licensed under the terms of the Open Government Licence v3.0 except where otherwise stated. To view this licence, visit nationalarchives.gov.uk/doc/open-government-licence/version/3 or write to the Information Policy Team, The National Archives, Kew, London TW9 4DU, or email: psi@nationalarchives.gov.uk.
Where we have identified any third party copyright information you will need to obtain permission from the copyright holders concerned.
This publication is available at https://www.gov.uk/government/statistics/immigration-statistics-july-to-september-2017/how-many-people-do-we-grant-asylum-or-protection-to
Back to Immigration Statistics July to September 2017 content page.
This is not the latest release. View latest release.
Data relates to the year ending September 2017 and all comparisons are with the year ending September 2016, unless indicated otherwise.
This section covers asylum applications, initial decisions, estimated final outcomes, resettlement, unaccompanied asylum-seeking children (UASC), international comparisons and support. In line with our plan to provide users annually with a more detailed commentary, a more detailed discussion of the figures was included in the Immigration Statistics April to June 2017 release How many people do we grant asylum or protection to? Topic.
1. Key facts
In the year ending September 2017, there were 15,618 grants of asylum, alternative forms of protection and resettlement, compared with 15,433 in the previous year. This comprised of:
- 8,147 grants of asylum to main applicants and dependants (down 9%)
- 1,123 grants of alternative form of protection to main applicants and their dependants (down 29%)
- 6,348 people provided with protection and support under a resettlement scheme (up 30%)
The number of asylum applications in the UK from main applicants decreased by 21% to 26,617 in the year ending September 2017.
There were 2,765 asylum applications from UASC in the year ending September 2017, a 15% decrease compared to the previous year of 3,244.
Of the 21,916 initial decisions on asylum applications from main applicants, 34% were grants of asylum or an alternative form of protection, compared to 35% in the previous year.
There were 924 grants of asylum, or an alternative form of protection, to Syrian nationals (including dependants) at initial decision in the year ending September 2017.
An additional 4,980 Syrian nationals were resettled under the Vulnerable Persons Resettlement Scheme (VPRS). Since this scheme began in 2014, a total of 9,394 people have been resettled.
2. Long-term trends in asylum applications for main applicants
Number of asylum applications, 2001 to 2016
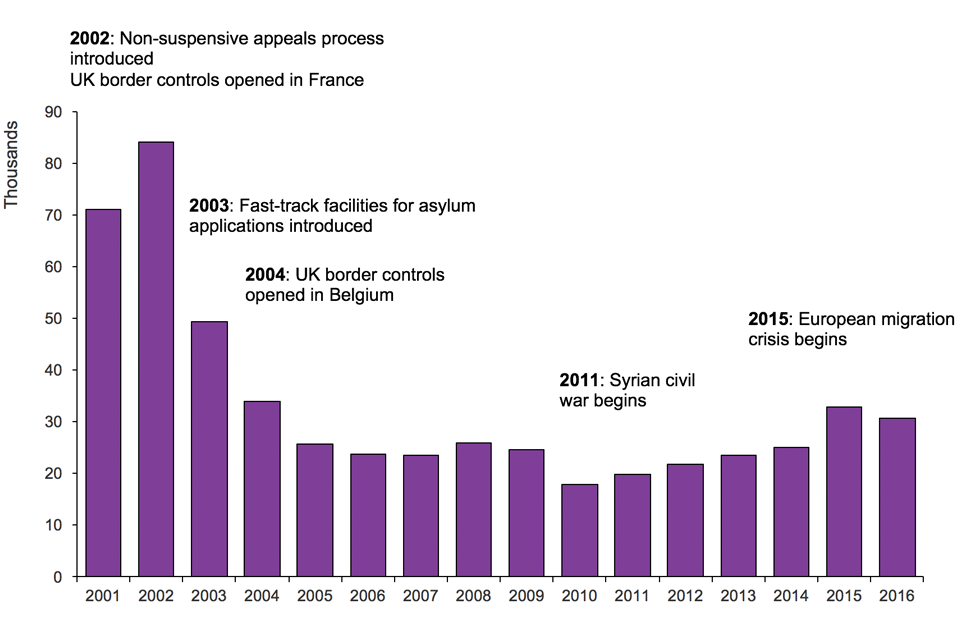
The chart shows the number of asylum applications made between 2001 and the latest calendar year. The data are available in Asylum table as 01 q.
Chart notes
Source: Home Office, Immigration Statistics July to September 2017, Asylum table as 01 q (Asylum volume 1).
3. Asylum applications by nationality
Nationalities with the highest number of asylum applications in year ending September 2017, compared with the number of applications made for these nationalities in year ending September 2016.
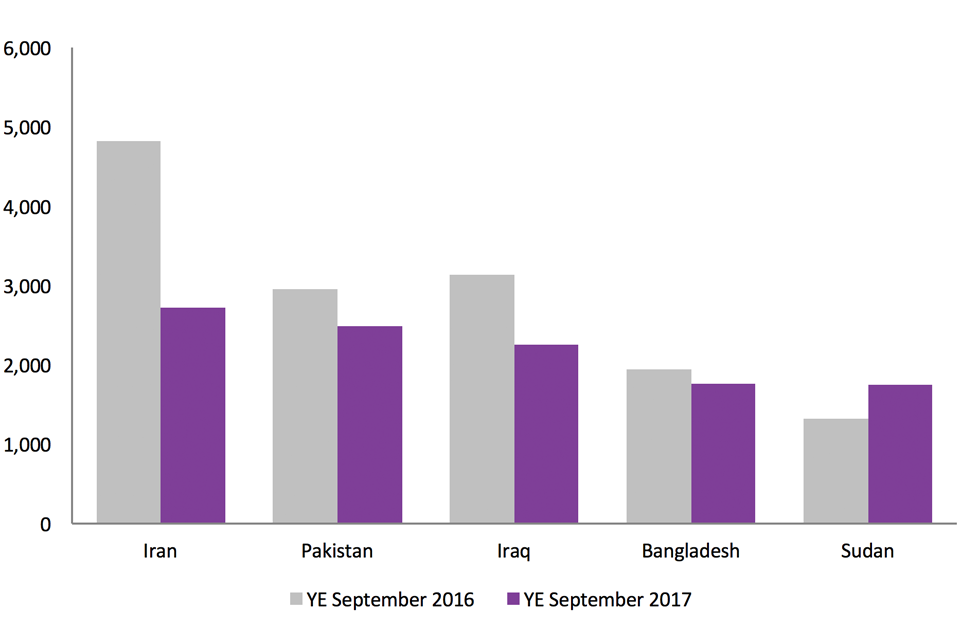
The chart shows the top 5 ranked nationalities for asylum applications between the year ending September 2016 and the year ending September 2017. The data are available in table as 01 q.
Chart notes
Source: Home Office, Immigration Statistics July to September 2017, Asylum table as 01 q (Asylum volume 1).
The largest number of asylum applications in the year ending September 2017 came from Iranian nationals. This was followed by nationals from Pakistan and Iraq. Of the 5 nationalities with the highest number of applications, 4 saw falls compared with the previous year, and one (Sudan) saw an increase.
Applications from Syrian nationals saw a 68% fall in the year ending September 2017. This decrease should be seen alongside an increase in the number of Syrian nationals being granted protection in the UK through other means such as the Vulnerable Persons Resettlement Scheme. The number of Syrian’s granted protection through resettlement schemes increased by 20% in the most recent year (from 4,163 to 4,999).
4. Unaccompanied asylum-seeking children
A UASC is a person under 18 years old, or in the absence of documentary evidence establishing age, appears to be under 18, who is applying for asylum in his or her own right and has no relative or guardian in the United Kingdom.
There were 2,765 asylum applications from UASC in the year ending September 2017, a 15% decrease compared to the previous year of 3,244.
The largest numbers of asylum applications from UASC were from Sudanese (which increased by around 5 times the number in the previous year) and Eritrean nationals, both accounting for 16% of applications each. This was followed by Afghan nationals (13%) and Albanian nationals (11%).
Of the 1,778 initial decisions relating to UASC made in the year ending September 2017, 56% were grants of asylum or another form of protection, and 24% of those were grants of temporary leave (UASC leave). UASC applicants that are refused will include those from countries where it is safe to return children to their families, as well as some applicants who were determined to be over 18 following an age assessment.
Data on UASC can be found in tables as 08 to as 10.
5. Support provided to asylum seekers
Section 95 support is provided to destitute asylum seekers until their claim is finally determined. Section 95 support can be provided as both accommodation and subsistence, or accommodation, or subsistence only.
An individual may be eligible for Section 4 support if their asylum application has been determined as refused and appeals rights are exhausted, but they are destitute and there are reasons that temporarily prevent them from leaving the UK.
See the User Guide to Home Office Immigration Statistics for more detail on support.
At the end of September 2017, a total of 39,414 people in the UK were in receipt of support under Section 95 of the Immigration and Asylum Act 1999. This number has increased by 4% since September 2016. The total figure remains considerably below that for the end of 2003 (the start of the published data series), when there were 80,123 people in receipt of Section 95 support.
Separately, at the end of September 2017, there were 3,923 people receiving support under Section 4 of the Immigration and Asylum Act 1999, a 1% increase from the previous year.
Data on support provided to asylum seekers can be found in tables as 15 to as 18.
6. Resettlement
In addition to those asylum seekers who apply in the UK, resettlement schemes are offered to those who have been referred to the Home Office by The United Nations Refugee Agency (UNHCR).
On 7 September 2015, an expansion to the existing VPRS was announced. Through this expansion, it was proposed that 20,000 Syrians in need of protection be resettled in the UK by 2020. A total of 9,394 people have been resettled under the VPRS since the scheme began, and in the year ending September 2017, 4,980 people were resettled under the VPRS across 229 different local authorities. Around half (51%) of those resettled under the VPRS were under 18 years old (2,525), and around half (47%) were female (2,356).
In the year ending September 2017, there were 1,368 people that have been resettled through other resettlement schemes including the Vulnerable Children Resettlement Scheme (412), Gateway Protection Programme (929) and the Mandate Scheme (27).
Resettlement data can be found in tables as 19 and as 20.
7. International comparisons
Figures in this section are based on data supplied by the individual countries to the Intergovernmental Consultations on Migration, Asylum and Refugees (IGC), UNHCR and Eurostat. Not all countries provide the latest data in time for each Immigration Statistics release. Where a figure is unavailable for a given month, we estimate it using the average of the last 3 months available, unless the time series is erratic, when we use the average of the last 12 months.
Including dependants, the total number of asylum applications to the EU in the year ending September 2017 was an estimated 710,100 a decrease of 52% compared to the year ending September 2016 (1,477,700).
Top EU countries receiving asylum applications, 2016
| Country of application | Total applications | Total positive decisions | Total resettled |
|---|---|---|---|
| Germany | 722,265 | 433,905 | 1,240 |
| Italy | 121,185 | 35,405 | 1,045 |
| France | 76,790 | 28,755 | 1,420 |
| Greece | 49,875 | 2,715 | 0 |
| Austria | 39,875 | 30,370 | 200 |
| United Kingdom (HO data) | 39,357 | 9,944 | 5,212 |
Table notes
Source: other than for the UK: Eurostat Asylum quarterly report.
(1) Eurostat figures are rounded to the nearest 5 and so may not sum to the total.
(2) The estimated figures in this chart are based on data supplied to IGC and UNHCR.
8. Data tables
Data referred to here can be found in the following tables:
Asylum tables volume 1
Asylum tables volume 2
Asylum tables volume 3
Asylum tables volume 4