How many people continue their stay in the UK?
Published 25 May 2017

© Crown copyright 2017
This publication is licensed under the terms of the Open Government Licence v3.0 except where otherwise stated. To view this licence, visit nationalarchives.gov.uk/doc/open-government-licence/version/3 or write to the Information Policy Team, The National Archives, Kew, London TW9 4DU, or email: psi@nationalarchives.gov.uk.
Where we have identified any third party copyright information you will need to obtain permission from the copyright holders concerned.
This publication is available at https://www.gov.uk/government/statistics/immigration-statistics-january-to-march-2017/how-many-people-continue-their-stay-in-the-uk
Back to Immigration Statistics January to March 2017 content page.
This is not the latest release. View latest release.
Data relate to the year ending March 2017 and all comparisons are with the year ending March 2016, unless indicated otherwise.
This section relates to people extending their temporary stay in the UK, staying permanently (settlement) and applying for British citizenship. It also covers residence documentation issued to EEA nationals and their family members.
1. Key facts
There were 152,044 main applicants granted an extension to their stay in 2016; 121,026 (80%) allowed the individual to stay within their original broad category (e.g. students continuing to study), with the other 20% having switched categories (e.g. Tier 4 students switching to work).
There were 57,111 people granted permission to stay permanently in the year ending March 2017, 28% or 21,944 fewer than the previous year. The number of grants is low relative to the peak number of grants in the year ending September 2010 (241,586).
In the year ending March 2017, 108,590 documents certifying permanent residence and permanent residence cards were issued. This is the highest recorded annual figure and more than 5 times the figure for the previous 12 months (20,514).
Total applications for British citizenship fell by 20,733 (14%) to 131,558 in the year to March 2017, compared to the previous 12 months and 43% (100,704) lower than the peak in 2013 (232,262). Within the total, applications made by non-EU nationals fell by 26,427 to 109,529, and applications by EU nationals rose by 5,694 (35%) to 22,029.
2. Extension grants by previous category
Extensions of stay relate to individuals inside the UK extending or changing the status of their stay in the UK. An individual is required to apply for an extension or change in status before their existing permission to enter or stay expires.
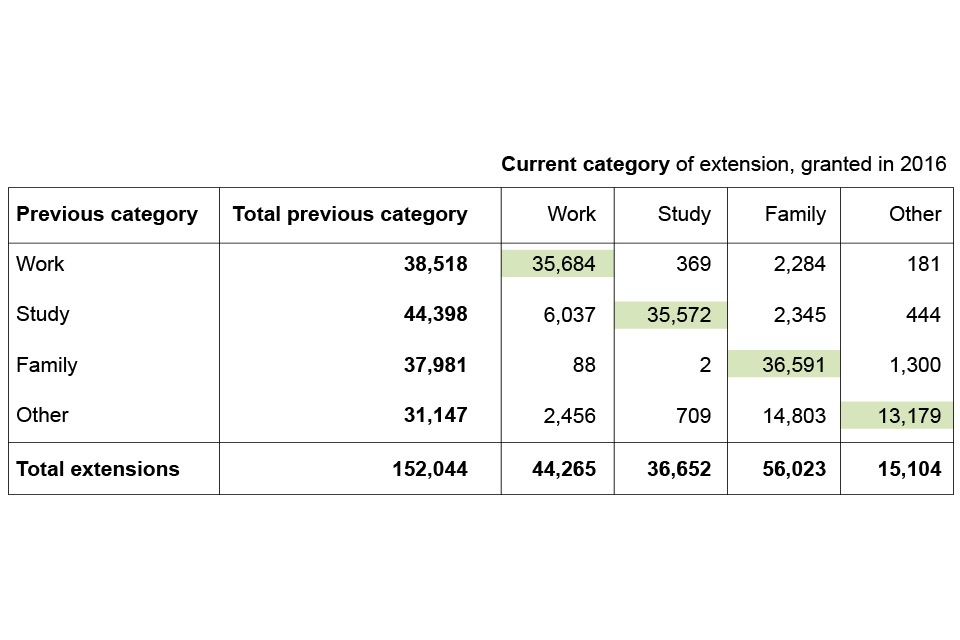
There were 152,044 extensions granted in 2016, of which 44,265 (29%) were for work, 36,652 (24%) for study, 56,023 (37%) for family reasons and 15,104 (10%) for other reasons.
Of the 152,044 extensions granted in 2016 to main applicants, 121,026 (80%) allowed the individual to stay within their original broad category, with the other 20% having switched categories. By comparison, in 2011 and 2012 a higher proportion were allowed to switch (29% and 30% respectively). The fall in the proportion allowed to switch largely reflects the closure of the Post-study route.
Looking at individuals’ previous category, there were 44,398 extensions granted in 2016 to people who were previously students. Of the extensions granted, the majority (80%) allowed individuals to continue to study. The corresponding proportion in 2012 was 62%.
The previous immigration category of students granted an extension has been estimated for 2013, 2014, 2015 and 2016. The data are provisional and subject to revision.
Grants of extension of stay in 2016, current category by previous category
Not supplied by author.
Table notes
Source: Home Office, Immigration Statistics January to March 2017, Extensions of stay table ex pc 01.
Figures exclude dependants.
3. Settlement grants and refusals
Settlement relates to people, subject to immigration control, given permission to stay permanently in the UK. The number of years an individual must have been here in the UK before they can apply for settlement varies depending on the type of visa currently held. Those granted settlement are able to, without restriction: work or study; travel into and out of the UK; access state benefits; and register their UK-born child as a British citizen. It does not entitle the person to a British passport (which requires British citizenship) or to vote in general elections, which requires Commonwealth or Irish Republic citizenship.
There were 57,111 people granted permission to stay permanently in the year ending March 2017, 28% fewer than the previous year. The majority of the decrease was accounted for by a fall in work grants (-17,634).These decreases are likely in part to reflect changes in the Immigration Rules. For details see the Policy and legislative changes affecting migration to the UK: timeline.
Grants to stay permanently by reason, and refusals
| Year ending | Total decisions | Total grants | Work | Asylum | Family | Other | Refusals |
|---|---|---|---|---|---|---|---|
| Year ending March 2013 | 143,963 | 139,739 | 61,331 | 14,968 | 54,694 | 8,746 | 4,224 |
| Year ending March 2014 | 140,651 | 133,279 | 51,974 | 16,728 | 47,769 | 16,808 | 7,372 |
| Year ending March 2015 | 111,150 | 106,723 | 40,212 | 19,082 | 32,106 | 15,323 | 4,427 |
| Year ending March 2016 | 84,643 | 79,055 | 36,567 | 18,657 | 10,991 | 12,840 | 5,588 |
| Year ending March 2017 | 62,037 | 57,111 | 18,933 | 14,473 | 5,359 | 18,346 | 4,926 |
| Change: latest 12 months | -22,606 | -21,944 | -17,634 | -4,184 | -5,632 | +5,506 | -662 |
| Percentage change | -27% | -28% | -48% | -22% | -51% | +43% | -12% |
Table notes
Source: Home Office, Immigration Statistics January to March 2017, Settlement table se 02 q.
These year-on-year comparisons of decisions numbers can be affected by changes in case-work resource allocation. Such fluctuations can be examined in more detail in the quarterly data that are also available in the published tables.
4. EEA nationals and their family members
Under European law, EEA nationals do not need to obtain documentation confirming their right of residence in the UK.
EEA nationals and their family members can apply for documents certifying permanent residence and permanent residence cards, as confirmation of a right of permanent residence in the UK. There is no need to apply for a residence card as a family member but it can:
- help residence card holders to re-enter the country more quickly and easily if travelling abroad
- show employers that residence card holders are allowed to work in the UK
- help prove residence card holders qualify for certain benefits and services
EEA nationals only need to apply for a permanent residence document if they want to either:
- apply for British citizenship
- sponsor their partner’s visa application under the Immigration Rules
In the year to March 2017, there were 88,838 issues of registration certificates and registration cards made, more than double the previous 12 months (41,615). This is the highest recorded annual figure. Most of the rise is attributed to EU nationals rather than non-EEA family members.
Also in the year ending March 2017, 108,590 documents certifying permanent residence and permanent residence cards were issued. The majority of these (88%) were issued to EU nationals. This is the highest recorded annual figure and more than 5 times the figure for the previous 12 months (20,514).
5. Citizenship grants and refusals
There are different ways to become a British citizen. The most common is called ‘naturalisation’. To apply for British citizenship by naturalisation you must usually have:
- lived in the UK for at least the 5 years before the date of your application
- spent no more than 450 days outside the UK during those 5 years
- spent no more than 90 days outside the UK in the last 12 months
- had settlement in the UK for the last 12 months if you are from outside the European Economic Area (EEA)
- had permanent residence status for the last 12 months if you are a citizen of an EEA country
- not broken any immigration laws while in the UK
There are different requirements if your spouse or civil partner is a British citizen.
Total applications for British citizenship fell by 20,733 (14%) to 131,558 in the year to March 2017 compared to the previous year, and 43% (100,704) lower than the peak in 2013 (232,262). Within the total, applications made by non-EU nationals fell by 26,427 to 109,529, and applications by EU nationals rose by 5,694 (35%) to 22,029.
Applications for citizenship, EU and non-EU nationals
| Year ending | Total applications | Non-EU | EU nationals | EU nationals as % of total |
|---|---|---|---|---|
| Year ending March 2012 | 200,090 | 190,962 | 9,128 | 5% |
| Year ending March 2013 | 179,831 | 168,320 | 11,511 | 6% |
| Year ending March 2014 | 210,790 | 190,200 | 20,590 | 10% |
| Year ending March 2015 | 134,957 | 122,200 | 12,757 | 9% |
| Year ending March 2016 | 152,291 | 135,956 | 16,335 | 11% |
| Year ending March 2017 | 131,558 | 109,529 | 22,029 | 17% |
| Change: latest year | -20,733 | -26,427 | 5,694 | |
| Percentage change | -14% | -19% | 35% |
Table notes
Source: Home Office, Immigration Statistics January to March 2017, Citizenship table cz 01 q a.
Series are based on current EU membership, i.e Croatians included in EU total throughout.
See Citizenship table cz 01 q a and the User Guide to Home Office Immigration Statistics for more details.
Increases in applications from EU nationals in recent years are likely to reflect immigration in earlier years while the most recent rise may be partly due to the impact of rule changes and recent events.
Applications received from nationals of most EU states increased in the latter half of 2015, particularly in the fourth quarter, possibly due to people anticipating a change in the rules. After 12 November 2015, a person applying for citizenship who is claiming to have permanent residence as an EEA national or the family member of an EEA national has been required to provide a permanent residence card or a document certifying permanent residence as evidence that they meet the requirement to be free of immigration time restrictions, and this may reduce numbers eligible to apply immediately.
The increase in applications from both non-EU and EU nationals in the first quarter of 2017 may partly reflect people anticipating increases in nationality fees from 6 April 2017.
Long-term trends in applications for citizenship and grants and refusals
The chart below illustrates longer-term trends in applications for citizenship and grants and refusals.
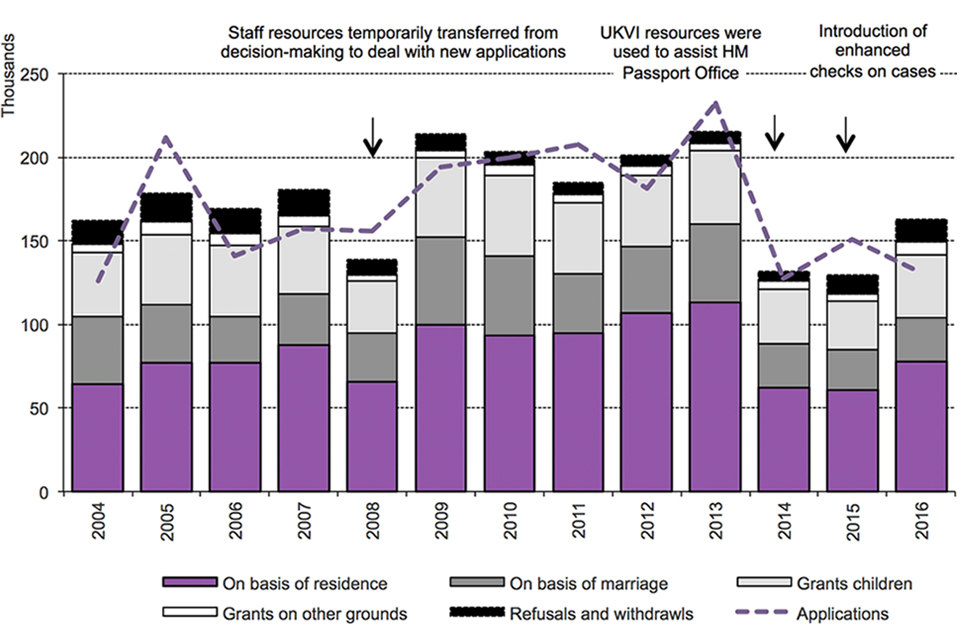
The chart shows the number of applications for grants and refusals of British citizenship between 2004 and the latest calendar year. The data are available in Tables cz 02 and cz 03.
Chart notes
Source: Home Office, Immigration Statistics January to March 2017, Citizenship tables cz 02 and cz 03. In 2008 staff resources were temporarily transferred from decision-making to deal with new applications. In 2014 UK Visas and Immigration (UKVI) resources were used to assist HM Passport Office. In 2015 enhanced checks on cases were introduced.
The increase in applications received during 2005 may have reflected people anticipating the introduction of the Life in the UK test on 1 November that year. Between 2009 and 2013 there was a general increase in applications and grants, which is likely in part to reflect the rise in non-European Economic Area (EEA) migration and increased grants of permission to stay permanently (known as ‘settlement’) in the period up to 2010. The peak in 2013, when there were 232,262 applications, may have been partly due to some people anticipating the rule change to the English language element of the Life in the UK test as of 28 October 2013. See the Policy and Legislative Changes Timeline for further information.
Grants and refusals of citizenship, by reason
| Year ending | Total decisions | Total grants | On basis of residence | On basis of marriage | As children | Other grounds | Refusals and withdrawals |
|---|---|---|---|---|---|---|---|
| Year ending March 2016 | 148,024 | 134,654 | 68,368 | 28,301 | 32,581 | 5,404 | 13,370 |
| Year ending March 2017 | 133,939 | 123,021 | 64,964 | 19,507 | 30,804 | 7,746 | 10,918 |
| Change: latest year | -14,085 | -11,633 | -3,404 | -8,794 | -1,777 | 2,342 | -2,452 |
| Percentage change | -10% | -9% | -5% | -31% | -5% | +43% | -18% |
Table notes
Source: Home Office, Immigration Statistics January to March 2017, Citizenship tables cz 01 q and cz 02 q.
‘Other grounds’ includes Entitlement and Discretionary registration as an adult, Entitlement and Discretionary registration on other grounds, and registration under Section 5 of the British Nationality Act 1981. See Citizenship table cz 07 and the User Guide to Home Office Immigration Statistics for more detail.
6. Staying in the UK
In February 2017 the Home Office published ‘Statistics on changes in migrants’ visa and leave status: 2015‘ ,which shows how non-European Economic Area (EEA) migrants change their immigration status or achieve settlement in the UK or have their status expire.
This analysis shows that the majority (69%) of migrants issued a Study visa in 2004 no longer had valid leave to remain in the UK 5 years later. This proportion has increased in each cohort arriving from 2005, to 81% for those issued a study visa in 2010. Conversely, the proportion of migrants who gained settlement 5 years after entering on a study visa declined over the same period.
Over a quarter (30%; 21,507) of those issued a skilled work visa (which has a potential path to settlement) in 2010 had been granted settlement 5 years after their initial visa had been granted; a further 14% (10,255) still had valid leave to remain in the UK.
The analysis also showed that most people who arrive on a family visa end up applying for and being granted settlement; around 4 out of 5 people (80% or 32,377) issued a family visa in the 2010 cohort had been granted settlement 5 years later, with a further 5% recorded as still having valid leave to remain in the UK.
7. Data tables
Data referred to here can be found in the following tables:
Extensions tables
Settlement tables
Citizenship tables
European Economic Area (EEA) tables