Asylum
Published 25 August 2016

© Crown copyright 2016
This publication is licensed under the terms of the Open Government Licence v3.0 except where otherwise stated. To view this licence, visit nationalarchives.gov.uk/doc/open-government-licence/version/3 or write to the Information Policy Team, The National Archives, Kew, London TW9 4DU, or email: psi@nationalarchives.gov.uk.
Where we have identified any third party copyright information you will need to obtain permission from the copyright holders concerned.
This publication is available at https://www.gov.uk/government/statistics/immigration-statistics-april-to-june-2016/asylum
Valid: 25 August 2016 to 30 November 2016
All data below relate to the year ending June 2016 and all comparisons are with the year ending June 2015, unless indicated otherwise.
Back to ‘Immigration statistics April to June 2016’ content page
This is not the latest release. View latest release.
1. Key facts
Asylum applications in the UK from main applicants increased by 41% to 36,465 in the year ending June 2016, the highest number of applications since the year ending June 2004 (39,746). Numbers of asylum applications in the first two quarters of 2016 (8,228 in January to March and 7,810 in April to June) have been considerably lower than in the last two quarters of 2015 (10,231 in July to September and 10,196 in October to December), although still higher than the same quarters a year earlier.
In the year ending June 2016, the largest number of applications for asylum came from nationals of Iran (4,910), followed by Iraq (3,199), Pakistan (2,992), Eritrea (2,790), Afghanistan (2,690) and Syria (2,563). Most applications for asylum are made by people already in the country (90% of applications in the year ending June 2016) rather than immediately on arrival in the UK at a port.
Including dependants, the number of asylum applications increased by 34% to 44,323 in the year ending June 2016. There was around one dependant for every five main applicants. In 2015, around three-quarters (73%) of applicants were male and four-fifths (81%) were aged under 35.
In the year ending June 2016, the number of initial decisions on asylum applications decreased by 7% to 26,350. Of these initial decisions, 38% (9,957) were grants of asylum or an alternative form of protection, compared to 41% in the previous year. Separate analysis shows that for the years 2012 to 2014, 36% of decisions were granted initially, but this proportion rose to 49% after appeal.
Grant rates vary between nationalities. For example, at initial decision, the grant rate for Iranian nationals was 40% (1,219 grants), compared with 12% (239 grants) for Iraqi nationals. Overall, there were 9,957 grants at initial decision for all nationalities in the year ending June 2016, which corresponds to a grant rate of 38%.
There were 1,936 grants of asylum or an alternative form of protection to Syrian main applicants at initial decision in the year ending June 2016. The grant rate for Syrian applicants was 87%, but some of those not granted will have been transferred to have their case assessed by another EU member state (third country), and others may have been found not to be Syrian following their application.
In addition, 2,682 people (including dependants) were granted humanitarian protection under the Syrian Vulnerable Persons Resettlement Scheme (VPRS). On 7 September 2015, an expansion to the existing Syrian VPRS was announced. Through this expansion it is proposed that 20,000 Syrians in need of protection be resettled in the UK by 2020. A total of 2,898 people have been resettled since the Syrian VPRS began, including 2,646 arriving since October 2015. A total of 3,439 people were resettled in the UK in the year ending June 2016 under the Syrian VPRS, the Gateway Protection Programme and the Mandate Scheme.
Estimated figures show the UK had the eighth highest number (44,000) of asylum applications within the EU in the year ending June 2016, including dependants. Germany (665,000), Sweden (149,000) and Hungary (131,000) were the three EU countries that received the highest number of asylum applications, together accounting for 63% of asylum applications in the EU in that period.
2. Asylum applications and initial decisions for main applicants
| Year | Total applications | Total Initial decisions | Granted1 | Granted as a % of initial decisions | Refused | Refused as a % of initial decisions |
|---|---|---|---|---|---|---|
| Year ending June 2012 | 19,996 | 16,644 | 5,803 | 35% | 10,841 | 65% |
| Year ending June 2013 | 23,523 | 18,712 | 7,105 | 38% | 11,607 | 62% |
| Year ending June 2014 | 23,515 | 13,795 | 5,120 | 37% | 8,675 | 63% |
| Year ending June 2015 | 25,919 | 28,345 | 11,601 | 41% | 16,744 | 59% |
| Year ending June 2016 | 36,465 | 26,350 | 9,957 | 38% | 16,393 | 62% |
| Change: latest year | +10,546 | -1,995 | -1,644 | - | -351 | - |
| Percentage change | +41% | -7% | -14% | - | -2% | - |
Table notes
Source: Home Office, Immigration Statistics April to June 2016, Asylum table as 01 q.
(1) Granted includes grants of asylum, humanitarian protection, discretionary leave, leave to remain under family life or private life rules, leave outside the rules, and UASC leave.
3. Long-term trends in asylum applications for main applicants
The chart below shows the annual number of asylum applications made since 2001.
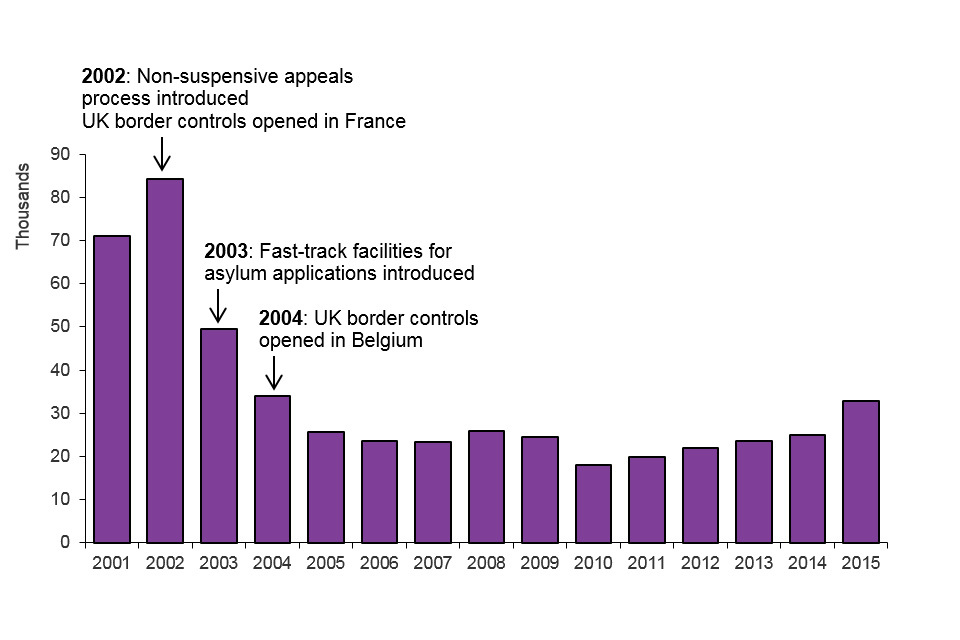
The chart shows the number of asylum applications made between 2001 and the latest calendar year. The data are available in Table as 01.
Chart notes
Source: Home Office, Immigration Statistics April to June 2016, Asylum table as 01.
4. Nationalities applying for asylum
In the year ending June 2016, the largest number of applications for asylum came from nationals of Iran (4,910), followed by Iraq (3,199), Pakistan (2,992), Eritrea (2,790), Afghanistan (2,690) and Syria (2,563). During this period, asylum applications from both Iranian and Afghan nationals more than doubled, while applications from Iraqis almost quadrupled in comparison to the previous year, as shown in the table below.
Countries with highest number of applications for asylum in the UK, year ending June 2016 compared to year ending June 2015
| Ranking in year ending June 2016 | ||||
|---|---|---|---|---|
| (Year ending June 2015) | Nationality | Year ending June 2015 | Year ending June 2016 | Grant rate based on initial decisions (%) |
| 1 (4) | Iran | 2,052 | 4,910 | 40% |
| 2 (10) | Iraq | 847 | 3,199 | 12% |
| 3 (2) | Pakistan | 2,313 | 2,992 | 16% |
| 4 (1) | Eritrea | 3,540 | 2,790 | 48% |
| 5 (7) | Afghanistan | 1,337 | 2,690 | 35% |
| 6 (3) | Syria | 2,157 | 2,563 | 87% |
Table notes
Source: Home Office, Immigration Statistics April to June 2016, Asylum table as 01 q.
(1) Grant rates relate to the number of grants for asylum, humanitarian protection, discretionary leave, or other grants of stay, as a proportion of all initial decisions made in the year ending June 2016.
(2) Initial decisions do not necessarily relate to applications made in the same period and exclude the outcome of appeals or other subsequent decisions.
World events have an effect on who applies for asylum at any particular time. For example, the number of applicants from Syria increased sharply following the outbreak of the Syrian civil war in early 2011. The 2,563 applications for asylum from Syrian nationals in the year ending June 2016 compares with 125 in the year ending March 2011. In addition, increasing numbers of people have sought asylum from other countries where there have been concerns over human rights. For example, in the year ending June 2016, there were 2,790 asylum applications from nationals of Eritrea compared to 790 in the year ending June 2011.
Grant rates for asylum and other forms of protection vary considerably between nationalities. For example, at initial decision, the grant rate for Iranian nationals was 40% (1,219 grants), compared with 12% (239 grants) for Iraqi nationals. Overall, there were 9,957 grants at initial decision for all nationalities in the year ending June 2016, which corresponds to a grant rate of 38%.
There were 1,905 grants of asylum or an alternative form of protection to Syrian nationals, at initial decision, in the year ending June 2016 (a grant rate of 87%). (This is in addition to the 2,682 people, including dependants, who were granted humanitarian protection under the Syrian Vulnerable Persons Resettlement Scheme (VPRS) during this period.) Refused asylum applications for Syrians will include cases that have been transferred to be assessed by another EU member state (third country), and may include some where it was found that the applicant did not hold Syrian nationality.
The grant rate at initial decision for Eritrean nationals has fallen recently, coinciding with the publication of updated country information and guidance on illegal exit and national service in Eritrea in March 2015. In the year ending June 2016, the proportion of initial decisions for Eritrean nationals that were grants of asylum or an alternative form of protection was 48%, compared with 73% in the previous year. This has also been reflected in an increase in the number of appeals lodged by Eritrean nationals, from 833 in the year ending June 2015 to 1,248 in year ending June 2016. Of appeals determined in the year ending June 2016, 87% of those by Eritrean nationals were allowed, compared with 53% in the previous year.
5. Resettlement
In addition to those asylum seekers who apply in the UK, resettlement schemes are offered to those who have been referred to the Home Office by UNHCR (the UN agency for refugees).
In the year ending June 2016, a total of 3,439 people were resettled in the UK through this process. Of these, 2,682 were also granted humanitarian protection under the Syrian Vulnerable Persons Resettlement Scheme (VPRS). In the year ending June 2016, 49% (1,308) of those resettled under the Syrian VPRS were under 18 years old, and 49% (1,307) were female.
On 7 September 2015, an expansion to the existing Syrian VPRS was announced. Through this expansion, it is proposed that 20,000 Syrians in need of protection will be resettled in the UK by 2020. A total of 2,898 people have been granted humanitarian protection under the Syrian VPRS since the scheme began. Between the start of October 2015 and the end of June 2016, 2,646 people have been resettled under the Syrian VPRS across 118 different local authorities. These data are available in Asylum table as 20 q (volume 4 of the Asylum data tables).
On 21 April 2016, the government announced they will work with UNHCR to resettle children from the Middle East and North Africa region. The new scheme aims to support vulnerable and refugee children at risk and their families, with a view of resettling up to 3,000 individuals over the course of this parliament.
6. Unaccompanied asylum-seeking children
An unaccompanied asylum-seeking child (UASC) is a person under 18, or who, in the absence of documentary evidence establishing age, appears to be under that age, is applying for asylum in his or her own right and has no relative or guardian in the United Kingdom.
There were 3,472 asylum applications from UASC in the year ending June 2016, a 54% rise compared to the year ending June 2015 (2,252). Overall, UASC applications represented 10% of all main applications for asylum. Despite the recent increase in UASC applications, they remain below the peak of 4,060 in the year ending September 2008. The nationalities that lodged the highest numbers of UASC applications in the UK were Afghan (806), Eritrean (583) then Iranian (445). These three countries contributed to more than half (53%) of total UASC applications.
There were 2,084 initial decisions relating to a UASC in the year ending June 2016, 6% higher than the previous year (1,963). Of these, 74% were granted asylum or another form of protection, compared with 67% in the year ending June 2015. UASC applicants that are refused will include those from countries where it is safe to return children to their families, as well as some applicants who were determined to be over 18 following an age assessment.
7. International comparisons
Figures in this section are based on data supplied by the individual countries to the Intergovernmental Consultations on Migration, Asylum and Refugees (IGC), UNHCR and Eurostat. Not all countries provide the latest data in time for each Immigration Statistics release. Where a figure is unavailable for a given month, we estimate it using the average of the last three months available, unless the time series is erratic, when we use the average of the last 12 months.
Including dependants, the total number of asylum applications to the European Union in the year ending June 2016 was an estimated 1,493,000, an increase of 86% compared to the year ending June 2015 (801,000).
Top EU countries receiving asylum applications, year ending June 2016
(Total number of applications 1,493,000 including dependants; some estimated data)
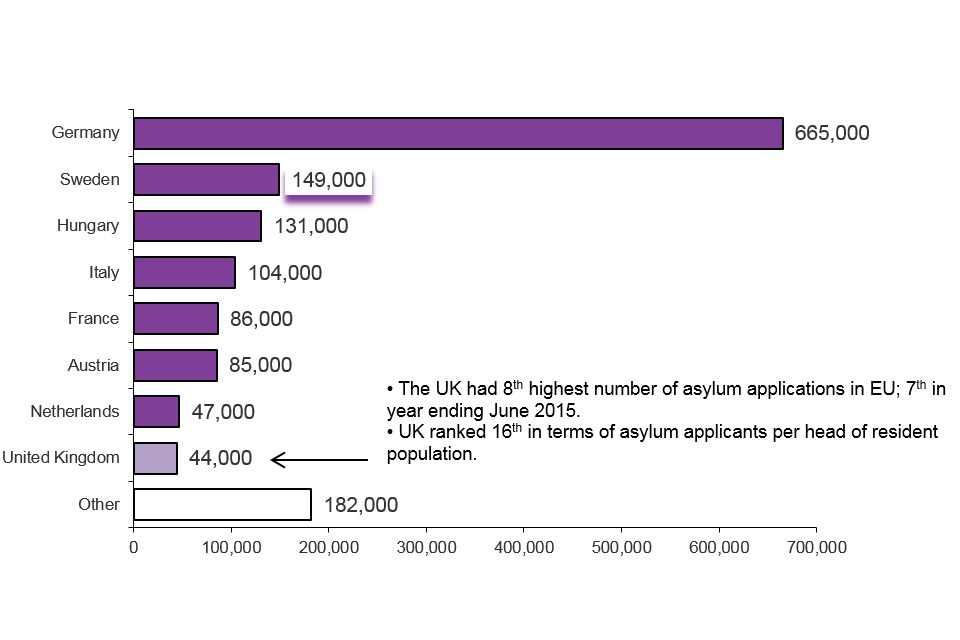
The chart shows the top EU countries receiving asylum applications in the year ending June 2016. UK had 8th highest; 7th last year. The data are available in Table as 07 q.
Chart notes
Source: Home Office, Immigration Statistics April to June 2016, Asylum table as 07 q.
1. Figures are rounded to the nearest 1,000 and so may not sum to the total.
2. The estimated figures in this chart are based on data supplied to IGC and UNHCR.
In the first quarter of 2016 (January to March), the latest provisional Eurostat data, Asylum quarterly report, show that the non-EU nationalities with the highest number of persons seeking asylum in the EU as a whole were Syrians, Iraqis and Afghans. The highest number of first-time asylum applications in January to March 2016 were registered in Germany (174,965 applications, or 61% of total applications in the EU), followed by Italy (22,335; 8%) and France (17,950; 6%). The UK received 10,065 first-time applications, or 4% of the EU total. Germany received 88,515 applications from Syrians, followed by Iraqis (25,550) and Afghans (19,750). These numbers exclude resettlement cases additionally accepted through the Syrian VPRS.
Between January and March 2016, the proportion of positive asylum decisions (for all non-EU nationalities) in Germany was 68% compared with 29% in France and 34% in Italy and the UK. The average grant rate for a particular member state will reflect the nationalities of the people applying for asylum in that country and their respective likelihood of those nationalities being accepted as refugees. When comparing figures for different EU member states, it is important to bear in mind there are differences in the collection and reporting methodologies, as well as how asylum applications are processed, which may influence the comparability of the figures.
In the EU as a whole, the nationality with the highest number of positive decisions was Syrian (95,235) with a grant rate of 99%, followed by Iraqi (9,665 or 73%) and Eritrean (8,920 or 94%). By contrast, only 390 (3%) applications from Albanian nationals were granted refugee status or an alternative form of protection at initial decision.
8. Outcome of asylum applications
The most recent data report on the initial decisions made on asylum applications by the Home Office. However, some decisions will be challenged at the HM Courts and Tribunals Service (HMCTS), an executive agency of the Ministry of Justice, which considers appeals against the asylum decisions made by the Home Office.
The Home Office produces an analysis of applications for whole year cohorts of asylum seekers, in order to calculate the overall success rates following appeal. For most years, this will provide the most complete description of the outcome for asylum seekers; however, for the most recent years some cases will still be outstanding, as not all cases will have had sufficient time to be completed. The analysis therefore only provides a ‘snapshot’ of the recorded outcomes of the group (or cohort) of asylum applicants in any one year, at a particular time. This dataset is updated, in full, annually and is currently available up to 2015.
8.1 Outcome of applications made between 2012 and 2014
The following chart gives an illustration of outcomes in the asylum system in the UK, for applications made in the years 2012 to 2014 (inclusive), where the outcome is known.
Indicative flows through the UK asylum system, where outcomes known, 2012 to 2014 data
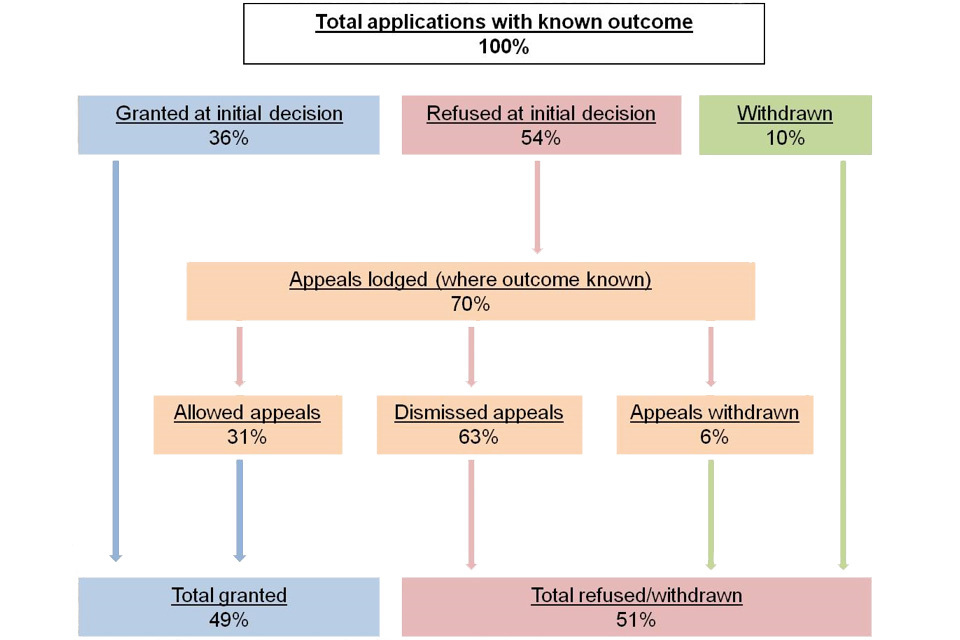
This flow chart shows indicative flows through the UK asylum system, where outcomes known, 2012 to 2014 data.
Chart notes
Source: Home Office, Immigration Statistics April to June 2016, Asylum Table as 06.
(1) Assumes all appeals lodged are as a result of a refused application. Latest data for 2012 to 2014 show 70% of all refusals resulted in an appeal being lodged.
(2) Figures are derived by combining data from the 2012, 2013 and 2014 cohort data from Table as 06.
(3) Cases where initial decision or appeal outcomes are unknown are not included in this analysis.
(4) Grant rates shown here relate to the outcomes of total applications made in each cohort year, and take withdrawn applications into account. They are therefore not directly comparable with the annual grant rates shown in the earlier table ‘Asylum applications and initial decisions for main applicants’, which gives grants as a percentage of total initial decisions made each year.
8.2 Currently recorded outcomes for 2015 applications
The outcomes for the 32,733 main applicants who applied for asylum in 2015, as with previous cohorts, will be updated in subsequent annual reports. However, as at May 2016, it is estimated that 10,319 (32%) main applicants were ultimately granted asylum, humanitarian protection or discretionary leave, either at initial decision or after appeal; 9,168 (28%) were refused or withdrawn; and two-fifths (40%; 13,246) were awaiting confirmation of an initial decision or appeal outcome.
Outcome of asylum applications, by year of application
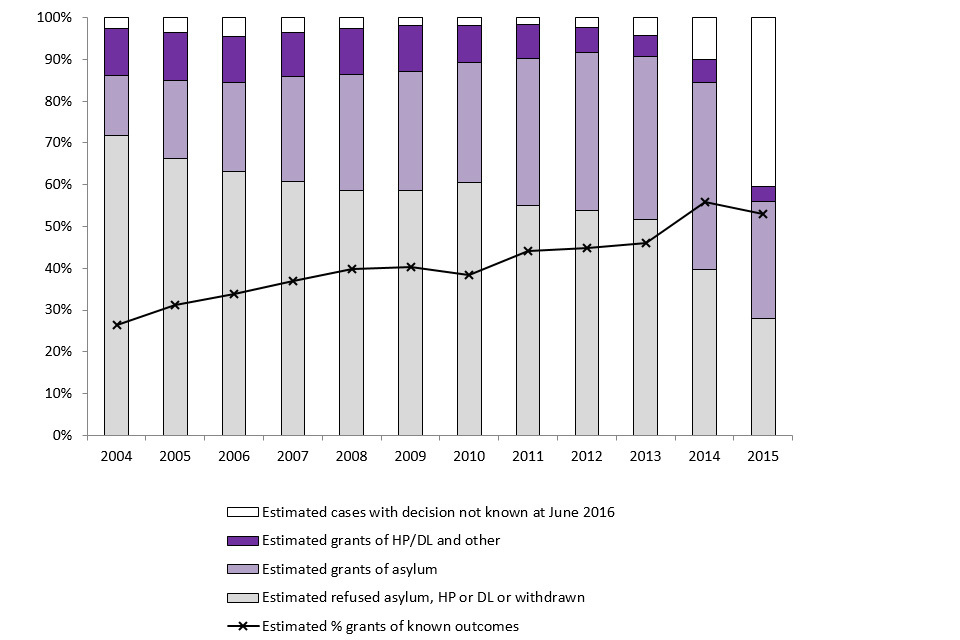
The chart shows the outcome of asylum applications made between 2004 and the latest calendar year as at May 2016. The data are available in Table as_06.
Chart notes
Source: Home Office, Immigration Statistics April to June 2016, Asylum able as 06.
(1) Chart shows the proportion of recorded outcomes of applications made in each year from 2004 to 2015, as at May 2016.
(2) Due to the large variety of routes that an asylum application can take to a final outcome, the analysis of the outcomes of asylum applications in any one year requires interpretation for a small percentage of cases. The proportions and underlying figures for final outcomes of the analysis of applications for the group (or cohort) of applicants in any one year, are therefore estimated.
(3) The proportion of applications awaiting the outcome of an initial decision or an appeal will inherently be lower in earlier years as there has been longer for the cases to be processed than those from more recent years.
The overall proportion of applications granted asylum or a form of temporary protection, either at initial decision or after having an appeal allowed, was estimated to be 26% in 2004; this proportion has steadily increased to 53% of applications made in 2015 (where the outcome is known), as shown in the above chart.
In addition, the outcome analysis also shows how the final grant rates vary by country of nationality. For example, of known outcomes for 2015 applicants, it is estimated that 87% of Syrians were granted asylum or another form of protection following initial decision and appeal, compared with 22% of Iraqi nationals.
The recorded outcomes of asylum applications made in 2016 are due to be published in August 2017.
9. Support provided to asylum seekers
At the end of June 2016, a total of 37,030 asylum seekers and their dependants were being supported in the UK under Section 95, compared with 30,457 at the end of June 2015. The majority (34,367) were supported in dispersed accommodation, with 94% located outside of London. An additional 2,663 were receiving subsistence-only support, with just over half (52%) of these located in London. Although the total figure has risen since 2012, it remains considerably below that for the end of 2003 (the start of the published data series), when there were 80,123 asylum seekers in receipt of Section 95 support.
Asylum seekers in receipt of Section 95 support, by local authority, per million population, as at the end of June 2016
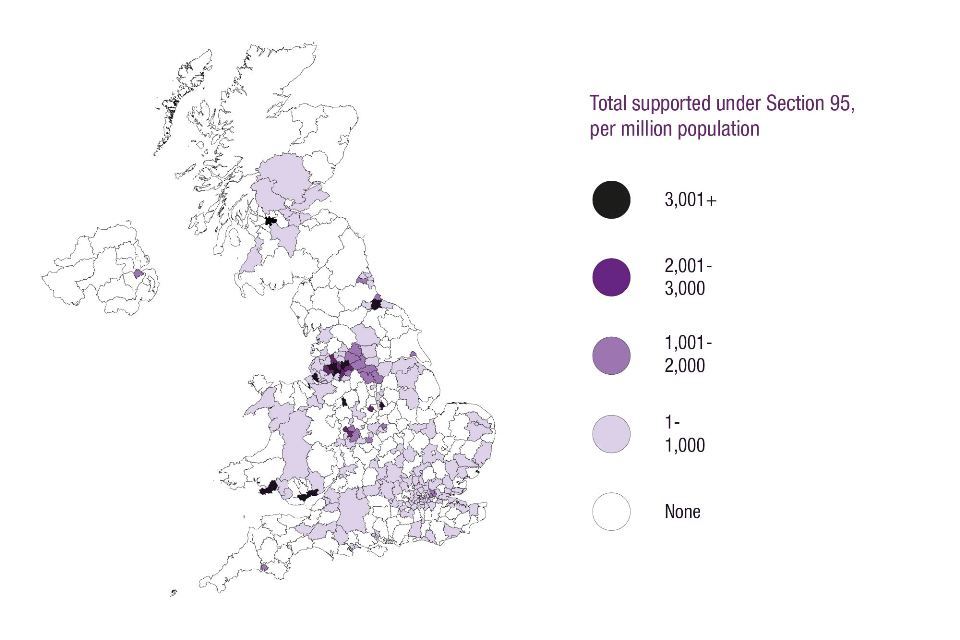
This map shows the number of asylum seekers in receipt of Section 95 support, by local authority, per million population, as at end of June 2016.
Chart notes
Source: Home Office, Immigration Statistics April to June 2016, Asylum table as 16 q; population figures sourced from the ONS 2015 mid-year population estimates, published 23 June 2016, except for N. Ireland figures − these are awaiting update and so were sourced from the 2014 mid-year population estimates, published 25 June 2015, Population Estimates for UK, England and Wales, Scotland and Northern Ireland.
The number of asylum seekers in receipt of Section 95 support by local authority, as at the end of each quarter, is available in Asylum table as 16 q (volume 4 of the Asylum data tables).
There were 3,732 failed asylum seekers and their dependants receiving support (under Section 4) at the end of June 2016. Failed asylum seekers (main applicants only) receiving support under Section 4 peaked at the end of September 2009 (12,019).
10. Applications pending
At the end of June 2016, 26,392 applications (received since April 2006) from main applicants were pending a decision (initial decision, appeal or further review), 22% more than at the end of June 2015 (21,604). The number pending an initial decision for more than six months increased by 84% (from 3,606 to 6,637) while those pending further review decreased by 35% to 6,031.
11. Asylum appeals
The HM Courts and Tribunals Service (HMCTS) received 12,471 asylum appeals from main applicants in the year ending June 2016, a 5% fall compared with the previous year (13,154).
Appeal determinations have increased from 7,769 in the year ending June 2015 to 9,512 in the year ending June 2016. These figures remain below the peaks in the number of appeals and the number of determinations in the year ending June 2010, which were 16,560 and 16,032 respectively. In the year ending June 2016, the proportion of determined appeals that were dismissed was 53%, while 43% of appeals were allowed and 4% were withdrawn.
12. Returns
In the year ending June 2016, there were 2,766 enforced returns of people who had previously sought asylum (including dependants), down 38% from the previous year (4,435). In the same period there were 1,542 voluntary returns (excluding returns from detention) of people who had sought asylum at some stage. Further information on returns can be found in the Returns topic and figures on asylum returns are available in Returns volumes 1 and Returns volume 3 of the Returns tables.
13. Age disputes
Some asylum applicants claim to be children but there may be doubts as to whether this is in fact the case. In the year ending June 2016, 1,060 asylum applicants had their age disputed and 933 were recorded as having an age assessment. Of those who completed age assessments in the year ending June 2016, 68% were assessed to be over 18, despite claiming to be a child when the age dispute was raised.
14. Dependants
Including dependants, the number of asylum applications increased by 34% from 33,111 in the year ending June 2015 to 44,323 in the year ending June 2016. This is an average of one dependant for every five main applicants. In the same period, 6,685 initial decisions were made relating to dependants. Of these, 1,702 (25%) were grants of asylum or an alternative form of protection, and 4,983 (75%) were refusals.
15. Data tables
Data referred to here can be found in the following tables:
Asylum vol. 1: tables as 01 to as 02
The following tables are included in this volume:
as 01 Asylum applications and initial decisions for main applicants, by country of nationality
as 01 q Asylum applications and initial decisions for main applicants, by country of nationality
as 02 Asylum applications and initial decisions for main applicants and dependants, by country of nationality
Asylum vol. 2: Tables as 02 q to as 06
The following tables are included in this volume:
as 02 q Asylum applications and initial decisions for main applicants and dependants, by country of nationality
as 03 Asylum applications from main applicants, by age, sex and country of nationality
as 04 Asylum applications from main applicants and dependants, by age, sex and country of nationality
as 05 Asylum initial decisions from main applicants, by sex and country of nationality
as 06 Outcome analysis of asylum applications, as at May 2016
Asylum vol. 3: Tables as 07 to as 13 q
The following tables are included in this volume:
as 07 Asylum applications received in Europe and elsewhere for main applicants and dependants
as 07 q Asylum applications received in Europe and elsewhere for main applicants and dependants
as 08 Asylum applications received from unaccompanied asylum-seeking children, excluding dependants, by sex and age at time of application
as 08 q Asylum applications received from unaccompanied asylum-seeking children, excluding dependants, by sex and age at time of application
as 09 Initial decisions on asylum applications from unaccompanied asylum-seeking children, excluding dependants, by sex and age at initial decision
as 09 q Initial decisions on asylum applications from unaccompanied asylum-seeking children, excluding dependants, by sex and age at initial decision
as 10 Age disputes raised and resolved for asylum applicants, by country of nationality
as 10 q Age disputes raised and resolved for asylum applicants, by country of nationality
as 11 Asylum main applicants accepted onto the fast-track process, by country of nationality
as 12 Outcomes of asylum main applicants accepted onto the fast-track process
as 13 q Main applicants refused asylum and eligible for the non-suspensive appeals process, by country of nationality
Asylum vol. 4: Tables as 14 to as 20 q
The following tables are included in this volume:
as 14 Asylum appeal applications and determinations, by country of nationality and sex
as 14 q Asylum appeal applications and determinations, by country of nationality
as 15 Applications for asylum support, by support type and nationality
as 16 q Asylum seekers in receipt of Section 95 support, by local authority, as at end of quarter
as 17 q Asylum seekers in receipt of Section 95 support, by country of nationality and UK region, as at end of quarter
as 18 q Asylum seekers in receipt of Section 4 or Section 98 support, and decisions to grant Section 4 support
as 19 q Refugees (and others) resettled, including dependants
as 20 q Refugees (and others) resettled under the Syrian Vulnerable Persons Resettlement scheme, including dependants, by local authority
16. Background Information
This section covers asylum applications, initial decisions, estimated final outcomes, resettlement, unaccompanied asylum-seeking children (UASC), international comparisons, support, appeals, returns and age disputes.
16.1 Migration Transparency Data webpage
A range of key input and impact indicators are currently published by the Home Office on the Migration transparency data webpage.