Settlement
Published 27 August 2015

© Crown copyright 2015
This publication is licensed under the terms of the Open Government Licence v3.0 except where otherwise stated. To view this licence, visit nationalarchives.gov.uk/doc/open-government-licence/version/3 or write to the Information Policy Team, The National Archives, Kew, London TW9 4DU, or email: psi@nationalarchives.gov.uk.
Where we have identified any third party copyright information you will need to obtain permission from the copyright holders concerned.
This publication is available at https://www.gov.uk/government/statistics/immigration-statistics-april-to-june-2015/settlement
Valid: 27 August 2015 to 25 November 2015
Back to ‘Immigration statistics April to June 2015’ content page.
This is not the latest release. View latest release.
The figures in this section relate to the number of people, subject to immigration control, who are granted or refused permission to stay permanently in the UK, known as settlement.
The numbers of applications and decisions about permission to stay permanently reflect changes over time in levels of those entering the country, as well as policy and legislative changes. These may affect the number of people potentially eligible to stay permanently. The availability and allocation of resources within the Home Office can also affect the number of decisions.
All data below relate to the year ending June 2015 and all comparisons are with the year ending June 2014, unless indicated otherwise.
1. Key facts
The number of people granted permission to stay permanently fell by12% (-14,405) to 104,690 in the year ending June 2015. The number of grants is low relative to the peak number of grants in the year ending September 2010 (241,586), and similar to levels seen in 2001 (108,410). The decrease was largely accounted for by falls in family (-13,629), and work-related (-7,505) grants.
There were 40,954 work-related grants to stay permanently in the year ending June 2015, 15% (-7,505) lower than in the year ending June 2014 (48,459). The decrease partly reflects a decrease in work-related arrivals 5 years earlier. Settlement granted after 5 years with a work permit decreased from 8,128 to 854, reflecting the replacement of the work permit scheme by the Points-Based System. Grants to Tier 1 High Value individuals fell from 24,257 to 20,445 whilst grants in the Tier 2 Skilled Work category rose from 10,125 to 15,551.
Family-related grants to stay permanently fell by a third (-33%) to 27,599 continuing the overall downward trend since the year ending June 2010 (73,830). There were notable decreases in grants to wives (from 23,073 to 15,863), husbands (from 11,333 to 8,129) and children (from 5,796 to 3,283). This may partly reflect changes to the rules in July 2012 on how quickly partners qualify for settlement as well as changing levels for entry clearance visas and of extensions in previous years. Details of the July 2012 rule changes are included in the Family section of the user guide.
Asylum-related grants to stay permanently rose 40% to 20,665 in the year ending June 2015, a similar level to the year ending June 2013 (20,860) but significantly lower than the peak in 2005 (67,810).
Grants to stay permanently for other reasons increased by 6% (+870) to 15,472.
Grants to stay permanently by reason, and refusals
| Year | Total decisions | Total grants | Work | Asylum | Family | Other (1) | Refusals |
|---|---|---|---|---|---|---|---|
| Year ending June 2011 | 220,047 | 209,761 | 69,563 | 9,636 | 58,822 | 71,740 | 10,286 |
| Year ending June 2012 | 146,401 | 140,911 | 68,967 | 12,494 | 48,310 | 11,140 | 5,490 |
| Year ending June 2013 | 159,131 | 154,174 | 60,994 | 20,860 | 60,286 | 12,034 | 4,957 |
| Year ending June 2014 | 125,704 | 119,095 | 48,459 | 14,806 | 41,228 | 14,602 | 6,609 |
| Year ending June 2015 | 109,319 | 104,690 | 40,954 | 20,665 | 27,599 | 15,472 | 4,629 |
| Change: latest 12 months | -16,385 | -14,405 | -7,505 | +5,859 | -13,629 | +870 | -1,980 |
| Percentage change | -13% | -12% | -15% | +40% | -33% | +6% | -30% |
Table notes
Source: Home Office, Immigration Statistics April to June 2015, Settlement table se 02 q.
(1) The high number of grants in 2011 mainly resulted from a review of the backlog of cases from before March 2007 involving unsuccessful asylum applicants.
2. Long-term trends in grants to stay permanently
The chart below illustrates longer-term trends in grants to stay permanently for the calendar years back to 2004.
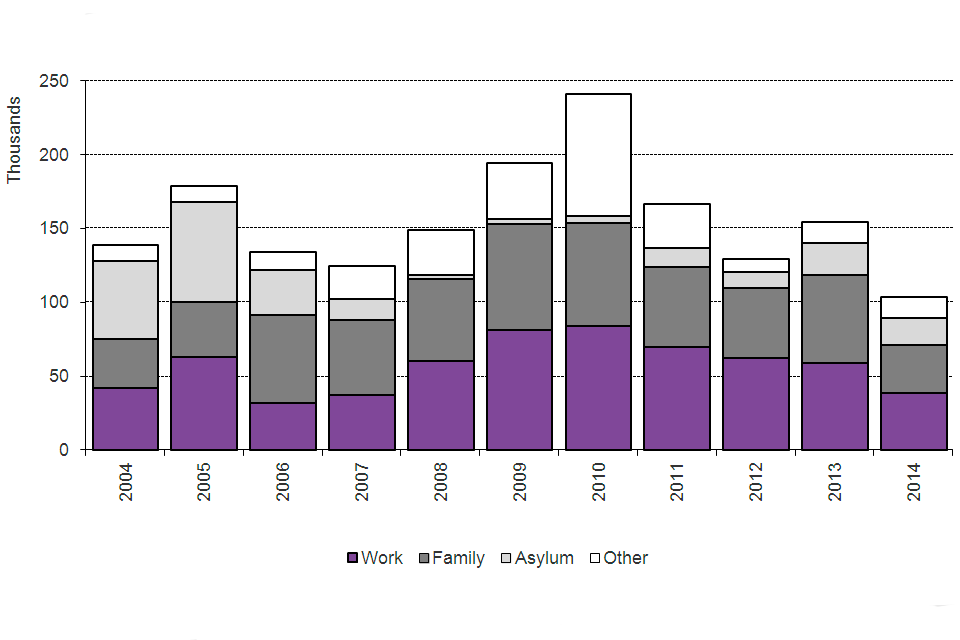
The chart shows the number of people granted settlement by calendar year from 2004. The data are available in Table se 02.
Chart notes
Source: Home Office, Immigration Statistics April to June 2015, Settlement table se 02.
The increase in total numbers of people granted permission to stay permanently from 2004 to 2005 was mainly due to increases in work- and asylum-related grants, which then fell in 2006 and 2007. This reflects changes to rules on how quickly those with refugee status or humanitarian protection were granted settlement and how quickly individuals qualified for work-related settlement. The higher total levels in 2009 and 2010 were due in part to grants given on a discretionary or other basis resulting from a review of the backlog of cases involving unsuccessful asylum applicants, and the falls in 2011 and 2012 follow the completion of the review.
3. Nationalities granted permission to stay permanently
Of the total 104,057 grants of permission to stay permanently in 2014, over a third (37% or 38,820) were to nationals of South Asia and over a quarter (27% or 28,240) were to nationals of Sub-Saharan Africa.
Top 5 nationalities granted permission to stay permanently, 2014
(Total 104,057)
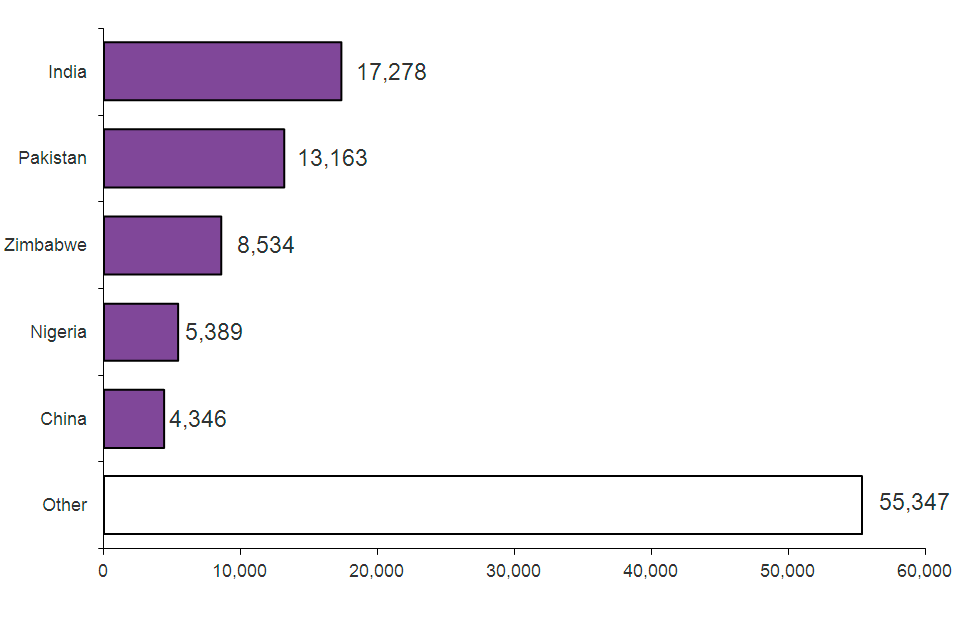
The chart shows grants of settlement by nationality in 2014. The chart is based on data in Table se 03.
Chart notes
Source: Home Office, Immigration Statistics April to June 2015, Settlement table se 03.
The top 5 nationalities accounted for nearly half (47%) of total grants in 2014. The composition of the top 5nationalities has changed in the last year. Zimbabwe nationals are now third, but were eighth in 2013.
4. Data tables
Further data on settlement are available in Settlement tables se 01 to se 06.