United Kingdom egg statistics: Quarter 1 2022
Updated 27 April 2023

© Crown copyright 2023
This publication is licensed under the terms of the Open Government Licence v3.0 except where otherwise stated. To view this licence, visit nationalarchives.gov.uk/doc/open-government-licence/version/3 or write to the Information Policy Team, The National Archives, Kew, London TW9 4DU, or email: psi@nationalarchives.gov.uk.
Where we have identified any third party copyright information you will need to obtain permission from the copyright holders concerned.
This publication is available at https://www.gov.uk/government/statistics/historical-statistic-notices-on-uk-egg-production-and-prices-2022/united-kingdom-egg-statistics-quarter-1-2022
All eggs from free range and organic flocks have been re-labelled as barn eggs since 21st March due to avian influenza restrictions.
This release shows quarterly information on the numbers of eggs packed in UK packing stations. This covers the vast majority of total eggs produced. It shows usage and farm-gate egg prices and includes monthly information on the trade in eggs and egg products.
1. Key messages
- 7.6 million cases of eggs were packed in UK egg packing stations during the first quarter of 2022. This represents 3.2% decrease on the first quarter in 2021 and a 1.3% decrease on quarter four 2021.
- The average UK farm-gate egg price through the first quarter of 2022 was 83.9 pence per dozen, this represents a 3.6% decrease on quarter one of 2021 and a 4.3% decrease on quarter four 2021.
- The production of egg products during the first quarter of 2022 totalled 18.0 thousand tonnes, a 4.0% decrease on the previous quarter and a 0.5% decrease on the first quarter 2021.
2. UK egg packing volumes, methods of production, UK country breakdowns and price statistics
The tables in this section show quarterly information on the volumes of eggs passed through the UK egg packing stations. These eggs generally account for nearly 90% of total egg production. Packing station figures include throughput of both graded and ungraded eggs.
- The number of eggs which passed through the packing stations in Q1 2022 decreased 3.2% on the same quarter in 2021.
- Egg prices decreased to 83.9p per dozen, a 4.3% fall on Q4 2021 price; 3.6% lower than Q4 2020.
Figure 1: The number of eggs packed in UK packing stations compared to the UK farm-gate egg price: 2001-2020
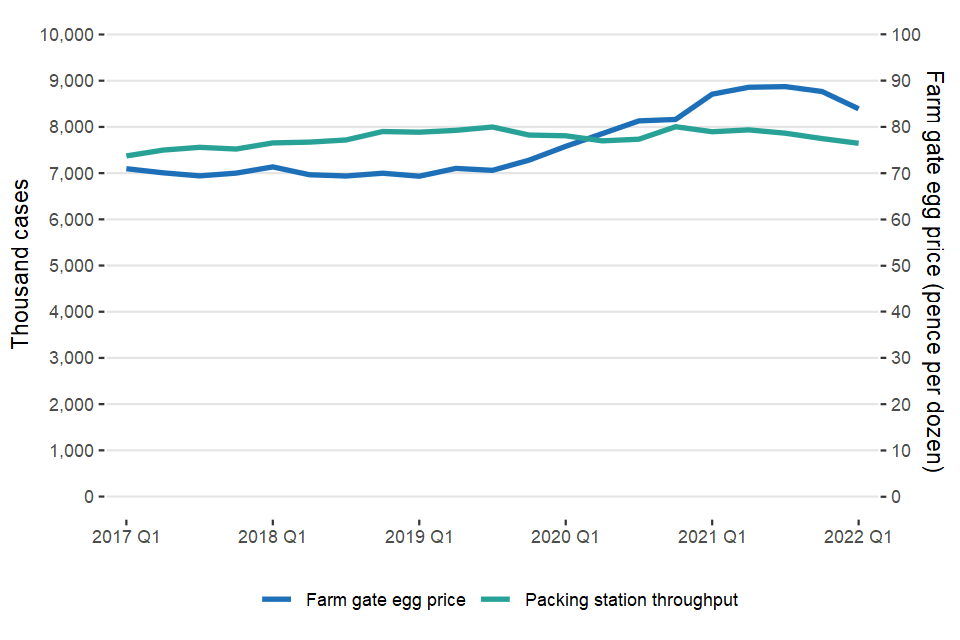
The number of eggs packed in UK packing stations compared to the UK farm-gate egg price: 2017-2022
Table 1: UK Packing Station egg throughput by country (Thousand cases)
| Period | E&W | Scot | NI | UK | % change on previous year |
|---|---|---|---|---|---|
| 2020 Q1 | 5,615 | 976 | 1,217 | 7,808 | -1.0% |
| Q2 | 5,439 | 1,086 | 1,174 | 7,698 | -2.9% |
| Q3 | 5,340 | 1,093 | 1,302 | 7,734 | -3.3% |
| Q4 | 5,435 | 1,164 | 1,405 | 8,004 | 2.3% |
| All 2020 | 21,829 | 4,318 | 5,097 | 31,245 | -1.2% |
| 2021 Q1 | 5,582 | 982 | 1,331 | 7,896 | -1.4% |
| Q2 | 5,535 | 995 | 1,406 | 7,936 | 3.1% |
| Q3 | 5,379 | 1,065 | 1,419 | 7,864 | 1.7% |
| Q4 | 5,216 | 1,024 | 1,508 | 7,748 | -3.2% |
| All 2021 | 21,713 | 4,066 | 5,664 | 31,443 | 0.6% |
| 2022 Q1 | 5,201 | 1,121 | 1,324 | 7,646 | -3.2% |
Table 2: UK Packing Station egg throughput by egg production type (Thousand cases)
| Period | Enriched cage | Barn | Free Range | Organic | Total |
|---|---|---|---|---|---|
| 2020 Q1 | 3,326 | 197 | 4,032 | 254 | 7,808 |
| Q2 | 3,197 | 229 | 3,996 | 277 | 7,698 |
| Q3 | 2,993 | 174 | 4,282 | 285 | 7,734 |
| Q4 | 3,111 | 171 | 4,448 | 274 | 8,004 |
| All 2020 | 12,627 | 771 | 16,757 | 1,090 | 31,245 |
| 2021 Q1 | 2,986 | 114 | 4,504 | 292 | 7,896 |
| Q2 | 2,883 | 130 | 4,616 | 306 | 7,936 |
| Q3 | 2,703 | 146 | 4,715 | 299 | 7,864 |
| Q4 | 2,564 | 174 | 4,706 | 303 | 7,748 |
| All 2021 | 11,136 | 565 | 18,541 | 1,200 | 31,443 |
| 2022 Q1 | 2,413 | 596 | 4,338 | 299 | 7,646 |
All eggs from free range and organic flocks have been re-labelled as barn eggs since 21st March due to avian influenza restrictions.
Eggs produced from hens in enriched colony systems accounted for 32% of the total throughput in Q1 2022. Free range eggs accounted for 57% of Q1 2022 throughput.
Figure 2: UK egg throughput by production method
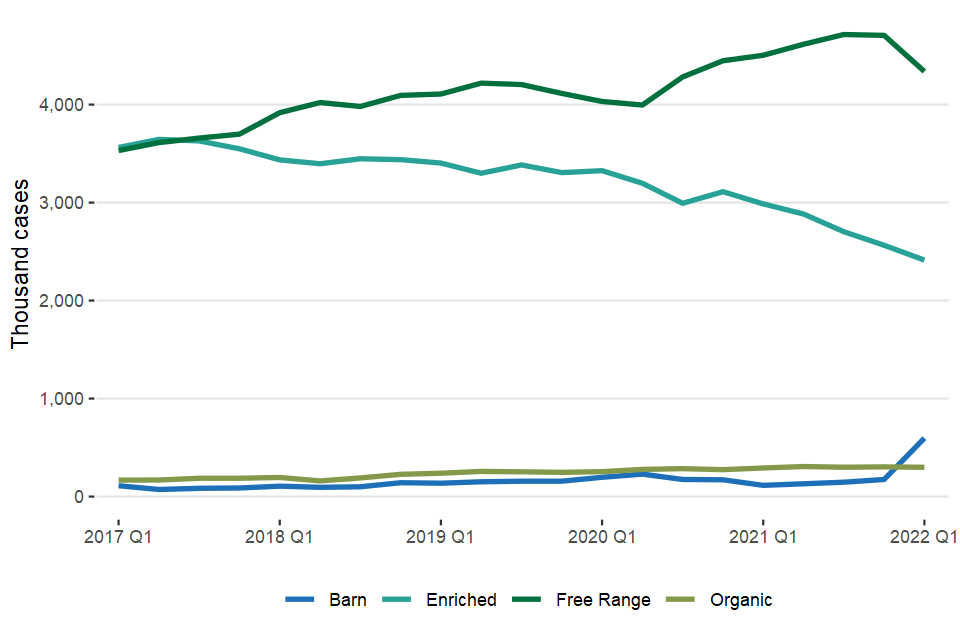
UK egg throughput by production method
Table 3: Average UK farm-gate egg price (Pence per dozen)
| Period | Enriched cage | Barn | Free Range | Organic | All Eggs | % change on previous year |
|---|---|---|---|---|---|---|
| 2020 Q1 | 56 | c | 87 | c | 76 | 9.3% |
| Q2 | 57 | c | 90 | c | 79 | 11% |
| Q3 | 59 | c | 92 | c | 81 | 15% |
| Q4 | 59 | c | 92 | c | 82 | 12% |
| All 2020 | 58 | c | 90 | c | 79 | 12% |
| 2021 Q1 | 63 | c | 98 | c | 87 | 15% |
| Q2 | 64 | c | 99 | c | 89 | 13% |
| Q3 | 64 | c | 98 | c | 89 | 9.1% |
| Q4 | 63 | c | 96 | c | 88 | 7.4% |
| All 2021 | 64 | c | 98 | c | 88 | 11% |
| 2022 Q1 | 58 | c | 94 | c | 84 | -3.6% |
‘c’ confidential
3. UK egg processing statistics
The number of eggs bought by UK egg processors in Q1 2022 totalled 936 thousand cases (equating to 20.6 thousand tonnes), an increase of 12% on the same period in 2021. Liquid egg accounted for 70% of the total production in Q1 2022. Total production was down 0.5% in Q1 2022 compared to the same quarter last year.
Table 4: Number of eggs bought by UK Egg Processors
| Period | Thousand cases | Tonnes | % change year on year |
|---|---|---|---|
| 2020 Q1 | 1,062 | 23,356 | 5.4% |
| Q2 | 789 | 17,356 | -25% |
| Q3 | 915 | 20,140 | -14% |
| Q4 | 876 | 19,273 | -21% |
| All 2020 | 3,642 | 80,125 | -14% |
| 2021 Q1 | 833 | 18,337 | -21% |
| Q2 | 1,064 | 23,416 | 35% |
| Q3 | 1,056 | 23,225 | 15% |
| Q4 | 1,014 | 22,312 | 16% |
| All 2021 | 3,968 | 87,290 | 8.9% |
| 2022 Q1 | 936 | 20,601 | 12% |
Table 5: Production of egg products by UK Egg Processors
| Period | Liquid Egg | Hard Boiled & Other Products (a) | Total | % change year on year |
|---|---|---|---|---|
| 2020 Q1 | 14,902 | 7,168 | 22,070 | 4.4% |
| Q2 | 11,294 | 5,709 | 17,003 | -24% |
| Q3 | 12,277 | 5,824 | 18,101 | -25% |
| Q4 | 12,859 | 5,623 | 18,482 | -21% |
| All 2020 | 51,332 | 24,325 | 75,657 | -17% |
| 2021 Q1 | 12,349 | 5,774 | 18,123 | -18% |
| Q2 | 15,529 | 5,810 | 21,339 | 25% |
| Q3 | 14,102 | 6,121 | 20,223 | 12% |
| Q4 | 13,233 | 5,545 | 18,778 | 1.6% |
| All 2021 | 55,213 | 23,250 | 78,463 | 3.7% |
| 2022 Q1 | 12,539 | 5,495 | 18,034 | -0.5% |
(a) Separate data for Hard Boiled Eggs and Other Products is currently unavailable to avoid disclosure of confidential information.
Figure 3: Intake and Production of Egg Products by UK Egg Processors
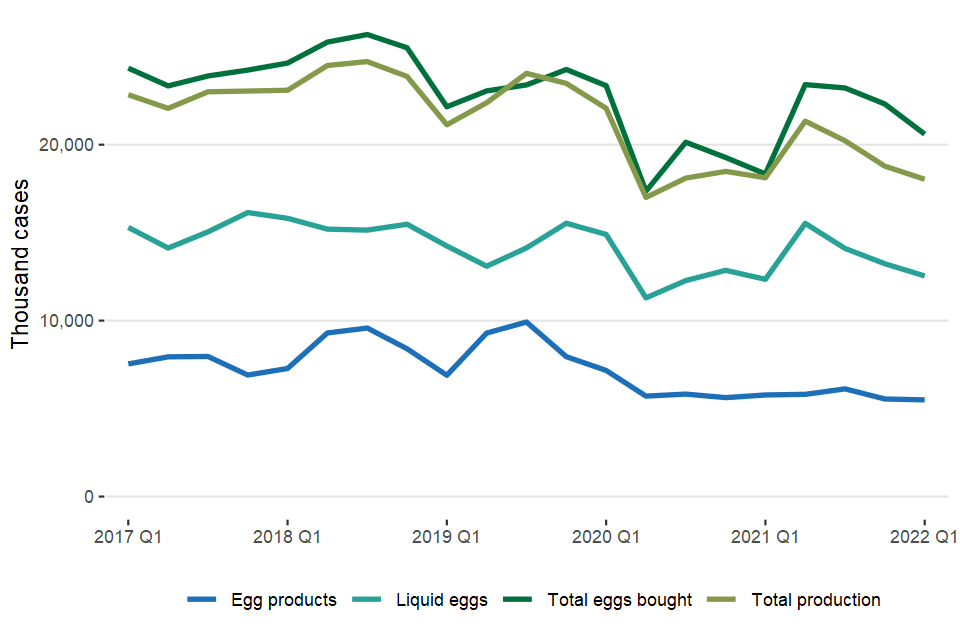
Intake and Production of Egg Products by UK Egg Processors
The volume of eggs processed also includes any processing carried out for external customers who supply their own eggs. This can cause the overall volume of eggs processed to be higher than the volume of eggs purchased, as in the statistics for Q3 2019.
4. UK Egg Trade
Trade figures are supplied by HM Revenue and Customs. Trade data marked as provisional may be subject to revision.
- The latest data for February 2022 shows imports of shell eggs at 62,000 cases, a 20% decrease on the same period last year. Imports of egg products are up 48% at 257,000 cases compared to February 2021.
- Shell egg export figures for February 2022 are 48,000 cases, down 19% compared to the same period in 2021, whilst egg product exports were 10,000 cases, down 68% compared to February 2021.
Table 6 UK Trade in Shell Eggs (Thousand cases) – Imports
| 2020 | 2021 | 2022 | % change 20/21 | 12 Month Moving Totals | |
|---|---|---|---|---|---|
| January | 198 | 77 | 62 | -20% | 1,145 |
| February | 70 | 53 | 109 | 104% | 1,201 |
| March | 105 | 73 | |||
| April | 141 | 52 | |||
| May | 187 | 58 | |||
| June | 99 | 140 | |||
| July | 75 | 66 | |||
| August | 43 | 79 | |||
| September | 78 | 297 | |||
| October | 86 | 99 | |||
| November | 64 | 83 | |||
| December | 67 | 83 | |||
| Total | 1,214 | 1,160 |
All trade data are provisional
Table 7 UK Trade in Shell Eggs (Thousand cases) – Exports
| 2020 | 2021 | 2022 | % change 20/21 | 12 Month Moving Totals | |
|---|---|---|---|---|---|
| January | 72 | 24 | 44 | 82% | 743 |
| February | 32 | 40 | 48 | 19% | 750 |
| March | 42 | 40 | |||
| April | 73 | 52 | |||
| May | 63 | 70 | |||
| June | 47 | 103 | |||
| July | 51 | 75 | |||
| August | 49 | 72 | |||
| September | 48 | 66 | |||
| October | 51 | 62 | |||
| November | 37 | 59 | |||
| December | 41 | 60 | |||
| Total | 607 | 723 |
Table 8 UK Trade in Egg Products (a) (Thousand cases) – Imports
| 2020 | 2021 | 2022 | % change 20/21 | 12 Month Moving Totals | |
|---|---|---|---|---|---|
| January | 311 | 173 | 258 | 49% | 2,898 |
| February | 459 | 174 | 257 | 48% | 2,980 |
| March | 267 | 263 | |||
| April | 204 | 205 | |||
| May | 222 | 218 | |||
| June | 285 | 262 | |||
| July | 269 | 236 | |||
| August | 248 | 243 | |||
| September | 302 | 282 | |||
| October | 360 | 264 | |||
| November | 429 | 275 | |||
| December | 393 | 218 | |||
| Total | 3,750 | 2,812 |
(a) Figures are based on SITCs: 025.21, 025.22 and 025.30, converted to shell egg equivalent.
All trade data are provisional
Table 9 UK Trade in Egg Products (a) (Thousand cases) – Exports
| 2020 | 2021 | 2022 | % change 20/21 | 12 Month Moving Totals | |
|---|---|---|---|---|---|
| January | 40 | 24 | 38 | 59% | 462 |
| February | 24 | 32 | 10 | -68% | 849 |
| March | 25 | 42 | |||
| April | 22 | 25 | |||
| May | 26 | 40 | |||
| June | 30 | 41 | |||
| July | 18 | 42 | |||
| August | 19 | 38 | |||
| September | 19 | 39 | |||
| October | 16 | 58 | |||
| November | 18 | 21 | |||
| December | 21 | 45 | |||
| Total | 277 | 448 |
(a) Figures are based on SITCs: 025.21, 025.22 and 025.30, converted to shell egg equivalent.
All trade data are provisional
5. About these statistics
5.1 Methodology
Egg Packing Statistics: The number of commercial laying hens is estimated based on the Defra Hatchery Survey layer chick placings. Total egg throughput is modelled using the number of commercial laying hens, average egg yields, average mortality rates and the proportion of UK eggs that go through packing stations. To estimate further breakdowns from this total output, Defra runs a quarterly survey of registered UK egg packing stations. It collects data on egg production methods (i.e. free range, enriched cages etc.), country of packing and prices. This “Egg Packers survey” is a voluntary survey of 27 packing stations across the UK, which accounts for around 75% of eggs packed in the UK. The response rate is typically 100 per cent.
The prices obtained on the survey are weighted according to the volume of eggs packed by each packing station to obtained average prices for the UK. From 2012, prices include any bonus payments paid to producers.
Egg processing statistics: Defra runs a quarterly survey of all registered egg processors. It is a voluntary survey of 11 respondents that collects information on the number of eggs bought by egg processors and the quantity of egg products produced. The response rate is typically 100 per cent.
In tables that show numbers of eggs the units used are ‘thousand cases’. There are 360 eggs in one case.
Trade statistics: These figures come from HM Revenue and Customs, but are validated and adjusted if necessary prior to publication. The Standard Industrial Trade Classification codes used to produce each table are given in the footnotes below the tables.
The data are subject to a variety of validation checks which identify inconsistencies in the data. All data are cleaned prior to publication. The percentage changes shown are calculated using unrounded figures. Thus any percentage changes calculated using the published (rounded) figures may not equate exactly with the changes shown.
The UK 12 month moving totals represent the sum of the 12 months up to and including the date indicated. They can be seen as a trend measure that is not affected by seasonality.
Contact details are available on the front page of this notice, for you to send feedback or ask questions about the information provided.
5.2 Revisions Policy
Figures in this notice are provisional and subject to revision. We will provide information about any revisions we make to previously published information in this statistics notice, and the associated datasets. Revisions could occur for various reasons, including:
- if we have not received survey data from respondents we make an estimate based on their previous returns. These estimates will be replaced with actual survey data when it is received.
- survey respondents occasionally supply amended figures for previous periods.
5.3 Data users
Representatives of the egg and poultry industry are also major users of the data. The data on egg production volumes and egg type are key sector indicators for the British Egg Industry Council (BEIC) as they reflect the size of the national laying flock. The British Free Range Egg Producers Association also makes heavy use of our data as it indicates the size of the free range sector. We work closely with these users and consult widely when considering any changes to our surveys or associated datasets.
The Agricultural and Horticultural Development Board (AHDB – cereals and oilseeds), rely on egg production data as a good indicator of the commercial layer flock and associated feed demand and hence grain usage by the sector.
Our statistics are also often heavily referenced in industry publications such as “Poultry World” and “The Ranger”, the official magazine of the British Free Range Egg Producers Association.
5.4 Future publications
This quarterly release will be next updated at 09:30 on 28th July 2022. Full time series are available for download at: https://www.gov.uk/government/statistics/egg-statistics.
6. National Statistics status
National Statistics are produced to high professional standards. They undergo regular quality assurance reviews to ensure that they meet customer needs. They are produced free from any political interference.
The continued designation of these statistics as National Statistics was confirmed in 2014 following a compliance check by the UK Statistics Authority (now the Office for Statistics Regulation) against the Code of Practice for Statistics.
Since the latest review by the Office for Statistics Regulation, we have continued to comply with the Code of Practice for Statistics and have enhanced data quality by reviewing methodologies and data sources.
For general enquiries about National Statistics, contact the National Statistics Public Enquiry Service: Tel: 0845 601 3034 Email: info@statistics.gov.uk.
You can find National Statistics on the internet at www.statistics.gov.uk/
Contact details
Livestock statistics team
Email: livestock.statistics@defra.gov.uk
Public enquiries: +44 (0) 2080 266306