Football-related arrests and banning order statistics, England and Wales, 2016 to 2017 season
Published 23 November 2017
Applies to England and Wales

© Crown copyright 2017
This publication is licensed under the terms of the Open Government Licence v3.0 except where otherwise stated. To view this licence, visit nationalarchives.gov.uk/doc/open-government-licence/version/3 or write to the Information Policy Team, The National Archives, Kew, London TW9 4DU, or email: psi@nationalarchives.gov.uk.
Where we have identified any third party copyright information you will need to obtain permission from the copyright holders concerned.
This publication is available at https://www.gov.uk/government/statistics/football-related-arrests-and-banning-orders-england-and-wales-season-2016-to-2017/football-related-arrests-and-banning-order-statistics-england-and-wales-2016-to-2017-season
1. Introduction
This release provides statistics on football-related arrests and banning orders in connection with regulated international and domestic football matches[footnote 1] involving English and Welsh clubs and the national teams.
Football-related arrests are those to which Schedule 1 of the Football Spectators Act 1989[footnote 2] (as amended) applies, reported by police to the Home Office United Kingdom Football Policing Unit (UKFPU). This includes football-specific offences (such as pitch incursion and throwing missiles inside a stadium) and a range of generic criminal offences committed in connection with a football match (at any place within a period of 24 hours either side of a match).
Since the 2012 to 2013 football season, information on football-related arrests by the British Transport Police (BTP) have been included in the accompanying data tables, ‘Football-related arrests and banning order statistics, England and Wales: data tables’. Previously they were published separately by BTP. As a result caution should be taken when comparing football-related arrests prior to the 2012 to 2013 season.
Football banning orders are preventative measures issued by the courts either following a conviction for a football-related offence[footnote 3], or following complaint by a local police force, BTP, or the Crown Prosecution Service (CPS)[footnote 4].
Caution should be taken when making season-on-season comparisons with regards to statistics on new banning orders, as the time period covering each data extraction varied from year to year:
- 2011 to 2012 (data reference dates: 30 November 2011 to 09 November 2012)
- 2012 to 2013 (data reference dates: 10 November 2012 to 20 September 2013)
- 2013 to 2014 (data reference dates: 21 September 2013 to 03 September 2014)
- 2014 to 2015 (data reference dates: 04 September 2014 to 08 September 2015)
- 2015 to 2016 (data reference dates: 31 July 2015 to 01 August 2016)[footnote 5]
- 2016 to 2017 (data reference dates: 01 August 2016 to 31 July 2017)
The statistics in this release are based on information provided by UKFPU. The statistics on football-related arrests are submitted by the 43 police forces in England and Wales and BTP, whilst information on banning orders was taken from the Football Banning Order Authority’s (FBOA, part of UKFPU) records[footnote 6].
Statistics on football-related arrests cover the 2016 to 2017 season (1 July 2016 to 30 June 2017, with the exception of any Euro 2016 matches) and are presented by competition, club, offence type, location and arrest rate per 100,000 attendees.
Information on the total number of football banning orders in force is reported as at 7 August 2017 (data reference dates for new banning orders issued in the 2016 to 2017 season was 1 August 2016 to 31 July 2017). Banning orders are presented by competition, club and trends over the last 7 seasons.
The user guide provides additional information on the coverage of the data, quality and methodology, and information on the conventions used in the statistics, legislation and regulations.
The ‘Football-related arrests and banning order statistics, England and Wales, 2016 to 2017 season’ data tables provide supplementary data to those presented in this release.
2. Headline figures
2.1 Football banning orders
Based on information as at 7 August 2017:
- there were 1,929 football banning orders in force, a decrease of 7% (-156) from the number of banning orders as at 1 August 2016
- there has been a steady decline in the total number of football banning orders in the last 6 seasons, falling by 39% (-1,245) from 3,174 on 29 November 2011
- the number of new banning orders issued between 1 August 2016 to 31 July 2017 was 517, a 5% decrease of 25 banning orders when compared with the previous season
2.2 Football-related arrests
Based on information for the 2016 to 2017 season:
- there were 1,638 football-related arrests, a 14% decrease of 257 on the previous season
- of the 1,638 football-related arrests, the 3 most common offence types were public disorder (31%), violent disorder (21%) and alcohol offences (16%)
- there were 4.0 football-related arrests per 100,000 attendees[footnote 7]
3. Football banning orders
The statutory duration of a football banning order is a minimum period of 3 years and no more than 5 years. In cases where a custodial sentence was imposed for the original offence a minimum period of 6 years and no more than 10 years applies.
3.1 Football banning orders by club supported
Figure 1 shows that there were 1,929 football banning orders in force as at 7 August 2017, representing a decrease of 7% from 2,085 as at 1 August 2016. This continues the downward trend seen in the number of football banning orders in the last 6 seasons, falling by 39% from 3,174 on 29 November 2011.
Supporters of Championship clubs accounted for the largest proportion of banning orders, 32% (620) of the total. Supporters of Premier League clubs were the second largest, accounting for 26% (507) of the total.
The largest numeric decrease in football banning orders was seen by supporters of Premier League clubs, falling by 110 (-18%) when compared to last season. However, supporters of National League (National Division) clubs saw the largest proportional decrease of 36% (-50). Caution should be taken when comparing season-on-season changes by leagues as the composition of the leagues and divisions change every season following the promotion and relegation of teams.
Figure 1: Number of football banning orders in force in England and Wales by club supported, from 2010 to 2011 season to 2016 to 2017 season
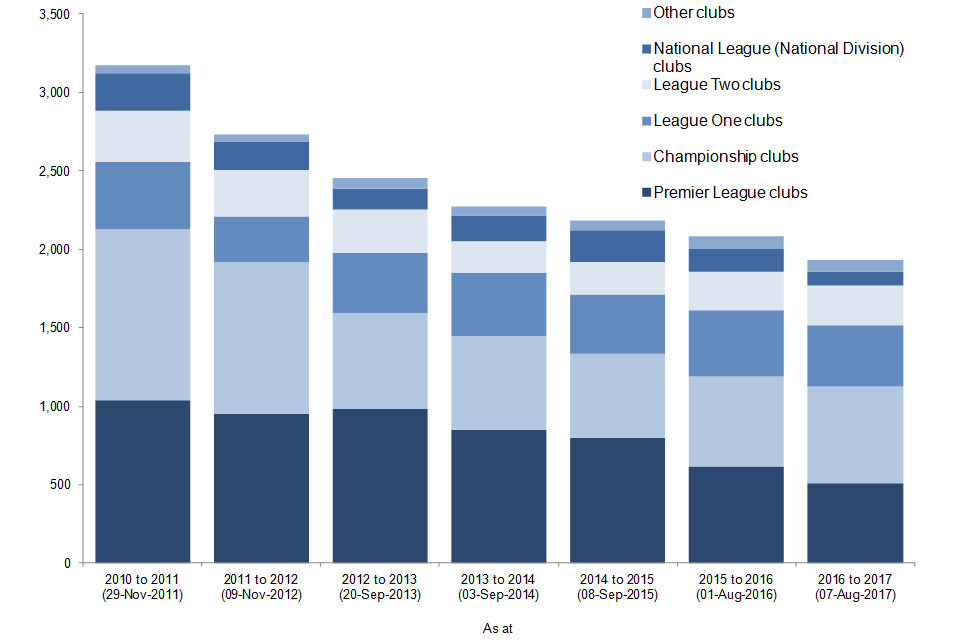
The chart shows the number of football banning orders in force in England and Wales by club supported since the 2010 to 2011 season. Data are available in Table 2.
Chart notes
Source: Home Office, Football-related arrests and banning order statistics, England and Wales, 2016 to 2017 season, table 2.
Caution should be taken when making season-on-season comparisons as the date the banning orders data were extracted varied from year to year. See the user guide for more information.
From the 2014 to 2015 season, clubs have been presented in the league they played in throughout that season. Prior to this, clubs were grouped in the league they were in as at the time of publication (i.e. the current season). Therefore, caution should be taken when comparing figures prior to the 2014 to 2015 season.
‘Other clubs’ include supporters of clubs from outside of England and Wales involved in regulated football matches played in England and Wales who have received a football banning order. It also includes supporters of clubs playing below National League (National Division) level.
3.2 New football banning orders by club supported
Of the 1,929 football banning orders that were in force as at 7 August 2017, 517 (27%) were new banning orders issued in the 2016 to 2017 season. This represents a decrease of 25 (5%) new banning orders when compared with those issued in the previous season.
In the 2016 to 2017 season, 33% of all new football banning orders were issued to supporters of Championship clubs (171 new football banning orders) followed by 30% issued to supporters of Premier League clubs (155 new football banning orders). This is the second consecutive season in which the highest proportion of new banning orders have been issued to supporters of Championship clubs, increasing by 14% from the previous season.
In the 2016 to 2017 season, supporters of clubs in the Premier League experienced the largest numeric increase with 31 new football banning orders (155 compared with 124 in the 2015 to 2016 season), whilst supporters of clubs in League One experienced the largest numeric decrease of 34 new football banning orders in the 2016 to 2017 season (100 compared with 134 in the 2015 to 2016 season).
Caution should be taken when comparing season-on-season changes by league as the composition of the leagues and divisions change every season following the promotion and relegation of teams.
The distribution of new banning orders varies from season-to-season. In the 2016 to 2017 season, Wolverhampton Wanderers fans were issued the highest number of banning orders (32), followed by West Ham United (30), Manchester United (24), Barnsley (22) and Grimsby Town (20). Grimsby Town fans account for over a quarter of new banning orders issued in their division. In the previous season (31 July 2015 to 1 August 2016), the highest number of new banning orders (21) were issued to fans of Wolverhampton Wanderers, Plymouth Argyle and also non-league Atherstone Town after a FA cup match.
Figure 2: Number of new football banning orders issued each season in England and Wales by club supported, from 2010 to 2011 season to 2016 to 2017 season
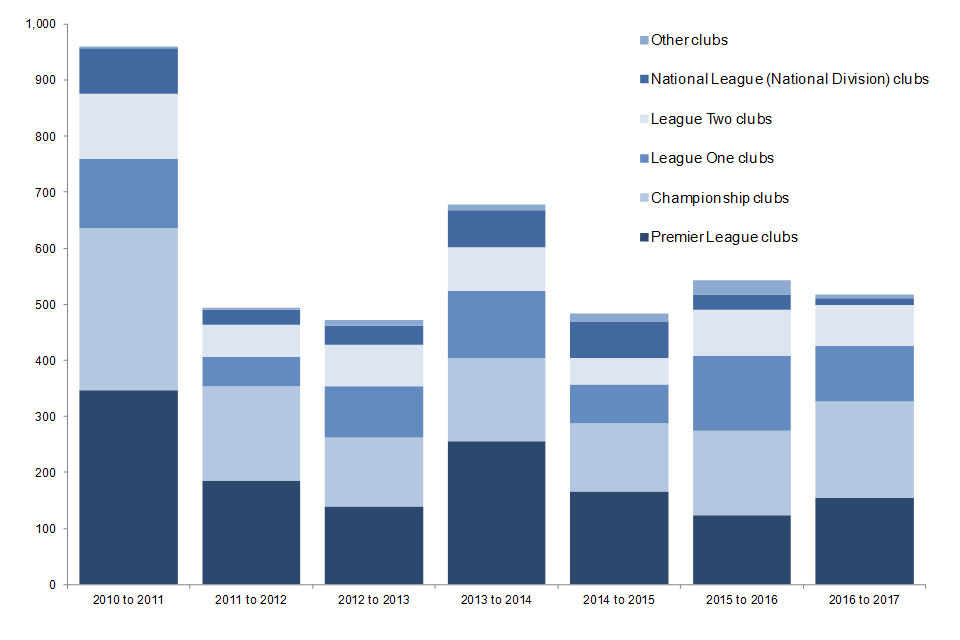
The chart shows the number of new football banning orders issued each season in England and Wales by club supported since the 2010 to 2011 season. Data are available in Table 4.
Chart notes
Source: Home Office, Football-related arrests and banning order statistics, England and Wales, 2016 to 2017 season, table 4.
Caution should be taken when making season-on-season comparisons as the date the new banning order data were extracted varied from year to year. See the user guide for more information.
From the 2014 to 2015 season, clubs have been presented in the league they played in throughout that season. Prior to this, clubs were grouped in the league they were in as at the time of publication (i.e. the current season). Therefore, caution should be taken when comparing figures prior to the 2014 to 2015 season.
‘Other clubs’ include supporters of clubs from outside of England and Wales involved in regulated football matches played in England and Wales who have received football banning order. It also includes supporters of clubs playing below National League (National Division) level.
4. Football-related arrests
4.1 Football-related arrests by competition
During the 2016 to 2017 season, there were 1,638 football-related arrests by all relevant police forces in connection with regulated international and domestic football matches involving English and Welsh clubs and the national teams. This represents a 14% decrease of 257 compared with the previous season.
Figure 3 shows the number of football-related arrests over the last 7 seasons ranging from 3,089 to 1,638, a 47% decrease of 1,451.
Of the 1,638 football-related arrests, the largest proportion occurred in connection with Championship matches, 28% (455). This is the second season in which fans of clubs in the Championship account for the highest proportion of all football-related arrests.
Caution should be taken when making season-on-season comparisons due to the changing composition of leagues and divisions as a result of the relegation and promotion of clubs.
More Birmingham City fans were arrested than any other club, as in the previous season, with 72 arrests. About a third of these arrests were for public disorder. They were followed by fans of West Ham United (67), Leeds United (61), Aston Villa (52) and Manchester City (47). In the previous season, more Birmingham City fans were arrested with 74 arrests, followed by fans of Millwall (69), Leeds United (68), Manchester City (66) and Arsenal (60).
Figure 3: Football-related arrests in England and Wales by competition, from 2010 to 2011 season to 2016 to 2017 season
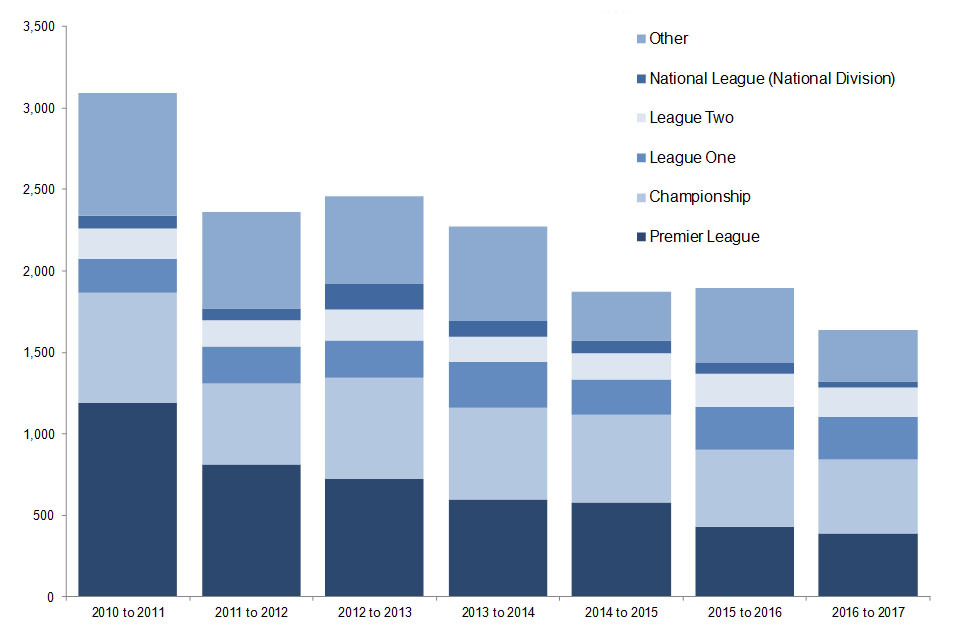
The chart shows the number of football-related arrests in England and Wales by competition since the 2010 to 2011 season. Data are available in Table 7.
Chart notes
Source: Home Office, Football-related arrests and banning order statistics, England and Wales, 2016 to 2017 season, table 7.
‘Other competitions’ include FA Cup, League Cup, Football League Trophy, European competitions, Internationals, Under-21 internationals, Pre-season friendlies, Community Shield and UEFA Super Cup.
Figures exclude BTP arrests.
Other competitions include domestic cups, European cups and international matches.
4.2 Football-related arrest rate per 100,000 attendees by competition
The football-related arrest rate in the 2016 to 2017 season was 4.0 arrests per 100,000 attendees. Of all competitions with 50 arrests or more, League Two had the highest arrest rate of 7.1 per 100,000 attendees whilst European competitions had the lowest arrest rate of 2.1 arrests per 100,000 attendees. Although the matches played in the Championship accounted for the highest number of football-related arrests, the arrest rate was 4.1 arrests per 100,000 attendees, similar to the average.
Figure 4: Football-related arrest rate per 100,000 attendees in England and Wales by competition, 2016 to 2017 season
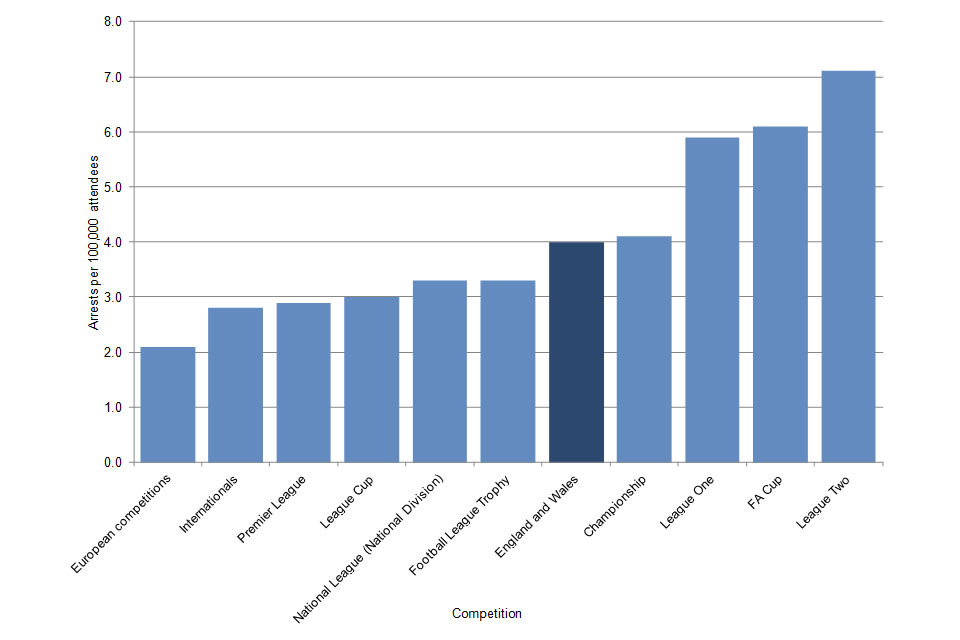
The chart shows the number of football-related arrests per 100,000 attendees in England and Wales by competition, 2016 to 2017 season. Data are available in Table 11.
Chart notes
Source: Home Office, Football-related arrests and banning order statistics, England and Wales, 2016 to 2017 season, table 11 and © Sky Sports Football Yearbook 2017 to 2018 (Attendance figures).
Excludes ‘other’ competitions which include Community Shield, Under-21 internationals and Pre-season friendlies.
4.3 Football-related arrests by offence type
Of the 1,638 football-related arrests in the 2016 to 2017 season, the 3 most common offence types were public disorder (31%), violent disorder (21%) and alcohol offences (16%). These have ranked within the top 3 offence types in each of the last 7 seasons.
There has been a general decrease in some offence types over the last 5 seasons. For example, arrests for public disorder offences have decreased for each of the last 5 seasons, decreasing from 791 in the 2012 to 2013 season to 505 in the 2016 to 2017 season. Conversely, arrests for pitch incursion have increased for each of the last 5 seasons (from 155 to 204).
Figure 5: Football-related arrests in England and Wales by offence type, from 2010 to 2011 season to 2016 to 2017 season
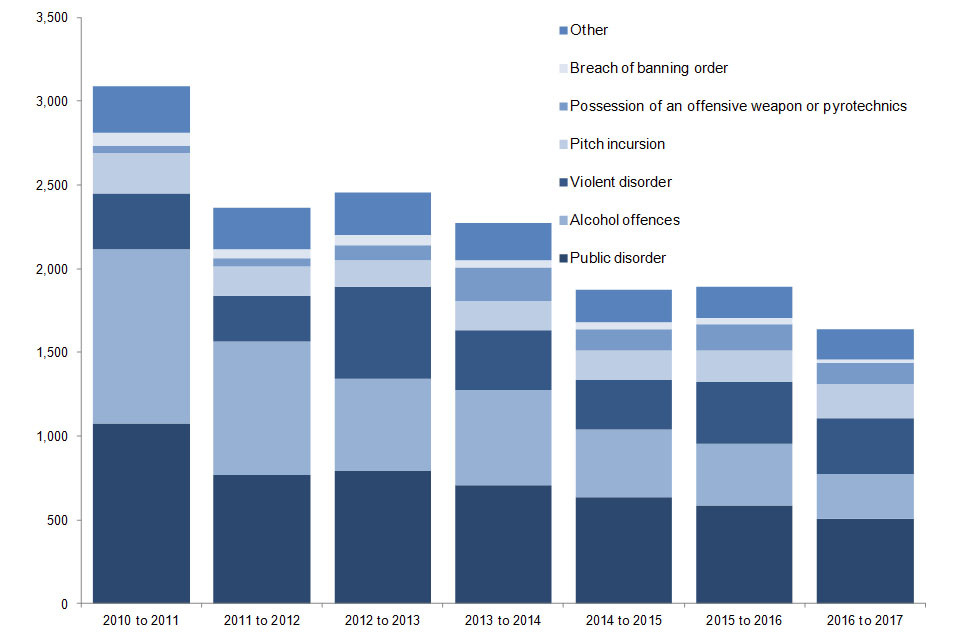
The chart shows the number of football-related arrests in England and Wales by offence type since 2010 to 2011 season. Data are available in Table 6.
Chart notes
Source: Home Office, Football-related arrests and banning order statistics, England and Wales, 2016 to 2017 season, table 6.
‘Other offences’ include throwing missiles, racist and indecent chanting, ticket touting and criminal damage.
Figures exclude BTP arrests.
5. Further information
5.1 Improvements this year
Improvements have been made to the presentation of the tables; the main tables and supplementary tables have been combined into one set of tables and include a time series. Several of the tables include filters (buttons in the cells at the top of columns) to allow users to compare data from across the football seasons and perform their own calculations. This is to promote transparency and allow users to exploit the data further
5.2 Changes to future publications
From the 2017 to 2018 football season’s publication, football-related arrests made by BTP will not be included in Tables 5 to 9 (arrests by club, league, offence type, competition and location) as it is not always possible to identify which team the individual supports or which fixture they are travelling to or from. Tables 5 to 9 from the 2014 to 2015 through to 2016 to 2017 season will be revised to exclude football-related arrests made by BTP to enable a comparable time-series. However, an overall table on BTP football-related arrests by offence type will continue to be published in Table 10 of the ‘Football-related arrests and banning order statistics, England and Wales: data tables’.
No changes will be made to Tables 1 to 4 relating to football banning orders.
5.3 Forthcoming and previous statistical releases
Forthcoming publications are pre-announced on the statistics release calendar on the GOV.UK website.
The football-related arrests and banning orders statistics, England and Wales statistical releases can be found at Football-related arrests and banning orders statistics.
5.4 Feedback and enquiries
We welcome feedback on this statistics release. If you have any feedback or enquiries about this publication, please email the Fire, Licensing & Public Order Analysis Unit at: publicorderstatistics@homeoffice.gov.uk or write to:
Fire, Licensing & Public Order Analysis Unit
14th Floor, Lunar House
40 Wellesley Road
Croydon
CR9 2BY
This Official Statistics output has been produced to the highest professional standards and free from political interference. It has been produced by statisticians working in the Home Office Analysis and Insight Directorate in accordance with the Home Office’s ‘Statement of compliance with the Code of Practice for Official Statistics’ which covers our policy on revisions and other matters.
The Chief Statistician, as Head of Profession, reports to the National Statistician with respect to all professional statistical matters and oversees all Home Office National Statistics products with respect to the Code, being responsible for their timing, content and methodology.
-
Articles 3-4 of the Football Spectators (Prescription) Order 2004 (as amended) describes a regulated match for the purposes of the Football Spectators Act 1989. ↩
-
Section 14A of the Football Spectators Act 1989. ↩
-
Section 14B of the Football Spectators Act 1989. ↩
-
The overlap between the years 2014 to 2015 and 2015 to 2016 may have resulted in some double counting. The dates of extraction for this season have been adjusted to standardise data reference dates for future publications. ↩
-
See the user guide for more information. ↩
-
Football-related arrests rate excludes ‘other’ competitions which include Community Shield, Under-21 internationals, pre-season friendlies. ↩