Farm Household Earnings, 2024/25
Published 30 July 2026
Applies to England

© Crown copyright 2026
This publication is licensed under the terms of the Open Government Licence v3.0 except where otherwise stated. To view this licence, visit nationalarchives.gov.uk/doc/open-government-licence/version/3 or write to the Information Policy Team, The National Archives, Kew, London TW9 4DU, or email: psi@nationalarchives.gov.uk.
Where we have identified any third party copyright information you will need to obtain permission from the copyright holders concerned.
This publication is available at https://www.gov.uk/government/statistics/farm-household-earnings/farm-household-earnings-202425
Introduction
This release uses information collected in the Farm Business Survey (FBS) to present data on the earnings of farming households for the 2024/25 survey year. Defra are monitoring the sources of income for farm households through the Agricultural Transition period to help measure the effects of policy changes. In this publication, we introduce results of a new income measure for farm households: Farm Household Earnings. This measure is the sum of the household’s share of the private drawings, wages paid by the farm to the household, and any Off-Farm Income earned by household members. This is the first year that data on wages paid by the farm to the household has been collected, so it is not possible to calculate this measure for previous years.
This release includes data from 2021/22 to 2024/25. The 2024/25 survey year covers the fourth year of the Agricultural Transition period and relates to the 2024/25 Farm Business Income results.
This release provides data on Farm Household Earnings, including separate data on Off-Farm Income. In order to provide continuity for users, Defra will also continue to publish statistics on Farm Household Income, which is the sum of the household’s share of Farm Business Income and any Off-Farm Income earned by household members. It allows for fairer comparisons both internationally and with other sectors. Farm Household Income results are not discussed in this commentary, but the data is available within the dataset tables. The dataset tables also include breakdowns of all of the measures by farm type, farm business size, tenure type and economic performance band.
Key Results
Farm Household Earnings
-
On average (median), primary farm households in England had earnings of £48,400 in 2024/25, based on the Farm Household Earnings measure (the sum of private drawings, wages from the farm, and Off-Farm Income).
-
When equivalised, this corresponded to a single adult earning £29,800.
-
Equivalised Farm Household Earnings were highest on general cropping farms (£41,100) and lowest on lowland grazing livestock farms (£24,300).
Off-Farm Income
-
In 2024/25, 73% of primary farm households had Off-Farm Income.
-
The average (median) Off-Farm Income was £12,500, equivalent to £8,300 for a single adult.
-
The most common sources of Off-Farm Income were pensions (28% of farms) and investments (26%).
-
Of the income sources recorded in the 2024/25 survey, the least common was green energy technologies (3% of farms).
Points which apply throughout
-
The Farm Business Survey is the source for all data presented in tables and charts unless otherwise stated.
-
All figures relate to England, unless otherwise stated, and cover a March to February fiscal year, with the most recent year shown ending in February 2025. Fiscal years are shown in YYYY/YY format, for example, the period of 1 March 2024 to 28 February 2025 is shown as 2024/25. To ensure consistency in harvest/crop year and commonality of subsidies within any one Farm Business Survey year, only farms which have accounting years ending between 31 December and 30 April are included in the survey. Aggregate results are presented in terms of an accounting year ending on the last day of February, which is the approximate average of all farms in the Farm Business Survey.
-
Financial figures have been rounded to the nearest £100. Percentages have been calculated on unrounded data and are rounded to the nearest 1%.
-
The acronym ‘LFA’ refers to Less Favoured Area. These areas were established in 1975 to provide support to mountainous and hill farming areas. They are areas where the natural characteristics (geology, altitude, climate, short growing season, low soil fertility, or remoteness) make it difficult for farmers to compete.
-
Some questions were only asked of a subsample of farms. Therefore, all years have been reweighted to maintain consistency with the survey population estimates. See section 4.1 for more detail. Due to the small sample sizes, pig and poultry farms have been combined into a single farm type.
-
Data was only collected from the household of the principal farmer of the farm business, referred to as the primary household. For farms where ownership and responsibilities are split equally between multiple farmers, the principal farmer is usually the person who was interviewed as part of the FBS. This means that each primary household represents one farm business in the survey.
-
Where dataset tables are referred to in the text, this refers to the ‘Farm Household Earnings in England, 2024/25 - dataset’ file, which can be found on the publication landing page.
1 Farm Household Earnings
Defra are monitoring the sources of income for farm households through the Agricultural Transition period to help measure the effects of policy changes. One of the measures being monitored is Farm Household Earnings, which is the sum of the household’s share of the private drawings, wages paid by the farm to the household, and any Off-Farm Income earned by household members.
Private drawings are calculated as the amount that the household took from the farm for paying personal taxes, corporation tax, private insurance premiums, national insurance for farmer and spouse, and living expenses. For expenses shared between the farm and the household, such as energy costs, the amounts that are applicable to the household are carefully estimated on a case-by-case basis using fully reconciled financial accounts.
More information on the development of this measure is available at https://www.gov.uk/government/publications/farm-household-income-methodology/.
Off-Farm Income was collected in income bands rather than exact amounts. This was done for two main reasons: to make it easier for farmers to answer, and to protect their privacy. The methodology section explains the data collection in more detail. Because of this approach, the earnings data for each farm is less precise than if exact figures had been collected.
In addition, earnings are often unevenly distributed, with many farms earning lower amounts and a few earning much higher amounts. To better reflect a typical farm, we use the median (the middle value) as the average, rather than the mean. However, estimates of the median from survey data are less precise than estimates of the mean.
Since the use of the median and Off-Farm Income bands both reduce precision, the confidence intervals are generally quite wide. If the confidence intervals for two estimates mostly overlap, it is unlikely that there is a meaningful difference between them.
The median is presented in both equivalised and unequivalised terms. Equivalisation is also explained in the methodology section. Put simply, it adjusts the household earnings to give the equivalent earnings of a single adult, allowing fair comparison of households with different sizes and compositions.
Figure 1.1 Average (median) Farm Household Earnings of primary farm households in England by farm type, 2024/25

Source: Dataset tables 1.1 and 1.2
Figure notes:
1. The legend is presented in the same order as the bars.
2. Values are shown here with 95% confidence intervals, which give an indication of the degree of uncertainty around an estimate; the lower and upper limits show the possible range around the published averages.
Figure 1.1 shows that the average Farm Household Earnings of primary households had some variation across farm types in 2024/25, but many had overlapping confidence intervals. The lowest estimate of the equivalised average was on lowland grazing livestock farms, at £24,300, while the highest, £41,100, was on general cropping farms. In comparison, the equivalised average for all farms was £29,800.
Figure 1.2 Average (median) Farm Household Earnings of primary farm households in England by farm business size (based on SLR), 2024/25

Source: Dataset tables 1.1 and 1.2
Figure notes:
1. The legend is presented in the same order as the bars.
2. Values are shown here with 95% confidence intervals, which give an indication of the degree of uncertainty around an estimate; the lower and upper limits show the possible range around the published averages.
Farm business sizes are based on the estimated Standard Labour Requirement (SLR) for the business, rather than its land area. See Table 4.1 for more detail.
Figure 1.2 shows that, in 2024/25, the primary households of large farm businesses tended to have higher Farm Household Earnings than those of smaller businesses. The equivalised averages of small, medium and part-time farm businesses were all similar to the all farms average, at around £30 thousand. For large farm businesses, the equivalised average was £40,200.
Figure 1.3 Average (median) Farm Household Earnings of primary farm households in England by tenure type, 2024/25

Source: Dataset tables 1.1 and 1.2
Figure notes:
1. The legend is presented in the same order as the bars.
2. Values are shown here with 95% confidence intervals, which give an indication of the degree of uncertainty around an estimate; the lower and upper limits show the possible range around the published averages.
Figure 1.3 shows that, in 2024/25, tenure type did not seem to have a significant impact on the Farm Household Earnings of farm businesses. This can be concluded because the confidence intervals of both the unequivalised and equivalised averages of each tenure type overlapped with the confidence intervals of the corresponding all farm average.
Figure 1.4 Average (median) Farm Household Earnings of primary farm households in England by economic performance, 2024/25

Source: Dataset tables 1.1 and 1.2
Figure notes:
1. The legend is presented in the same order as the bars.
2. Values are shown here with 95% confidence intervals, which give an indication of the degree of uncertainty around an estimate; the lower and upper limits show the possible range around the published averages.
Figure 1.4 shows that, in 2024/25, the Farm Household Earnings of the primary household increased as farm economic performance increased. The equivalised average for the top 25% performers was £42,400, compared to £23,500 for the bottom 25%. Although wages paid to household members did slightly increase as economic performance increased, the pattern was mainly driven by the average household’s share of drawings from the business considerably increasing on higher-performing farms. This was the opposite of the trend seen in Off-Farm Income, shown in figure 2.1.
2 Off-Farm Income
Off-Farm Income is the gross annual income of the principal farmer and their spouse or common law partner from any employment, self-employment or investments not related to the farm. It also includes any pensions, social payments and other off-farm income, for example, income from diversified activities set up independently of the farm business. Off-Farm Income does not include any capital gains, welfare payments made in kind (for example, free school meals), or windfall receipts and losses (for example, an inheritance).
2.1 Average Off-Farm Income
As with Farm Household Earnings, average (median) Off-Farm Income is presented in both equivalised and unequivalised terms. The number of adults and children in the household, which is required to equivalise income, was not collected in 2022/23, meaning that equivalised data is not available for the 2022/23 survey year. Data on Off-Farm Income was only collected from the farmer and their spouse between 2021/22 and 2023/24. In 2024/25, data collection from the whole household resumed. Because there is no recent comparable data, this section examines only the average incomes from 2024/25, however, data from 2021/22 to 2023/24 is available in the dataset tables. Household-level data up to 2014/15 is available on the historic statistics page.
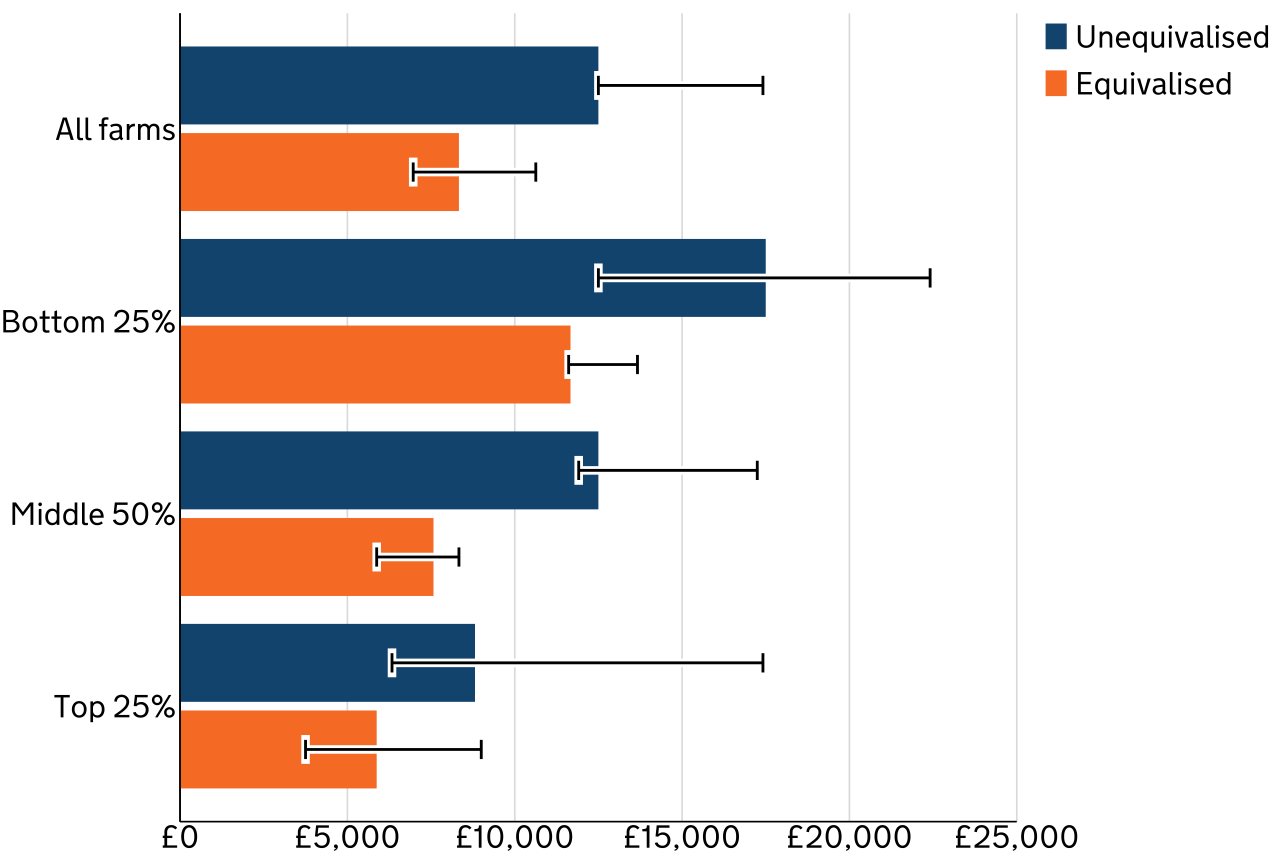
Figure 2.1 Average (median) Off-Farm Income of farm households by farm economic performance in England, 2024/25
Source: Dataset tables 2.1 and 2.2
Figure notes:
1. The legend is presented in the same order as the bars.
2. Values are shown here with 95% confidence intervals, which give an indication of the degree of uncertainty around an estimate; the lower and upper limits show the possible range around the published averages.
Figure 2.1 shows that, in 2024/25, the average (median) Off-Farm Income of primary farm households was £12,500, which was equivalent to £8,300 for a single adult.
The confidence intervals of the Off-Farm Income averages are generally wide, for the same reasons as Farm Household Earnings. However, the data shows us that Off-Farm Income was higher for farm businesses with lower economic performance, because the confidence intervals of the bottom 25% average (£11,700) and top 25% average (£5,900) do not overlap.
The FBS data tells us that the economic performance of individual farms can change a lot from year to year. However, each farm’s relative performance (in other words, which performance group it ends up in) does not usually change much over time. This is likely because external factors, such as weather and market prices, tend to be the main causes of performance changes from year to year, and these affect all farms. However, the impact of these factors is not the same for every farm, as different types of farms experience their effects in different ways; this is explored further in Farm Accounts in England. Together with the evidence above, this suggests that farmers use Off-Farm Income to support their income, relying on it more when their farm’s performance is lower than other farms.
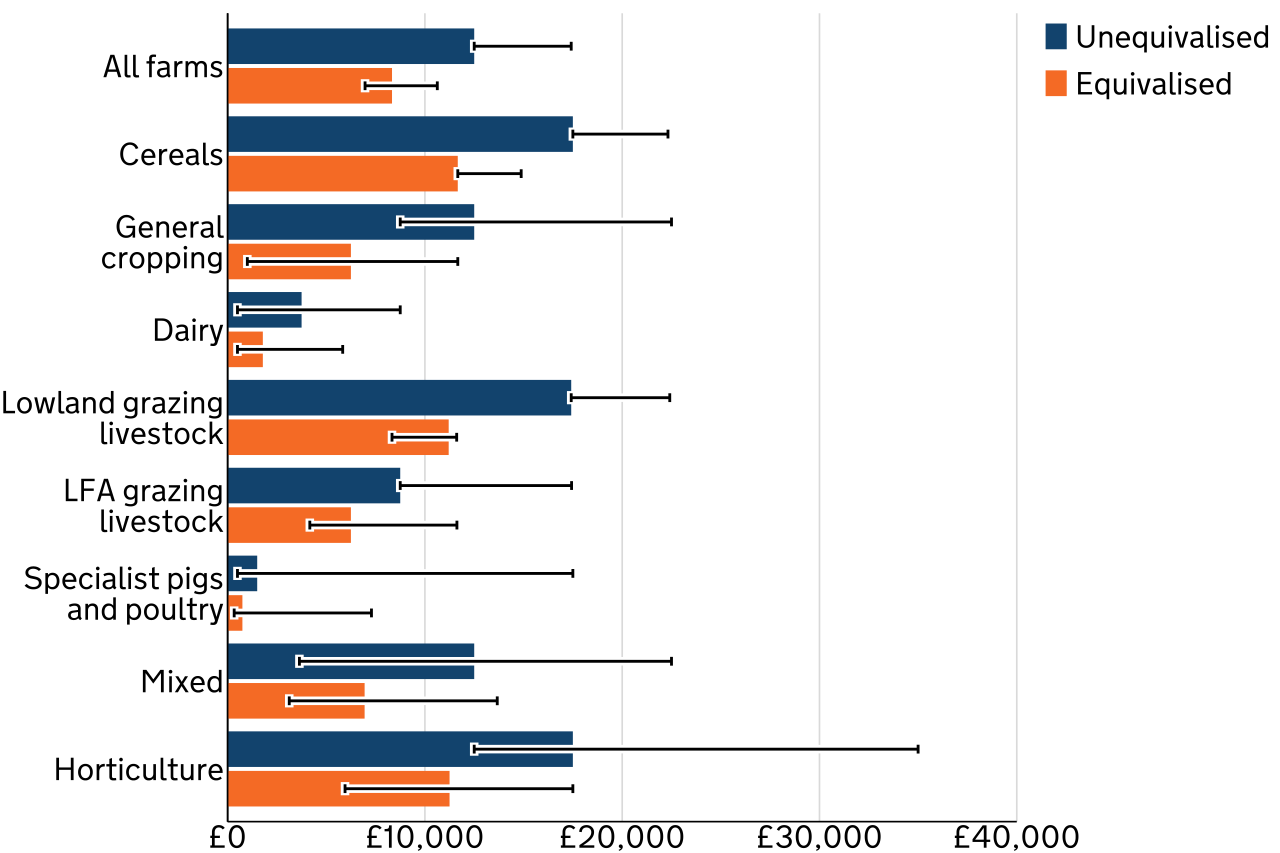
Figure 2.2 Average (median) Off-Farm Income of farm households by farm type in England, 2024/25
Source: Dataset tables 2.1 and 2.2
Figure notes:
1. The legend is presented in the same order as the bars.
2. Values are shown here with 95% confidence intervals, which give an indication of the degree of uncertainty around an estimate; the lower and upper limits show the possible range around the published averages.
Figure 2.1 shows that, despite large confidence intervals, primary households of some farm types, such as cereal, horticulture and lowland grazing livestock farms, were more likely to have higher Off-Farm Income in 2024/25. The highest equivalised average, £11,700, was on cereal farms. The primary households of dairy farms and specialist pig and poultry farms had the lowest equivalised Off-Farm Income averages, at £1,800 and £700 respectively.
2.2 Sources of Off-Farm Income
Farmers and their spouses were asked to report how much Off-Farm Income they received from the following sources: employment, self-employment, investments, pensions, social payments, income from green energy technologies, and other income. This income was reported as banded data. Due to small sample sizes, sensible medians could not be estimated from the data, therefore, this section provides data on the estimated proportion of farms in England earning each type of Off-Farm Income.
Data collected in 2024/25 allows us to find the proportion of farms where anyone from the household was earning Off-Farm Income, as well as the proportion where just the farmer or their spouse was earning it. However, the difference between these two values was estimated to be less than half a percentage point. This means that, of the 73% of farms where members of the primary household were earning Off-Farm Income, there was only a very small number where the farmer or their spouse was not one of these people.
Figure 2.3 Sources of Off-Farm Income for farms in England, 2023/24 and 2024/25

Source: Dataset table 3
Figure notes:
1. The legend is presented in the same order as the bars.
2. Values are shown here with 95% confidence intervals, which give an indication of the degree of uncertainty around an estimate; the lower and upper limits show the possible range around the published averages.
Figure 2.3 shows that pensions and investments were the most common type of Off-Farm Income, at 28% and 26% of farms, respectively. Compared to 2023/24, this represented respective decreases of 1 and 3 percentage points.
Of the income types collected in the 2024/25 survey, the least common was green energy technologies, at just 3% of farms. However, this income type is only recorded as Off-Farm Income if the farmer has set up a separate green energy business, which is uncommon. Most farms which produce green energy do so as part of their diversification of the farm business, which is analysed in Chapter 5 of Farm Accounts in England. Green energy production on farms is also examined in the Energy use publication.
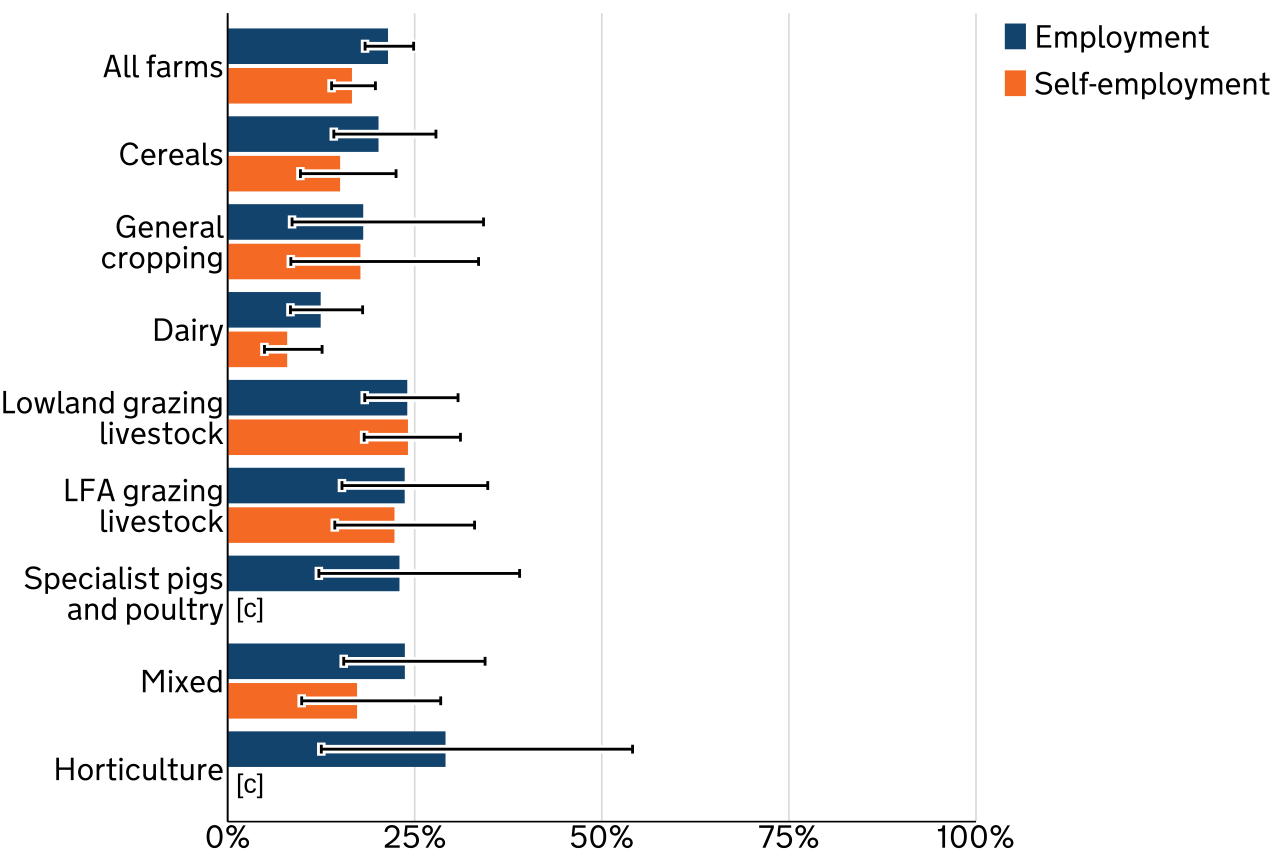
Figure 2.4 Off-Farm Income from employment and self-employment by farm type in England, 2024/25
Source: Dataset table 3
Figure notes:
1. Values are shown here with 95% confidence intervals, which give an indication of the degree of uncertainty around an estimate; the lower and upper limits show the possible range around the published averages.
2. The symbol [c] indicates that results have been suppressed due to a small sample size; suppressed values are included in the ‘All farms’ averages.
Figure 2.4 shows the percentage of farms where the principal farmer or spouse earned Off-Farm Income from employment and self-employment in 2024/25. The highest percentage earning Off-Farm Income from employment was on horticulture farms, at 29%, while the lowest percentage was on dairy farms, at 12%.
Across all farm types in 2024/25, the percentage of farms earning Off-Farm Income from self-employment was either the same as or lower than the percentage earning from off-farm employment. Lowland grazing livestock farms had the highest percentage with self-employment Off-Farm Income, at 24%. The lowest proportions were on specialist pig and poultry and horticulture farms; they both had fewer than five farms in the sample reporting Off-Farm Income from self-employment, therefore, their results have been suppressed.
Figure 2.5 Off-Farm Income from investments and pensions by farm type in England, 2024/25

Source: Dataset table 3
Figure note: Values are shown here with 95% confidence intervals, which give an indication of the degree of uncertainty around an estimate; the lower and upper limits show the possible range around the published averages.
Figure 2.5 shows that the farm types with the highest proportion earning Off-Farm Income from investments were general cropping, lowland grazing livestock and cereal farms, at 32%, 31% and 29% respectively. Across the other farm types, Off-Farm Income was earned from investments on around 20% of farms. Off-Farm Income from pensions was earned at similar rates to investments for most farm types, except for general cropping farms, with 43%, and specialist pig and poultry farms, with 13%.
3 What you need to know about this release
3.1 Contact details
Responsible statistician: Cat Hand
Public enquiries: fbs.queries@defra.gov.uk
For media queries between 9am and 6pm on weekdays:
Telephone: 0330 041 6560
Email: newsdesk@defra.gov.uk
3.2 National Statistics Status
Accredited official statistics are called National Statistics in the Statistics and Registration Service Act 2007. An explanation can be found on the Office for Statistics Regulation website. Our statistical practice is regulated by the Office for Statistics Regulation (OSR). OSR sets the standards of trustworthiness, quality and value in the Code of Practice for Statistics that all producers of official statistics should adhere to.
These accredited official statistics were independently reviewed by the Office for Statistics Regulation in January 2014. They comply with the standards of trustworthiness, quality and value in the Code of Practice for Statistics and should be labelled ‘accredited official statistics’.
You are welcome to contact us directly with any comments about how we meet these standards (see contact details above). Alternatively, you can contact OSR by emailing regulation@statistics.gov.uk or via the OSR website.
Since the latest review by the Office for Statistics Regulation, we have continued to comply with the Code of Practice for Statistics, and have made the following improvements:
-
Reviewed and improved data presentation to better meet accessibility guidelines
-
Automated production of the statistics using Reproducible Analytical Pipelines (RAP)
-
Reviewed and improved accompanying commentary.
3.3 User engagement
In line with Defra’s User Engagement for Statistics Policy Statement and the Code of Practice for Official Statistics, we are committed to ensuring that our statistics are of value and meet user needs, and we welcome any feedback or suggestions regarding this publication. To provide feedback, you can email us at: fbs.queries@defra.gov.uk.
You can also register as a user of the FBS statistics publications. Registering as a user means we will be able to contact you regarding any user engagement activities that we may run, such as seeking feedback on proposed changes.
3.4 Survey content, methodology and data uses
The Farm Business Survey (FBS) is an annual survey providing information on the financial position, physical characteristics, and economic performance of farm businesses in England. The sample of farm businesses covers all regions of England and all types of farming.
Data for the FBS is collected through face-to-face interviews with farmers, conducted by highly trained research officers.
The data are widely used by the industry for benchmarking and inform wider research into the economic performance of the agricultural industry, as well as for evaluating and monitoring current policies. The data will also help to monitor farm businesses throughout the Agricultural Transition period.
3.5 Availability of results
All Defra statistical notices can be viewed on the Statistics at Defra page.
More publications and results from the Farm Business Survey are available on the Farm Business Survey Collection page.
4 Technical note
4.1 Survey coverage and weighting
The Farm Business Survey only includes farm businesses with a Standard Output of at least £21 thousand, based on activity recorded in the previous June Survey of Agriculture and Horticulture. In 2024/25, the sample of 1,426 farms represented approximately 49,300 farm businesses in England.
Initial weights are applied to the Farm Business Survey records based on the inverse sampling fraction for each design stratum (farm type and farm size). Dataset table 16 from the Farm Accounts in England publication shows the distribution of the sample compared with the distribution of businesses from the 2024 June Survey of Agriculture. These initial weights are then adjusted, using calibration weighting, so that they can produce unbiased estimates of a number of different target variables. These variables have been updated due to the BPS data no longer being available in 2024/25. The detailed technical note on the weighting methodology has been updated to reflect the changes in the calibration model. More detailed information about the Farm Business Survey can be found on the technical notes and guidance page. This includes information on the data collected, information on calibration weighting and definitions used within the Farm Business Survey.
The data used for the income analysis in this publication is from surveyed farms which returned complete data on their household’s Off-Farm Income. The term ‘household’ refers here to a family unit sharing both a dwelling and a common budget. Where a farm business supports multiple households, only one of these is referenced – this is known as the primary household, and is usually the household of the survey respondent. In 2024/25 the subsample for household income data consisted of 856 farms (60% of the full sample).
The data used for analysis of the sources of Off-Farm Income is from surveyed farms which returned complete data on the Off-Farm Income sources of both farmer & spouse, or just the farmer if they did not have a spouse. In 2024/25 this subsample consisted of 949 farms (67% of the full sample).
Both of these subsamples have been reweighted using a method that preserves marginal totals for populations according to farm type and farm size groups. As such, values shown in this publication may not exactly match results calculated using the main FBS weights.
4.2 Accuracy and reliability of the results
As it is impractical to survey the entire population of farms, estimates derived from the Farm Business Survey data are inherently subject to sampling error. This is a core principle in statistical survey methodology, which aims to infer population parameters by obtaining a representative sample through carefully designed sampling techniques. To quantify sampling error and provide a measure of uncertainty, this publication presents 95% confidence intervals for estimated averages. These intervals, shown as error bars in bar plots, indicate the range within which we expect the true population average to lie for 95% of similarly constructed samples. Narrower confidence intervals typically indicate larger sample sizes or less variability within the sample, thereby offering more precise estimates of the population average. Conversely, wider confidence intervals often result from smaller sample sizes or greater sample standard deviations, signalling less precision. These wider intervals should be interpreted with greater caution. Statistically, a confidence interval provides a plausible range for the true population average based on the sample data. Specifically, a 95% confidence interval reflects a process that, under repeated sampling, would contain the true population average in 95% of such intervals, rather than indicating a 95% probability for any single interval to include the population average.
4.3 Methodology for calculating household earnings measures
Off-Farm Income
Off-Farm Income is collected at a gross level as banded data:
Table 4.1 Off-farm income data collection
| Band | Off-farm income |
|---|---|
| 1 | £0 |
| 2 | £1 to below £1,000 |
| 3 | £1,000 to below £2,500 |
| 4 | £2,500 to below £5,000 |
| 5 | £5,000 to below £7,500 |
| 6 | £7,500 to below £10,000 |
| 7 | £10,000 to below £15,000 |
| 8 | £15,000 to below £20,000 |
| 9 | £20,000 to below £25,000 |
| 10 | £25,000 to below £30,000 |
| 11 | £30,000 to below £40,000 |
| 12 | £40,000 to below £50,000 |
| 13 | £50,000 to below £75,000 |
| 14 | £75,000 to below £100,000 |
| 15 | £100,000 to below £150,000 |
| 16 | £150,000 to below £200,000 |
| 17 | £200,000 or more |
To estimate the true value from banded data for each farm, two methods were used. The first method was Mean Constrained Integration over Brackets (MCIB), developed by Paul Jargowsky and Christopher Wheeler (2018), and involved estimating density functions for each income bracket. These functions captured the variation and relative frequency of households within each bracket, using either linear or uniform approximations. By estimating these density functions, the MCIB methodology provided a more accurate representation of the income distribution.
The MCIB could not estimate the open top band without a grand mean. To address this, the Robust Pareto Midpoint Estimator (RPME), developed by Paul von Hippel et al (2014), was used. The RPME fitted a Pareto distribution to the top band, determining a minimum shape parameter cut-off and using a different mean for estimation, geometric for this report.
Both methods were more accurate than simply taking the midpoint of each band and allowed for the calculation of accuracy measures. The estimates for each band were calculated for each survey year and farm type, and then these were assigned to the corresponding farms as the Off-Farm Income value. The median income could then be calculated conventionally.
Equivalisation
All of the measures in this publication are shown both in terms of the average (median) per farm, and the equivalised average per farm. Equivalisation refers to using the number of adults and children in the household to adjust the value to the level of a single adult. This allows a fair comparison of households made up of differing numbers of people.
The OECD-modified equivalence scale is the standard method used for equivalisation; it assigns a value of 1 to the household head, 0.5 to each additional person aged 14 and over and 0.3 to each child aged under 14. In 2021/22, the Farm Business Survey did not collect the age of children, therefore, a value of 0.5 was assigned to each additional adult and 0.3 to each child for that year. From 2023/24, the number of children under 14 and 14 or over was collected, so equivalisation from that year onwards follows the OECD scale. For example, the total equivalence value for a household with a married couple, a 16-year-old child and a 10-year-old child is calculated as follows:
2021/22:
1 (first adult) plus 0.5 (second adult) plus 0.3 (16-year-old) plus 0.3 (10-year-old) is 2.1
2023/24 and onwards:
1 (first adult) plus 0.5 (second adult) plus 0.5 (16-year-old) plus 0.3 (10-year-old) is 2.3
The income is divided by this value to give the equivalised income for a single adult.
Table 4.3 Indicative equivalised medians of Farm Household Earnings and Off-Farm Income for differing household compositions in England, 2024/25
| Household size | Equivalence value | Farm Household Earnings | Off-Farm Income |
|---|---|---|---|
| One adult | 1.0 | £29,800 | £8,300 |
| One adult, one child aged 16 | 1.5 | £44,800 | £12,500 |
| One adult, one child aged 10 | 1.3 | £38,800 | £10,800 |
| One adult, two children aged 16 and 10 | 1.8 | £53,700 | £15,000 |
| Two adults | 1.5 | £44,800 | £12,500 |
| Two adults, one child aged 10 | 1.8 | £53,700 | £15,000 |
| Two adults, one child aged 16 | 2.0 | £59,700 | £16,700 |
| Two adults, two children aged 16 and 10 | 2.3 | £68,600 | £19,200 |
Table 4.3 demonstrates the effect of equivalisation in 2024/25. In each row, the equivalised average (£29,800) is multiplied by the equivalence value. This allows the user to compare their earnings to the average earnings of an equivalent farm household.
More information on equivalisation can be found on the OECD website, in the ONS Family spending in the UK publication and on the Eurostat website.
Adjusting for inflation
Where multiple years of data are shown in the dataset tables, values are shown in both current (nominal) and real terms. To convert values into real terms, they were adjusted for inflation using the latest available Consumer Prices Index including owner occupiers’ housing costs (CPIH), published 17 June 2026. Quarterly CPIH indices were used to create yearly indices which most closely matched FBS years, meaning that years started in Q2 (1 April) and ended in Q1 (31 March) of the following calendar year. These indices were then rebased so that the reference year was 2024/25.
Farm Household Income
In order to provide continuity for users, the dataset tables of this publication include statistics on Farm Household Income. This measure allows for fairer comparisons both internationally and with other sectors, however, it is not possible to produce a fully comparable measure due to differing methodologies in survey data collection. Farm Household Income is the sum of the household’s share of Farm Business Income, which is calculated using the percentage of private drawings taken by the household, and any Off-Farm Income earned by household members. Because they are not a cost incurred from farming, private drawings are not included as a cost in Farm Business Income. FBI uses depreciation of machinery and buildings, rather than the full amount paid, which is designed to account for future reinvestment in those large purchases. With this in mind, Farm Household Income could be described as the theoretical maximum disposable income for the household. This measure allows for fairer comparisons both internationally and with other sectors, however, it is not possible to produce a fully comparable measure due to differing methodologies in survey data collection.
Table 4.2 Comparing Equivalised Farm Household Earnings and Farm Household Income
| Farm type | Farm Household Earnings | Farm Household Income |
|---|---|---|
| All farms | £29,800 | £30,400 |
| Cereals | £38,000 | £32,300 |
| General cropping | £41,100 | £38,100 |
| Dairy | £35,200 | £57,100 |
| Lowland grazing livestock | £24,300 | £24,400 |
| LFA grazing livestock | £25,400 | £27,600 |
| Specialist pigs and poultry | £33,500 | £39,700 |
| Mixed | £29,600 | £25,500 |
| Horticulture | £27,000 | £22,200 |
Table 4.2 shows the effect of the differing methodologies of Farm Household Earnings and Farm Household Income on the 2024/25 per farm averages. At the all farm level, the difference was only around £600. However, some farm types showed large differences between the two measures, for example, the measures differed by around £6,200 in specialist pig and poultry farms, and by around £21,900 in dairy farms.
4.4 Definitions
Farm type
This refers to the ‘robust type’, which is a standardised farm classification system.
Farm business size
Farm business size is classified using the Standard Labour Requirement (SLR), rather than by Standard Output grouping or land area. The SLR of a farm represents the normal labour requirement for all the farm’s cropping and livestock activities under typical conditions. This is measured in Full Time Equivalents (FTE), which is the number of full-time workers required. The SLR is calculated from standard coefficients applied to each enterprise on the farm. The standard coefficients represent the input of labour required per head of livestock or per hectare of crops for enterprises of average size and performance.
The most recent update to SLR coefficients was in 2024, which was based on data from the 2019/20 to 2022/23 surveys. Before this, the previous update was in 2009, which was based on data from the 2004/05 to 2007/08 surveys.
Table 4.1: Farm business size by Standard Labour Requirement (SLR)
| Farm business size | SLR |
|---|---|
| Part-time | Less than 1 FTE |
| Small | 1 to less than 2 FTE |
| Medium | 2 to less than 3 FTE |
| Large | 3 or more FTE |
Median
The median divides the population, when ranked by an output variable, into two equal sized groups. The median of the whole population is the middle value. The median is used as the average for the incomes in this publication.
Mean
The mean is found by adding up the weighted variable of interest for each individual farm in the sample for analysis and dividing the result by the corresponding weighted number of farms. The incomes in this publication were generally too unevenly distributed for the mean to reflect a typical farm, so it is not used here.