Family Food 2019/20
Published 27 January 2022

© Crown copyright 2022
This publication is licensed under the terms of the Open Government Licence v3.0 except where otherwise stated. To view this licence, visit nationalarchives.gov.uk/doc/open-government-licence/version/3 or write to the Information Policy Team, The National Archives, Kew, London TW9 4DU, or email: psi@nationalarchives.gov.uk.
Where we have identified any third party copyright information you will need to obtain permission from the copyright holders concerned.
This publication is available at https://www.gov.uk/government/statistics/family-food-201920/family-food-201920
Introduction
Family Food 2019/20 presents the results from the 2019/20 Family Food module of the Living Costs and Food Survey, covering household shopping and eating habits. Around 5,000 households in the UK are surveyed annually. Households record their expenditure on, and purchased quantities of, food and drink both for the household and that consumed outside the home. Nutrient intake estimates can be derived from the purchase data. Detailed long term time series are available for download. Family Food datasets cover household and eating out purchases for a detailed set of food and drink types, and breakdowns by a number of characteristics including region, income, household composition and occupation, amongst others. More details on the survey are in the ‘About Family Food’ section.
Financial year estimates
The latest results cover the financial year 2019/20, in line with the parent survey for Family Food (see the ONS Family Spending report), which switched to financial year reporting for 2015/16 onwards. Comparisons between financial year estimates and previous calendar year ones are valid since both cover a full year of shopping activity. Generally Family Food exposes long term trends in consumer behaviour and year on year differences are not especially relevant. In the detailed datasets we have provided indicative estimates for 2015/16 as well as the previously published 2015 calendar year estimates, for comparison.
Results presented in this headline release cover the financial year ending (FYE) 2020, that is, April 2019 to March 2020.
Following government guidance in relation to the coronavirus (COVID-19) pandemic, a pause in data collection led to interviews being conducted for 13 fewer days in March 2020 than planned. Final March interviews took place on Monday 16 March 2020. All households that were not interviewed as a result were treated as non-responders and data were weighted to account for reduced data collection in March 2020 compared with previous years.
1. Expenditure
1.1 Overview
This section provides estimates of household and eating out expenditure on food in 2019/20, alongside analyses of changes in household shopping behaviour in response to food price inflation in recent years.
Using comparisons between low income households and all households it is possible to examine the greater effects food price rises may have on vulnerable groups in society. Low income is one of many reasons to be vulnerable in society but this group is used here as a proxy. In the context of this chapter, low income households are identified as those within the lowest twenty per cent of households by equivalised income, a measure of household income that accounts for differences in household size and composition.
-
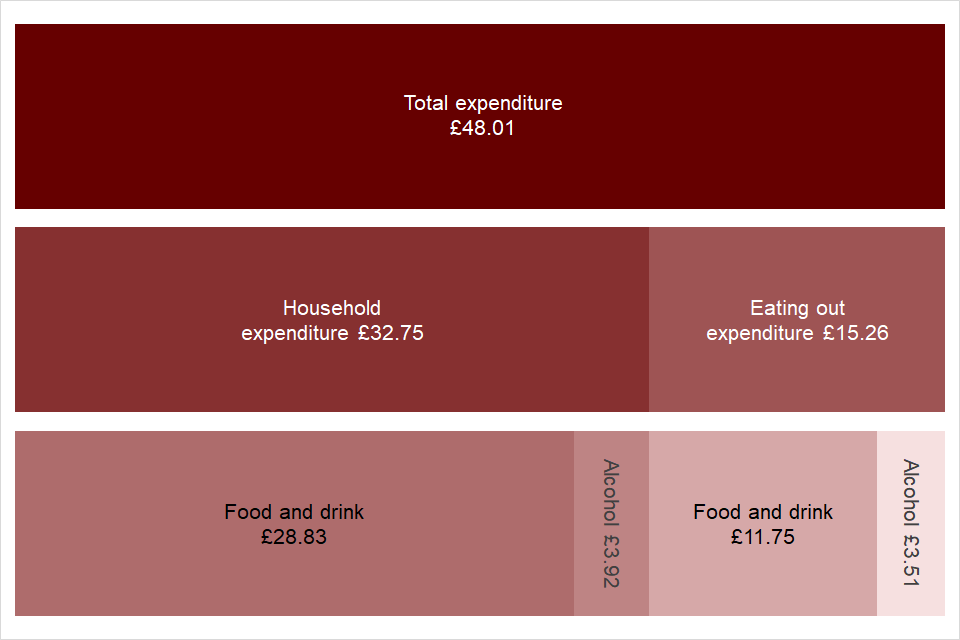
In 2019/20 the amount that an average household spent on all food and drink, including alcoholic drinks and food eaten out was £48.01 per person per week. When inflation is taken into account, the amount spent was 1.2 per cent more than 2018/19 and 2.2 per cent more than 2016/17. Household food and non-alcoholic drink purchases formed the largest share at £28.83 per person per week.
-
In 2019/20 the percentage of spend on food and non-alcoholic drinks for the average UK household was 10.8 per cent, up from 10.6 per cent in 2018/19.
-
For households with the lowest 20 per cent of income, the percentage of spend on food is the second highest at 14.7 per cent in 2019/20, after housing, fuel and power.
1.2 Food classification and results tables
Family Food classifies food items into a hierarchical coding scheme of approximately 500 different food codes. Full details of how food is coded and where it fits into the scheme are available in the methodology paper ‘Food and drink codes’. Because of space limitations, the data tables in this report generally only show selected food and drink items within the main categories. The accompanying spreadsheet datasets show results for the full list of codes, going back in most cases to 2001 and in some cases back to 1974. Historical estimates going back to 1940 in some cases are available from The National Archives.
1.3 Household spending on food
The average weekly expenditure in actual prices (not adjusted for inflation) on all household food and drinks in 2019/20 was £32.75 per person, an increase of 1.9 per cent on 2018/19. Total expenditure on household food and non-alcoholic drink increased by 1.9 per cent in 2019/20 to £28.83 and was 8.6 per cent higher than in 2016/17. While household food and drink expenditure has increased by 8.9 per cent since 2016/17, expenditure on food and drink eaten out has increased by 4.0 per cent.
Chart 1.1: UK average expenditure on food and drink, per person per week, 2019/20
Data for this chart is in the UK expenditure dataset, downloadable here.
View the specific data for this chart in your browser
Download the specific data for this chart in .csv format: 319 Bytes
1.4 Trends in spending in real terms
Table 1.1 shows expenditure in real terms, with the values adjusted to remove the effects of inflation. The figures are derived by deflating expenditure at current prices by the all items Consumer Price Index.
The Consumer Price Index (CPI) rose by 1.8 per cent between 2018/19 and 2019/20 and rose by 6.7 per cent between 2016/17 and 2019/20. Removing this overall rise in prices from the changes in expenditure on food and drink shows how expenditure in real terms has changed.
Since 2016/17, expenditure on household food and non alcoholic beverages in real terms has risen by 1.7 per cent and eating out expenditure has risen by 2.9 per cent. Spending on alcoholic drinks for household consumption rose by 4.6 per cent over the same period, whilst alcoholic drinks bought for consumption outside the home rose by 1.2 per cent.
Since 2018/19 expenditure on all food and drink eaten out has fallen by 1.5 per cent. Expenditure on food and non alcoholic beverages eaten out has risen by 3.8 per cent and expenditure on alcoholic drinks consumed out has risen by 2.8 per cent.
There has been negligible change in expenditure on household food and non-alcoholic beverages between 2018/19 and 2019/20.
Context: Food Prices
Food prices rose sharply during the economic crash in 2008, and in subsequent years, food price inflation was generally higher than overall inflation. Food prices are driven by a number of factors, but international commodity and oil prices and exchange rates are significant ones.
In 2014 the food price inflation rate (as measured by the Consumer Price Index) fell below overall inflation, and food prices actually started to fall as inflation fell below 0%. This trend continued throughout 2015 and 2016, but food prices began to increase again at the start of 2017.
In this section there are analyses of households’ responses to changes in food prices, including ‘trading down’ to cheaper products of the same type, and buying less. Family Food estimates generally show trends over the long term and short term spikes or depressions are smoothed out in the annual results. If the current short term picture with prices continues, as the sharp increases from 2007 did, then we can expect to see this reflected in shopping behaviour in future years.
Table 1.1: UK expenditure on food and drink in real terms, 2019/20(a)(b)(c)
| 1995 (a)(b) |
201516 | 201617 | 201718 | 201819 | 201920 | % change since 201819 |
% change since 201617 |
|
|---|---|---|---|---|---|---|---|---|
| CPIH All Items D7BT (2015 = 100) | 67 | 100 | 101 | 103 | 106 | 108 | 1.8% | 6.7% |
| Expenditure on household food and drink | 33.72 | 31.55 | 32.09 | 32.73 | 32.7 | 32.75 | 0.2% | 2.0% |
| Expenditure on food and drink eaten out | 9.44 | 13.99 | 14.89 | 14.51 | 14.74 | 15.26 | 3.6% | 2.5% |
| Total expenditure on all food and drink | 43.16 | 45.54 | 46.98 | 47.24 | 47.43 | 48.01 | 1.2% | 2.2% |
| Expenditure on household food and non-alcoholic drink | 26.93 | 28.02 | 28.35 | 28.71 | 28.83 | 28.83 | 0% | 1.7% |
| Expenditure on food and non-alcoholic drinks eaten out | 6.98 | 10.59 | 11.43 | 11.11 | 11.32 | 11.75 | 3.8% | 2.9% |
| Expenditure on all food and non-alcoholic drinks | 33.91 | 38.61 | 39.77 | 39.82 | 40.15 | 40.58 | 1.1% | 2.0% |
| % eaten out | 21% | 27% | 29% | 28% | 28% | 29% | ||
| Expenditure on household alcoholic drinks | 2.91 | 3.53 | 3.74 | 4.01 | 3.87 | 3.92 | 1.2% | 4.6% |
| Expenditure on alcoholic drinks eaten out | 2.46 | 3.40 | 3.47 | 3.41 | 3.41 | 3.51 | 2.8% | 1.2% |
| Expenditure on all alcoholic drinks | 5.37 | 6.94 | 7.21 | 7.42 | 7.28 | 7.43 | 2.0% | 3.0% |
| % eaten out | 46% | 49% | 48% | 46% | 47% | 47% |
(a) £ per person per week
(b) 1995 Great Britain only.
(c) Estimates on eating out in 1995 are based on National Food Survey which was considered less reliable.
1.5 Indicator of affordability of food
The relative affordability of food can be measured by the share of the household budget going on food, i.e. the percentage of total household spending that goes on household food purchases. If the percentage increases over time, food is placing a greater burden on spending. Low income households are of particular concern because they tend to have a greater percentage of spend going on food.
Table 1.2: Percentage of spend on food and non-alcoholic drinks
| Year | Lowest 20% by equivalised income | All UK households |
|---|---|---|
| 2008 | 16.8 | 10.8 |
| 2009 | 16.1 | 11.5 |
| 2010 | 15.8 | 11.2 |
| 2011 | 16.6 | 11.3 |
| 2012 | 16.2 | 11.6 |
| 2013 | 16.1 | 11.4 |
| 2014 | 16.4 | 11.1 |
| 2015/16 | 16.0 | 10.7 |
| 2016/17 | 14.5 | 10.5 |
| 2017/18 | 15.2 | 10.6 |
| 2018/19 | 14.7 | 10.6 |
| 2019/20 | 14.7 | 10.8 |
In the UK, an average 10.8 per cent of household spend went on food in 2019/20, while for the lowest 20 per cent of households by equivalised income it was higher at 14.7 per cent. Engel’s law is an observation in economics stating that as income rises the proportion of income spent on food falls, even if actual expenditure on food rises. Although these estimates are of proportion of expenditure not income, they are consistent with that observation.
Although the percentage of spend on food remains relatively constant, the actual amount spent, and the products purchased will change in response to relative prices. In 2019/20, the average food price inflation, measured by the CPIH, was 1.1 per cent.
1.6 Effects of food price rises
Food prices from 2016/17 to 2019/20
Food and non alcoholic beverage prices began rising from about July 2006, peaking in August 2008, before steadying at a new higher level until early 2014. Prices then decreased every month until early 2017 when prices began to rise again, peaking in March 2018 then rising again to March 2020.
On average, CPIH food and non alcoholic beverage prices rose by 1.4 per cent in 2019/20, below the CPIH all items rate of inflation which increased by 1.7 per cent, as measured by the Consumer Price Index.
Go to Family Food 2019/20: About Family Food
Return to Family Food 2019/20 home page
2. Purchases
2.1 Overview
Comparisons over a long period of time provide a more reliable indication of change than a year on year comparison. Detailed long term time series are available for download. Family Food datasets cover household and eating out purchases for a detailed set of food and drink types, and breakdowns by a number of characteristics including region, income, household composition and occupation, amongst others.
Purchases of various household foods are on a clear short term downward trends, including milk and milk products, meat products, potatoes and bread.
Context: Purchases estimates
It is a widely recognised characteristic of self reported diary surveys such as Family Food that survey respondents tend to under report their purchases (and any derived nutrient intakes based on purchased quantities are also likely to be underestimates). Empirical comparisons of sales and duty data for alcohol in particular suggest that reported alcohol consumption could be 40-60 per cent lower than the reality. For other food and drink, reporting is likely to be closer to actual purchases, but under-reporting is likely to feature and some food types may be under-reported to a greater extent than others.
Although such surveys are completely confidential, respondents may under report for a range of reasons, from self consciousness to simply forgetting to record purchases. ‘Top up’ and eating out purchases are probably more likely to be missed than the main household shop. There is no evidence to say whether levels of under-reporting have changed over time but it is plausible that changes in household shopping and eating patterns may have contributed to increased under-reporting.
Users should bear this issue in mind, when considering trends in estimated intakes and the values for individual years. For example the downward trend in energy intake estimates can appear counter-intuitive at face value given other evidence on the prevalence of obesity. Factors affecting obesity and other health issues are complex. Family Food trends are broadly consistent with other sources, such as the National Diet and Nutrition Survey which also show reported energy intake in decline, although NDNS intakes are also known to be under-reported.
We have not produced a commentary on derived nutritional intake estimates in this report, although the data is published in our datasets.
There are much more data and analysis available about health and diet from Public Health England.
2.2 Household purchases
Table 2.1 shows the main food groups examined in this section and contains an indication of those items where a statistically significant 4 year linear trend is evident. A detailed explanation of how these trends are calculated is available in the Methodology Papers.
Table 2.1: Quantities of household purchases of food and drink in the UK
Grams per person per week, except for liquids in millilitres, and eggs (number) (a)
| Food group | Units | 2015 | 201617 | 201718 | 201819 | 201920 | % change since 201819 | % change since 201617 |
|---|---|---|---|---|---|---|---|---|
| Milk and milk products (excluding cheese) | (ml) | 1827 | 1818 | 1786 | 1840 | 1746 | -5.1 | -4 |
| Cheese | 112 | 124 | 125 | 123 | 129 | 4.7 | 4.4 | |
| Meat | 929 | 953 | 957 | 961 | 949 | -1.3 | -0.4 | |
| Fish | 146 | 139 | 139 | 146 | 148 | 1.6 | 6.5 | |
| Eggs | (no.) | 2 | 2 | 2 | 2 | 2 | 5.4 | 13 |
| Fats | 162 | 139 | 158 | 161 | 158 | -1.5 | 13.9 | |
| Sugar and preserves | 106 | 107 | 99 | 93 | 87 | -6.1 | -18.4 | |
| Potatoes (fresh and processed) | 675 | 634 | 669 | 620 | 612 | -1.4 | -3.5 | |
| Vegetables (excluding potatoes) | 1103 | 1137 | 1134 | 1139 | 1147 | 0.7 | 0.9 | |
| Fruit | 1093 | 1130 | 1097 | 1106 | 1080 | -2.3 | -4.4 | |
| Bread | 543 | 532 | 527 | 521 | 524 | 0.6 | -1.5 | |
| Cakes, buns and pastries | 155 | 150 | 159 | 151 | 163 | 8.3 | 9.1 | |
| Biscuits and crispbreads | 164 | 169 | 160 | 159 | 173 | 8.5 | 2.4 | |
| Other cereals and cereal products | 566 | 562 | 582 | 589 | 607 | 2.9 | 8 | |
| Beverages | 53 | 54 | 49 | 52 | 56 | 7.1 | 2.7 | |
| Soft drinks (b) | (ml) | 1531 | 1608 | 1508 | 1642 | 1658 | 1 | 3.1 |
| Confectionery | 132 | 130 | 137 | 136 | 144 | 6 | 10.9 | |
| Alcoholic drinks | (ml) | 678 | 712 | 728 | 712 | 728 | 2.2 | 2.2 |
(a) Milk and milk products excluding cheese, beverages, soft drinks and alcoholic drinks are measured in millilitres, eggs are counted individually.
(b) Converted to unconcentrated equivalent by applying a factor of 5 to concentrated and low calorie concentrated soft drinks.
2.3 Home-grown food
In 2019/20, 2.6 per cent of fresh fruit and vegetables entering the household came from free sources, mainly gardens and allotments. This is down from 3.0 per cent in 2018/19. This percentage is subject to year on year fluctuations depending on growing conditions in the UK. In 2019/20, the percentage of eggs entering the household which were free or home produced was 6.4 per cent.
Table 2.2: Percentage of household food home-grown in gardens or allotments
| 2012 | 2013 | 2014 | 201516 | 201617 | 201718 | 201819 | 201920 | |
|---|---|---|---|---|---|---|---|---|
| Beans | 28 | 29 | 28 | 29 | 16 | 31 | 18 | 25 |
| Potatoes | 3 | 3 | 3 | 4 | 4 | 4 | 1 | 2 |
| Onions, leeks and shallots | 3 | 4 | 2 | 5 | 5 | 3 | 1 | 3 |
| Tomatoes | 5 | 6 | 5 | 6 | 5 | 5 | 9 | 7 |
| All other vegetables | 3 | 3 | 3 | 3 | 2 | 4 | 3 | 2 |
| Apples | 3 | 8 | 6 | 12 | 6 | 5 | 8 | 6 |
| Soft fruit | 9 | 12 | 8 | 7 | 6 | 7 | 7 | 4 |
| All other fruit | 1 | 1 | 1 | 1 | 1 | 2 | 4 | 4 |
| Overall percentage | 2.7 | 3.5 | 2.8 | 3.8 | 2.8 | 3.0 | 3.0 | 2.6 |
| Eggs | 5.0 | 7.0 | 5.0 | 3.8 | 4.3 | 3.3 | 3.8 | 6.4 |
2.4 Takeaway food and drink
Takeaway purchases for consumption within the home are classed as household purchases (see Methodology Papers). Table 2.3 summarises the takeaway part of the major food groups. Between 2018/19 and 2019/20, purchases of takeaway food brought home have increased by 0.1 per cent. Expenditure on takeaway foods was £2.33 per person per week in 2019/20, 8.3 per cent higher than in 2016/17.
Table 2.3 UK household quantities and expenditure on takeaway food brought home (a)
| Purchases | 201516 | 201617 | 201718 | 201819 | 201920 | RSE (b) | % change since 201819 | % change since 201617 |
|---|---|---|---|---|---|---|---|---|
| Total Meat | 54 | 59 | 55 | 53 | 57 | ++ | 6.6 | -3.6 |
| Total Fish | 11 | 9 | 10 | 10 | 9 | + | -10.3 | -0.4 |
| Total Vegetables | 47 | 42 | 43 | 40 | 45 | ++ | 10.5 | 6.1 |
| Total Bread | 5 | 5 | 4 | 5 | 6 | + | 3.6 | 22.7 |
| Total Other Cereals | 48 | 47 | 40 | 44 | 45 | + | 1 | -5.2 |
| Total Miscellaneous | 3 | 3 | 3 | 3 | 4 | 8.1 | 43.2 | |
| Total | 167 | 164 | 156 | 156 | 164 | 4.9 | 0.1 |
| Expenditure | 201516 | 201617 | 201718 | 201819 | 201920 | RSE (b) | % change since 201819 | % change since 201617 |
|---|---|---|---|---|---|---|---|---|
| Total Meat | 75 | 90 | 87 | 86 | 96 | ++ | 11.2 | 6.8 |
| Total Fish | 21 | 17 | 20 | 20 | 19 | + | -8.4 | 7 |
| Total Vegetables | 32 | 34 | 35 | 33 | 37 | + | 11.3 | 9.4 |
| Total Bread | 9 | 9 | 9 | 12 | 12 | 6.7 | 31.4 | |
| Total Other cereals | 56 | 60 | 53 | 62 | 64 | + | 3.6 | 6.1 |
| Total Miscellaneous | 4 | 5 | 5 | 5 | 5 | -2.9 | 14.8 | |
| Total | 196 | 215 | 209 | 218 | 233 | 6.7 | 8.3 |
(a) Purchases in grams per person per week, Expenditure in pence per person per week
(b) Relative Standard Error: +++: < 2.5%, ++: 2.5% - 5%, +: 5% - 10%, no +: 10% - 20%, -: >20%
Go to the methodology page to learn more about how we produce Family Food