Family Food 2016/17: Summary
Published 26 April 2018

© Crown copyright 2018
This publication is licensed under the terms of the Open Government Licence v3.0 except where otherwise stated. To view this licence, visit nationalarchives.gov.uk/doc/open-government-licence/version/3 or write to the Information Policy Team, The National Archives, Kew, London TW9 4DU, or email: psi@nationalarchives.gov.uk.
Where we have identified any third party copyright information you will need to obtain permission from the copyright holders concerned.
This publication is available at https://www.gov.uk/government/statistics/family-food-201617/summary
1. Introduction
Family Food 2016/17 presents the results from the 2016/17 Family Food module of the Living Costs and Food Survey, covering household shopping and eating habits. Around 5,000 households in the UK are surveyed annually. Households record their expenditure on, and purchased quantities of, food and drink both for the household and that consumed outside the home. Nutrient intake estimates can be derived from the purchase data. Detailed long term time series are available for download. Family Food datasets cover household and eating out purchases for a detailed set of food and drink types, and breakdowns by a number of characteristics including region, income, household composition and occupation, amongst others. More details on the survey are in the ‘About Family Food’ section.
Financial year estimates
The latest results cover the financial year 2016/17, in line with the parent survey for Family Food (see the ONS Family Spending report), which switched to financial year reporting for 2015/16 onwards. Comparisons between financial year estimates and previous calendar year ones are valid since both cover a full year of shopping activity. Generally Family Food exposes long term trends in consumer behaviour and year on year differences are not especially relevant. In the detailed datasets we have provided indicative estimates for 2015/16 as well as the previously published 2015 calendar year estimates, for comparison.
In 2016/17 the amount that an average household spent on all food and drink, including alcoholic drinks and food eaten out was £43.18 per person per week. When inflation is taken into account, the amount spent was 1.1 per cent more than 2015 and 0.1 per cent more than 2013. Household food and non-alcoholic drink purchases formed the largest share at £26.34 per person per week.
2. Summary of Expenditure
The report focuses mostly on trends since 2007, when food prices peaked.
- Since 2013, expenditure on household food and non alcoholic beverages in real terms has fallen by 3.2 per cent and eating out expenditure has risen by 9.5 per cent. Spending on alcoholic drinks for household consumption rose by 1.5 per cent over the same period, whilst alcoholic drinks bought for consumption outside the home dropped by 0.5 per cent.
3. UK average expenditure on food and drink, pence per person per week, 2016/17
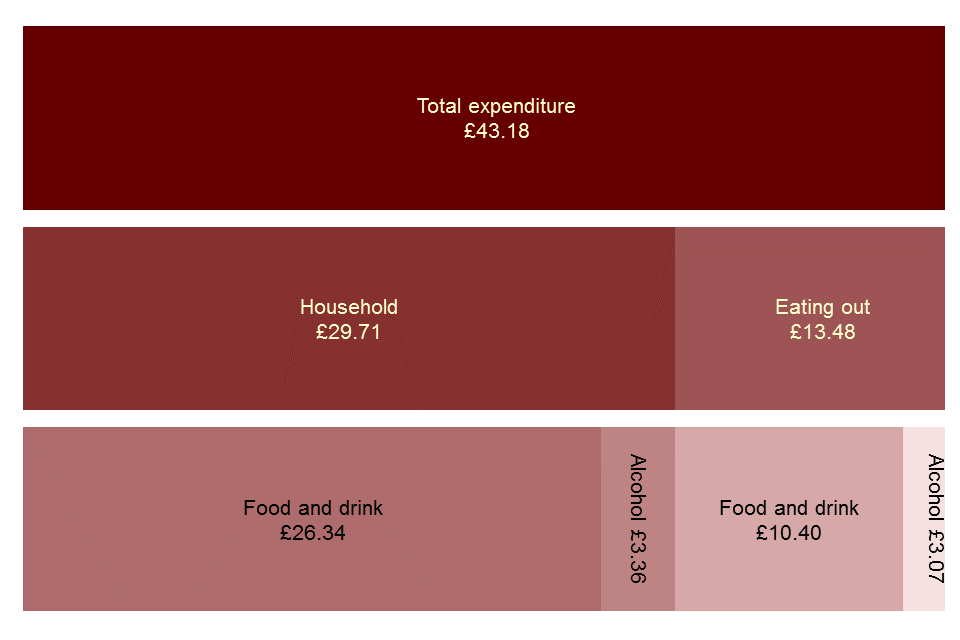
Family Food Chart 1.1 UK average expenditure on food and drink, per person per week
Data for this chart is in the UK expenditure dataset, downloadable here.
-
The percentage of spend on food continues to be highest for households with the lowest 20 per cent of income, at 14.3 per cent in 2016/17, although the gap is the closest it has been in the period shown in this release. Food is the largest item of household expenditure for low income households, after housing, fuel and power costs.
-
On average households ‘traded up’ to more expensive products by 4.4 per cent on the unit prices paid for food between 2014 and 2016/17. This was possible due to price decrease of 4.4 per cent. The lowest income households still traded up, but to a much lesser extent.
-
The average household spent 0.3 per cent more on food in 2016/17 than in 2014, when prices were at their highest during the last 10 years. Households in the lowest income decile spent 4.1 per cent less than in 2014.
4. Summary of Purchases
The report focuses mainly on trends over the period 2013-2016/17.
-
Household purchases of fresh and processed vegetables (excluding potatoes) have shown no clear trend in the last 5 years, following a sharp fall. Fresh green vegetables have shown a slight downward trend, offset by a 5 per cent increase in purchases of other fresh vegetables. Purchases of processed vegetables, which account for about 30 per cent of the total, have been largely stable despite fluctuating in the most recent few years.
-
Potato purchases continued their long term downward trend, with an 8.8 per cent reduction since 2013. Purchases of processed potatoes were chips and crisps and these have been relatively stable over the last ten years.
-
Purchases of chicken have increased over the last 10 years and were the most popular unprocessed meat product purchsed by weight at 193g per person per week. This was followed by beef which has remained fairly stable in recent years at around 100g per person per week. Lamb has shown a clear downward trend over the last 10 years, whilst pork has been relatively stable.
-
Household purchases of fish and fish products have fallen steadily since 2006 with a 6 per cent fall over the last four years. Ready meals account for over one third of purchases. Purchases of salmon have shown a recent upward trend.
-
Having increased gradually over the last ten years, butter purchases have decreased since 2015 by 18 per cent to 35 grams per person per week, while margarines have increased by 45 per cent in the same period to 25 grams. Oils accounted for nearly a third of all fat purchases, with average weekly purchases of 43 mls.
Go to Family Food 2016/17: Expenditure
Go to Family Food 2016/17: Purchases