Family Food 2016/17: Expenditure
Published 26 April 2018

© Crown copyright 2018
This publication is licensed under the terms of the Open Government Licence v3.0 except where otherwise stated. To view this licence, visit nationalarchives.gov.uk/doc/open-government-licence/version/3 or write to the Information Policy Team, The National Archives, Kew, London TW9 4DU, or email: psi@nationalarchives.gov.uk.
Where we have identified any third party copyright information you will need to obtain permission from the copyright holders concerned.
This publication is available at https://www.gov.uk/government/statistics/family-food-201617/expenditure
1. Expenditure
1.1 Overview
This chapter provides estimates of household and eating out expenditure on food in 2016/17, alongside analyses of changes in household shopping behaviour in response to food price inflation in recent years.
Using comparisons between low income households and all households it is possible to examine the greater effects food price rises may have on vulnerable groups in society. Low income is one of many reasons to be vulnerable in society but this group is used here as a proxy. In the context of this chapter, low income households are identified as those within the lowest twenty per cent of households by equivalised income, a measure of household income that accounts for differences in household size and composition.
Financial year estimates
The latest results cover the financial year 2016/17, in line with the parent survey for Family Food (see the ONS Family Spending report), which switched to financial year reporting for 2015/16 onwards. Comparisons between financial year estimates and previous calendar year ones are valid since both cover a full year of shopping activity. Generally Family Food exposes long term trends in consumer behaviour and year on year differences are not especially relevant. In the detailed datasets we have provided indicative estimates for 2015/16 as well as the previously published 2015 calendar year estimates, for comparison.
-
In 2016/17 the amount that an average household spent on all food and drink, including alcoholic drinks and food eaten out was £43.18 per person per week. When inflation is taken into account, the amount spent was 1.1 per cent more than 2015 and 0.1 per cent more than 2013. Household food and non-alcoholic drink purchases formed the largest share at £26.34 per person per week.
-
In 2016/17 the percentage of spend on food and non-alcoholic drinks for the average UK household was 10.5 per cent, continuing the downward trend since 2011.
-
The percentage of spend on food continues to be highest for households with the lowest 20 per cent of income, at 14.3 per cent in 2016/17, although the gap is the closest it has been in the period shown in this release. Food is the largest item of household expenditure for low income households, after housing, fuel and power costs.
-
On average households ‘traded up’ to more expensive products by 4.4 per cent on the unit prices paid for food between 2014 and 2016/17. This was possible due to price decrease of 4.4 per cent. The lowest income households still traded up, but to a much lesser extent.
-
The average household spent 0.3 per cent more on food in 2016/17 than in 2014, when prices were at their highest during the last 10 years. Households in the lowest income decile spent 4.1 per cent less than in 2014.
1.2 Food classification and results tables
Family Food classifies food items into a hierarchical coding scheme of approximately 500 different food codes. Full details of how food is coded and where it fits into the scheme are available in the methodology paper ‘Food and drink codes’. Because of space limitations, the data tables in this report generally only show selected food and drink items within the main categories. The accompanying spreadsheet datasets show results for the full list of codes, going back in most cases to 2001 and in some cases back to 1974. Historical estimates going back to 1940 in some cases are available from The National Archives.
1.3 Household spending on food
The average weekly expenditure in actual prices (not adjusted for inflation) on all household food and drinks in 2016/17 was £29.71 per person, an increase of 1.6 per cent on 2015. Total expenditure on household food and non-alcoholic drink increased by 1.6 per cent in 2016/17 to £26.34 and was 1.0 per cent lower than in 2013. There has been a significant upward trend in expenditure on all food and drink between 2012 and 2015, however household food and drink expenditure has decreased in that period by 0.5 per cent, while expenditure on food and drink eaten out has increased significantly by 9.4 per cent.
Chart 1.1: UK average expenditure on food and drink, per person per week, 2016/17
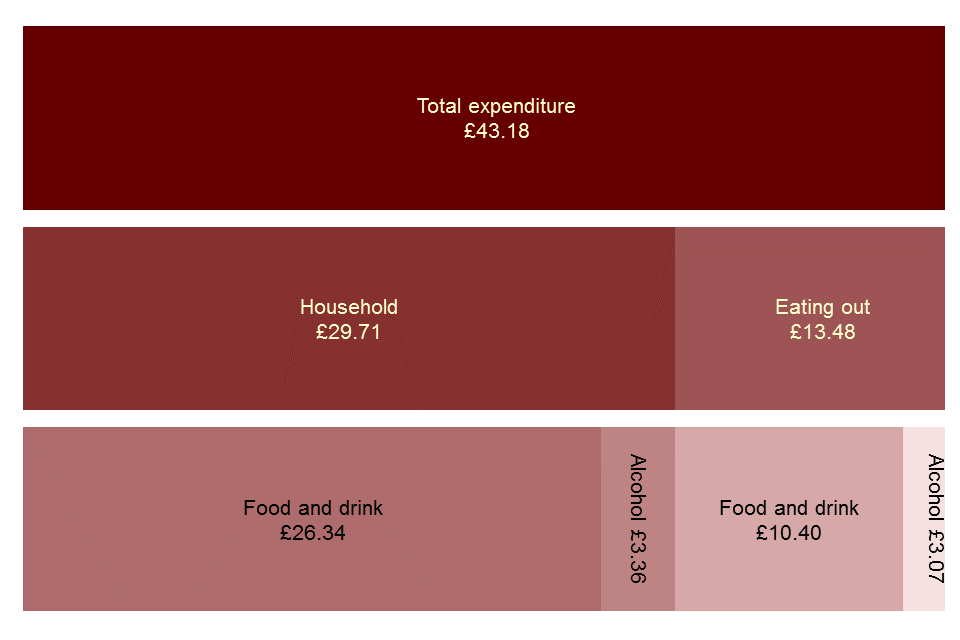
Family Food Chart 1.1 UK average expenditure on food and drink, per person per week
Data for this chart is in the UK expenditure dataset, downloadable here.
1.4 Trends in spending in real terms
Table 1.1 shows expenditure in real terms, with the values adjusted to remove the effects of inflation. The figures are derived by deflating expenditure at current prices by the all items Consumer Price Index. In 2016/17, households spent the equivalent of £26.34 per person per week on household food and non-alcoholic drink.
The Consumer Price Index (CPI) rose by 0.7 per cent between 2015 and 2016 and by 2.2 per cent between 2013 and 2016. Removing this overall rise in prices from the changes in expenditure on food and drink shows how expenditure in real terms has changed.
Since 2013, expenditure on household food and non alcoholic beverages in real terms has fallen by 3.2 per cent and eating out expenditure has risen by 9.5 per cent. Spending on alcoholic drinks for household consumption rose by 1.5 per cent over the same period, whilst alcoholic drinks bought for consumption outside the home dropped by 0.5 per cent.
Context: Food Prices
Food prices rose sharply during the economic crash in 2008, and in subsequent years, food price inflation was generally higher than overall inflation. Food prices are driven by a number of factors, but international commodity and oil prices and exchange rates are significant ones.
In 2014 the food price inflation rate (as measured by the Consumer Price Index) fell below overall inflation, and food prices actually started to fall as inflation fell below 0% for the first time since 2006. This trend continued throughout 2015 and 2016, but food prices began to increase again at the start of 2017.
In this chapter there are analyses of households’ responses to changes in food prices, including ‘trading down’ to cheaper products of the same type, and buying less. Family Food estimates generally show trends over the long term and short term spikes or depressions are smoothed out in the annual results. If the current short term picture with prices continues, as the sharp increases from 2007 did, then we can expect to see this reflected in shopping behaviour in future years.
Table 1.1: UK expenditure on food and drink in real terms, 2016(a)
| 1995(b)(c) | 2007 | 2008 | 2009 | 2010 | 2011 | 2012 | 2013 | 2014 | 2015 | 2016/17 | % change since 2015 | % change since 2013 | |
|---|---|---|---|---|---|---|---|---|---|---|---|---|---|
| CPI (2015 = 100) | 67 | 82 | 85 | 87 | 89 | 93 | 96 | 99 | 100 | 100 | 101 | ||
| Household expenditure on all food and drink | 27.63 | 30.71 | 30.46 | 31.10 | 31.06 | 30.18 | 30.69 | 30.53 | 29.77 | 29.45 | 29.71 | 0.9% | -2.7% |
| Expenditure on all food and drink eaten out | 8.74 | 13.99 | 13.32 | 13.18 | 13.13 | 12.87 | 12.66 | 12.59 | 12.49 | 13.28 | 13.48 | 1.5% | 7.1% |
| Total expenditure on all food and drink | 36.36 | 44.71 | 43.78 | 44.28 | 44.19 | 43.05 | 43.35 | 43.12 | 42.26 | 42.72 | 43.18 | 1.1% | 0.1% |
| Household expenditure on food and non-alcoholic drinks | 24.94 | 27.25 | 27.35 | 27.75 | 27.60 | 26.87 | 27.22 | 27.22 | 26.45 | 26.11 | 26.34 | 0.9% | -3.2% |
| Expenditure on food and non-alcoholic drinks eaten out | 6.46 | 9.80 | 9.71 | 9.60 | 9.62 | 9.48 | 9.38 | 9.50 | 9.48 | 10.07 | 10.40 | 3.3% | 9.5% |
| Expenditure on all food and non-alcoholic drinks | 31.39 | 37.06 | 37.06 | 37.35 | 37.21 | 36.34 | 36.60 | 36.72 | 35.93 | 36.18 | 36.75 | 1.6% | 0.1% |
| % eaten out | 21% | 26% | 26% | 26% | 26% | 26% | 26% | 26% | 26% | 28% | 28% | 0.0% | |
| Household expenditure on alcoholic drinks | 2.69 | 3.46 | 3.12 | 3.36 | 3.46 | 3.32 | 3.46 | 3.31 | 3.32 | 3.34 | 3.36 | 0.7% | 1.5% |
| Expenditure on alcoholic drinks eaten out | 2.28 | 4.19 | 3.61 | 3.58 | 3.51 | 3.39 | 3.29 | 3.09 | 3.01 | 3.20 | 3.07 | -4.1% | -0.5% |
| Expenditure on all alcoholic drinks | 4.97 | 7.65 | 6.73 | 6.94 | 6.98 | 6.71 | 6.75 | 6.40 | 6.33 | 6.54 | 6.44 | -1.6% | 0.5% |
| % eaten out | 46% | 55% | 54% | 52% | 50% | 51% | 49% | 48% | 48% | 49% | 48% |
(a) £ per person per week
(b) Great Britain only.
(c) Estimates on eating out in 1995 are based on National Food Survey which was considered less reliable.
1.5 Indicator of affordability of food
The relative affordability of food can be measured by the share of the household budget going on food, i.e. the percentage of total household spending that goes on household food purchases. If the percentage increases over time, food is placing a greater burden on spending. Low income households are of particular concern because they tend to have a greater percentage of spend going on food.
Table 1.2: Percentage of spend on food and non-alcoholic drinks
| Lowest 20% by equivalised income | All UK households | |
|---|---|---|
| 2006 | 15.6 | 10.3 |
| 2007 | 15.2 | 10.5 |
| 2008 | 16.8 | 10.8 |
| 2009 | 16.1 | 11.5 |
| 2010 | 15.8 | 11.2 |
| 2011 | 16.6 | 11.3 |
| 2012 | 16.2 | 11.6 |
| 2013 | 16.1 | 11.4 |
| 2014 | 16.4 | 11.1 |
| 2015/16 | 16.0 | 10.7 |
| 2016/17 | 14.3 | 10.5 |
In the UK, an average 10.5 per cent of household spend went on food in 2016/17, while for the lowest 20 per cent of households by equivalised income it was higher at 14.3 per cent. Engel’s law is an observation in economics stating that as income rises the proportion of income spent on food falls, even if actual expenditure on food rises. Although these estimates are of proportion of expenditure not income, they are consistent with that observation.
Although the percentage of spend on food remains relatively constant, the actual amount spent, and the products purchased will change in response to relative prices. In 2016/17, the average food price inflation, measured by the CPI, was negative (i.e. food prices were falling) at -1.7 per cent, although this began to increase at the end of the year.
1.6 Effects of food price rises
Food prices from 2014 to 2016/17
Food and non alcoholic beverage prices began rising from about July 2006, peaking in August 2008, before steadying at a new higher level until early 2014. Prices then decreased every month until early 2017 when prices began to go up again.
On average, food and non alcoholic beverage prices fell by 1.7 per cent in 2016/17, below the all items rate of inflation which increased by 1.1 per cent, as measured by the Consumer Price Index. Food and non alcoholic beverages price inflation only rose above zero for two months of 2016/17, while all items inflation was consistently above zero in 2016/17.
Trading Down, Buying Less and Spending More
Households can react in many ways to food price increases - they may simply spend more, or buy less of a type of product. They may also ‘trade down’ by switching to purchases of cheaper products within a food grouping (see glossary for more detail). Family Food provides evidence based estimates of changes in shopping behaviour in response to higher prices.
For foods within a given food category, price changes are measured by the Retail Price Index, which contains a lower level of detail on food types than the Consumer Price Index or CPIH . Family Food measures the average price or unit price that households have paid for foods within a food code. The difference between the rise in price and the rise in unit price paid provides a way of estimating trading down. This is calculated by dividing (deflating) the rise in price paid by the actual rise in price for each food code.
Table 1.3 shows how consumers have reacted to price rises between 2014 and 2016/17 for different types of food and drink, including estimates of trading down. The table shows the true change in price and how the consumer has responded to this by a combination of buying less, spending more and trading down.
Table 1.3 Consumers’ response to food price rises 2014 to 2016/17
| Price rise since 2014 | Quantity purchased, All households | Quantity purchased, Income decile 1 | Expenditure, All households | Expenditure, Income decile 1 | Trading Down(a) (deflated unit value), All households | Trading Down(a) (deflated unit value), Income decile 1 | |
|---|---|---|---|---|---|---|---|
| Food | -4.4 | 0.6 | -1.1 | 0.3 | -4.1 | 4.4 | 1.4 |
| Bread | -9.3 | -4.1 | 0.2 | -4.9 | -7.9 | 9.4 | 1.2 |
| Cereals | -4.9 | -0.0 | -11.6 | 5.5 | -9.1 | 10.9 | 8.0 |
| Biscuits & cakes | -0.1 | 3.2 | 12.9 | 2.5 | 13.3 | -0.5 | 0.6 |
| Beef | -2.9 | 0.3 | -19.2 | -2.8 | -14.6 | -0.1 | 8.9 |
| Lamb | -0.1 | -37.1 | -44.4 | -28.9 | -18.9 | 13.2 | 46.0 |
| Pork | -7.6 | -12.7 | 0.0 | -18.2 | -11.9 | 0.2 | -4.7 |
| Bacon | -11.3 | -0.7 | 13.1 | -8.3 | -12.8 | 4.1 | -13.1 |
| Poultry | -11.8 | 2.3 | 1.9 | -1.6 | 0.6 | 9.3 | 12.0 |
| Fish | -5.0 | -5.1 | -22.9 | -2.5 | -1.8 | 6.7 | 12.8 |
| Butter | -8.1 | -13.6 | 12.1 | -21.4 | 0.3 | -1.0 | -2.6 |
| Cheese | -6.1 | 8.6 | 5.9 | 0.7 | -6.6 | -1.2 | -6.1 |
| Eggs | -16.0 | 4.4 | 0.3 | -4.8 | -20.4 | 7.7 | -6.2 |
| Milk | -8.7 | -1.5 | -4.9 | -2.4 | -5.9 | 8.8 | 7.9 |
| Tea | -2.8 | -1.1 | -41.5 | -4.8 | -49.0 | -0.9 | -9.9 |
| Coffee & hot drinks | -0.9 | 5.7 | -21.8 | 8.1 | -17.3 | 3.1 | 7.0 |
| Soft Drinks | -3.2 | 5.3 | 19.0 | -1.3 | 2.9 | -3.2 | -10.9 |
| Sugar & preserves | -9.9 | -4.1 | -6.8 | -6.5 | -9.2 | 7.7 | 8.2 |
| Sweets & chocolates | -1.9 | -0.1 | -8.6 | 1.3 | -9.9 | 3.4 | 0.5 |
| Potatoes | -7.9 | -7.0 | -12.3 | -13.0 | -14.2 | 2.3 | 4.3 |
| Vegetables | -7.8 | 3.2 | -9.5 | -0.2 | -14.1 | 4.5 | 3.3 |
| Fruit | 1.2 | 1.9 | 6.5 | 9.2 | 6.9 | 5.9 | 3.8 |
| of which fresh fruit | 1.0 | 4.5 | 8.8 | 11.3 | 3.9 | 5.5 | 0.8 |
| Alcoholic drinks | 1.1 | 3.7 | 49.2 | 2.0 | 55.1 | -2.7 | 2.7 |
(a) a positive value indicates trading up
For example, for eggs there was a decrease in expenditure of 4.8 per cent for all households. Quantity of eggs purchases increased by 4.4 per cent and all households increased their unit price paid (traded up) by 7.7 per cent. Thus the dominant response to the 16 per cent price drop of eggs between 2014 and 2016/17 was to spend more money on purchases of eggs.
Table 1.3 shows that on average UK households purchased 0.6 per cent more food in 2016/17 than in 2014 while spending 0.3 per cent more. Households in income decile 1 (lowest income group) spent 4.1 per cent less on food in 2016/17 than in 2014 and purchased 1.1 per cent less.
Prices were at their highest point in recent years in 2014 and since then have decreased. Therefore, with prices going down people were able to trade up from the products they were buying in 2014. So even though households in income decile 1 were spending and purchasing less than in 2014, they have been able to trade up due to the price decrease. It may also be that due to the price increases prior to 2014 (35 per cent since 2007) that people are trading back up to products they used to buy before the price increases. The trading down analysis does not capture instances where expenditure is switched to a completely different food type.
-
On average UK households spent 5.5 per cent more on cereals in 2016/17 than in 2014 for the same amount of product. They benefited from the price decrease of 4.9 per cent as this enabled them to trade up by 10.9 per cent.
-
Since 2014 households in decile 1 (lowest income group) have increased their consumption of alcoholic drinks by 49 per cent and their expenditure by 55 per cent. The consumption is a similar level to 2008, so it may be that people are taking advantage of the general drop in food prices since 2014 to go back to buying levels of alcohol that they did in 2008.
-
UK households have bought noticeably less lamb, pork, fish, butter and potatoes since 2014. They have bought more cheese, coffee and hot drink and soft drinks.
-
Since 2014 households in decile 1 (lowest income group) have bought less beef, lamb, fish, tea, coffee and hot drinks and potatoes. They have bought more biscuits and cakes, bacon, butter, soft drinks and alcoholic drinks.
-
UK households have not traded down on any items since 2014. Households in decile 1 have traded down on bacon, cheese, eggs, tea and soft drinks.
Go to Family Food 2016/17: Summary
Go to Family Food 2016/17: Purchases