Enterprise Investment Scheme, Seed Enterprise Investment Scheme and Social Investment Tax Relief: Commentary 2021
Published 27 May 2021

© Crown copyright 2021
This publication is licensed under the terms of the Open Government Licence v3.0 except where otherwise stated. To view this licence, visit nationalarchives.gov.uk/doc/open-government-licence/version/3 or write to the Information Policy Team, The National Archives, Kew, London TW9 4DU, or email: psi@nationalarchives.gov.uk.
Where we have identified any third party copyright information you will need to obtain permission from the copyright holders concerned.
This publication is available at https://www.gov.uk/government/statistics/enterprise-investment-scheme-seed-enterprise-investment-scheme-and-social-investment-tax-relief-may-2021/enterprise-investment-scheme-seed-enterprise-investment-scheme-and-social-investment-tax-relief-commentary-2021
1. Main points and summary
1.1 Enterprise Investment Scheme
-
Since the Enterprise Investment Scheme (EIS) was launched in 1994, 32,965 companies have received investment and around £24 billion of funds have been raised.
-
In 2019 to 2020, 4,215 companies raised a total of £1,905 million of funds under the EIS scheme. Funding has increased from 2018 to 2019, when 4,060 companies raised £1,867 million.
-
In 2019 to 2020, a total of £466 million of investment was raised by the 1,500 companies raising funds under the EIS scheme for the first time.
-
In 2019 to 2020, companies recorded as from the Information and Communication accounted for £630 million of investment (33% of all EIS investment).
-
Companies registered in London and the South East accounted for the largest proportion of investment, raising £1,267 million (66% of all EIS investment) in 2019 to 2020.
1.2 Seed Enterprise Investment Scheme
-
Since the Seed Enterprise Investment Scheme (SEIS) was launched in 2012 to 2013, 13,800 companies have received investment and around 1.4 billion of funds have been raised.
-
In 2019 to 2020, 2,090 companies raised a total of £170 million of funds under the SEIS scheme. This is a slight decrease from 2018 to 2019 when 2,125 companies raised £171 million.
-
1,620 of the companies were raising funds under the SEIS scheme for the first time in 2019 to 2020, representing £145 million of investment.
-
In 2019 to 2020, companies recorded as from the Information and Communication sector accounted for £62 million (37% of all SEIS investment).
-
Companies registered in London and the South East accounted for the largest proportion of investment, raising £106 million (63% of SEIS investment) in 2019 to 2020.
1.3 Social Investment Tax Relief
-
Since SITR was launched in 2014 to 2015, social enterprises have raised funds of £15.8 million through the scheme.
-
In 2019 to 2020, 30 social enterprises received investment through the Social Investment Tax Relief (SITR) scheme, and £3.3 million of funds were raised. This is a decrease from 2018 to 2019, when 45 enterprises raised £4.7 million.
1.4 Advance assurance requests
EIS
-
Since 2006 to 2007, there have been a total of 36,905 advance assurance request (AAR) applications received for EIS, and of these 30,205 (82%) have been approved.
-
In 2020 to 2021, 3,080 AAR applications for EIS were received and 2,380 (77%) approved. This is a decrease from 2019 to 2020 when 3,440 AAR applications were received and 2,665 (77%) approved.
SEIS
-
Since 2012 to 2013, there have been a total of 25,365 AAR applications received for SEIS, and of these 20,790 (82%) have been approved.
-
In 2020 to 2021, 2,900 AAR applications for SEIS were received and 2,355 (81%) approved. This is an increase from 2019 to 2020, when 2,755 AAR applications were received and 2,120 (77%) approved.
SITR
-
Since 2014 to 2015, there have been a total of 475 AAR applications received for SITR, and of these 310 (65%) have been approved.
-
In 2020 to 2021, 40 AAR applications for SITR were received, and 30 (72%) approved. This has remained consistent from 2019 to 2020 when 40 AAR applications were received and 30 (71%) approved.
2. Introduction
2.1 About these statistics
This is a National Statistics publication produced by HM Revenue and Customs (HMRC). It provides information on the number of companies raising funds, the number of subscriptions and the amounts raised through the Enterprise Investment Scheme (EIS) and Seed Enterprise Investment Scheme (SEIS).
It also includes Official Statistics on social enterprises raising funds through the Social Investment Tax Relief (SITR) scheme. The EIS, SEIS and SITR are 3 of 4 tax-based venture capital schemes, the other being the Venture Capital Trust (VCT) scheme.
The current release includes the first estimates for 2019 to 2020. The figures for 2017 to 2018 and 2018 to 2019 include small revisions and minor updates, arising from the receipt of a small number of further EIS1 and SEIS1 forms for these years.
Companies have a period of 3 years after shares are issued to submit a compliance statement. This year, we have introduced an uplift factor for figures from 2018 to 2019 onwards to take account of late returns submitted by companies. Thus, these figures should be treated as provisional and will be subject to revisions in future publications.
Section 1 summarises the main statistical points; Sections 3, 4, and 5 presents an overview of the statistics and discusses recent trends. In Section 6, this release includes updated estimates for AAR. As part of the qualifying process for seeking investment through the schemes, companies can provide a return to HMRC in advance of a share issue to check that it will meet the qualifying conditions for these conditions for these schemes.
The statistical tables are included on the main publication page.
The next release is planned to be in Spring 2022.
People interested in this publication may also be interested in the National Statistics publication on Venture Capital Trusts (VCT).
3. Enterprise Investment Scheme (EIS)
3.1 EIS: Number of EIS companies and amount of investment
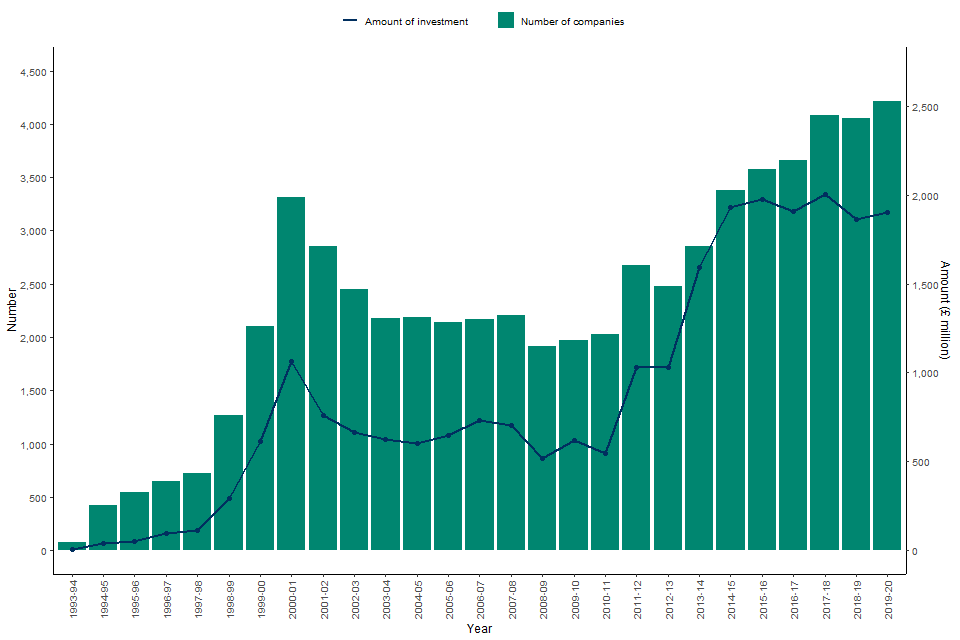
Since the EIS was launched in 1994, 32,965 individual companies have received investment through the scheme, and around £24 billion of funds have been raised. The data used here come from EIS: Table 8.1, where information dating back to 1993 to 1994 can be found.
The number of companies raising funds and the level of investment have shown similar trends since the EIS was introduced. In 2019 to 2020 the number of companies raising funds increased to 4,215, raising a total of £1,905 million. Since the last publication, 2018 to 2019 figures have been revised upwards.
There has been a steady increase in EIS use since 2010, which could be due to sustained historically low interest rates, increasing promotion and involvement of fund managers.
In addition, the increase in Income Tax relief from 20% to 30% in 2011 to 2012 and the introduction of the Feed in Tariffs (FIT) initiative from April 2010 (resulting in large amounts of investment into the renewable energy sector) both attracted EIS investment. In 2012 to 2013, most trades attracting FIT were excluded from eligibility for the EIS and most companies benefiting from alternative Department for Energy and Climate Change (DECC) subsidies were excluded from July 2014.
The increase in the annual EIS investment limit for companies to £5 million from 2012 to 2013 attracted significant investment. The amount of funds raised almost doubled in the tax years ending 2013 to 2015. Subsidised energy activities were progressively excluded from eligibility for the EIS from April 2015, and all energy activities were excluded from April 2016.
Further limits on eligible companies were introduced from November 2015, including age limits and funding limits, and a new growth and development requirement. Despite these measures, investment in the EIS continued to increase up to 2017 to 2018.
As part of the government’s Patient Capital Review, a new risk-to-capital condition was introduced in 2018. This was intended to remove investment arrangements based on capital preservation and ensure that the EIS and other tax-advantaged venture capital schemes are focused on investment in early-stage companies that have the intention to grow and develop in the longer term.
The figures for 2018 to 2019 suggest a small decrease in the amount of EIS investment compared to the previous year which may be as a result of the introduction of the new condition.
The data for 2018 to 2019 onwards include investment in knowledge intensive companies (KICs). Companies that qualify as knowledge intensive (KI) at the time of share issue can make use of increased annual and lifetime funding limits, £10 million and £20 million respectively, and these KICs can receive their first EIS or other risk finance investment up to 10 years from first commercial sale, as opposed to the normal limit of 7 years.
These rules were first introduced in November 2015 and further extended in April 2018. The combination of these increased limits and the focus on growth of the risk-to-capital measure is expected to result in more funds being raised through the EIS in future years in these innovative companies.
Figure 1: Number of companies raising funds and amount raised, April 1993 to 2020
3.2 EIS: New investment
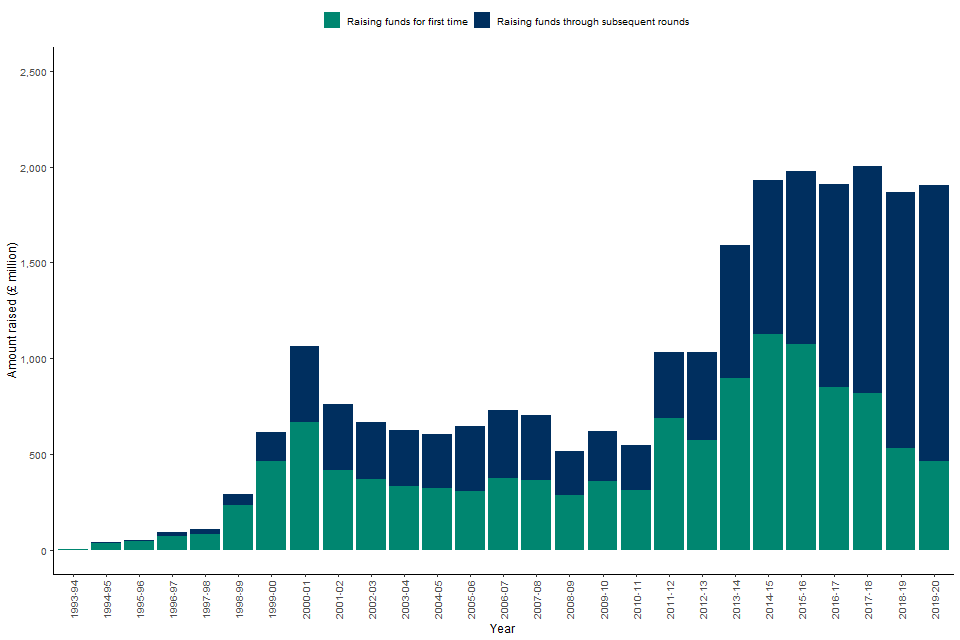
The majority of investment through the scheme (51%) since the launch of the EIS has been investment into companies raising EIS funds for the first time. However, the proportion of investment into new companies compared to that for companies raising further funding has declined since the peaks in 2011 to 2012 and 2014 to 2015. This coincides with the investment in renewable energy and the progressive exclusion of these activities from the EIS, as noted above.
In 2018 to 2019, there was a large drop in funds raised by new companies with only 24% of funding being raised by companies using the EIS for the first time. This decrease is likely to be due to the introduction of the risk-to-capital condition which places further restrictions on the qualification of investment under the EIS.
These restrictions were introduced to ensure that investment under the EIS is genuinely at risk and is made with the intention of providing long-term growth and development of the company’s trade.
Those low-risk and limited growth investment arrangements targeted by the new condition typically involved the creation of new companies raising funds for the first time. A proportion of this investment is expected to be reinvested elsewhere and, with the new incentives to invest in knowledge intensive companies, this would result in increased investment in these companies.
Figure 2: Amount of funds raised under the EIS by new companies and old companies, April 1993 to 2020
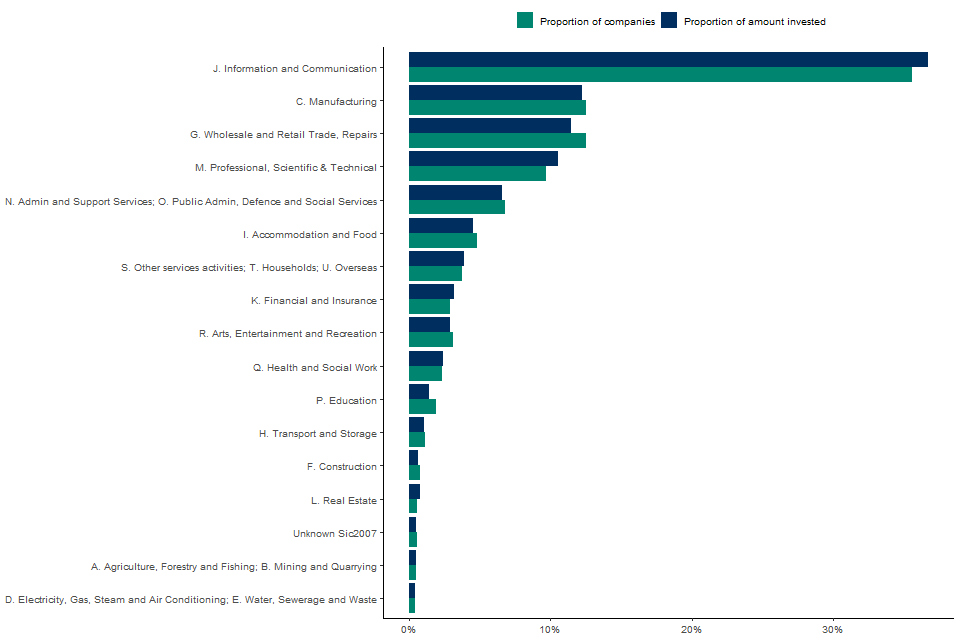
3.3 EIS: Industry Sector
In 2019 to 2020, companies from just 4 sectors (the Manufacturing, the Wholesale and Retail Trade, Repairs, the Information and Communication, the Professional, Scientific and Technical sectors) together accounted for around £1,352 million of investment and made up 71% of all EIS Investment. This is a higher proportion than the 2018 to 2019 figures.
The highest number of companies receiving EIS investment in 2019 to 2020 was also in these 4 categories, which represent 72% of the total number of companies receiving investment through the EIS. This is similar to the figures for 2018 to 2019.
Figure 3: The percentage distribution of EIS investment and number of EIS companies, by SIC2007 industry sector, 2019 to 2020

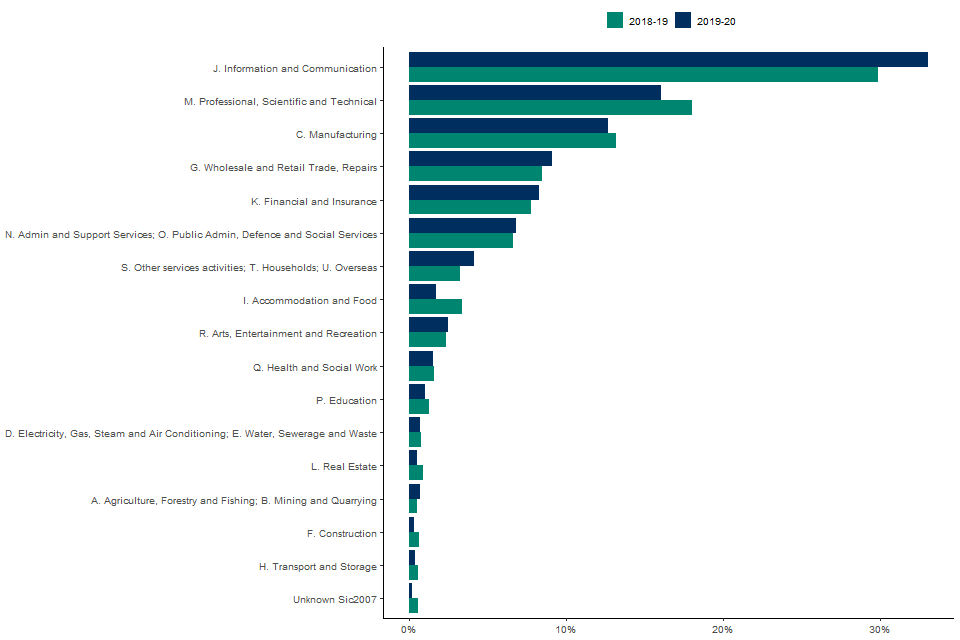
The graph below compares the proportion of investment across sectors, by amount, raised under the EIS between 2018 to 2019 and 2019 to 2020. The trends for the 2 years are similar, with a decrease in the Professional, Scientific and Technical sector but an increase in the Information and Communication sector.
Figure 4: Comparison between amounts of funds raised under the EIS by different industry sectors, April 2018 to 2020
The sector breakdowns in this section are based on the Standard Industrial Classification (SIC) 2007. It should be noted that the most recent SIC data available has been used and some companies could have changed their trade since submitting their EIS1 forms. SIC codes are also self-selected, and we must assume that companies have selected the right code.
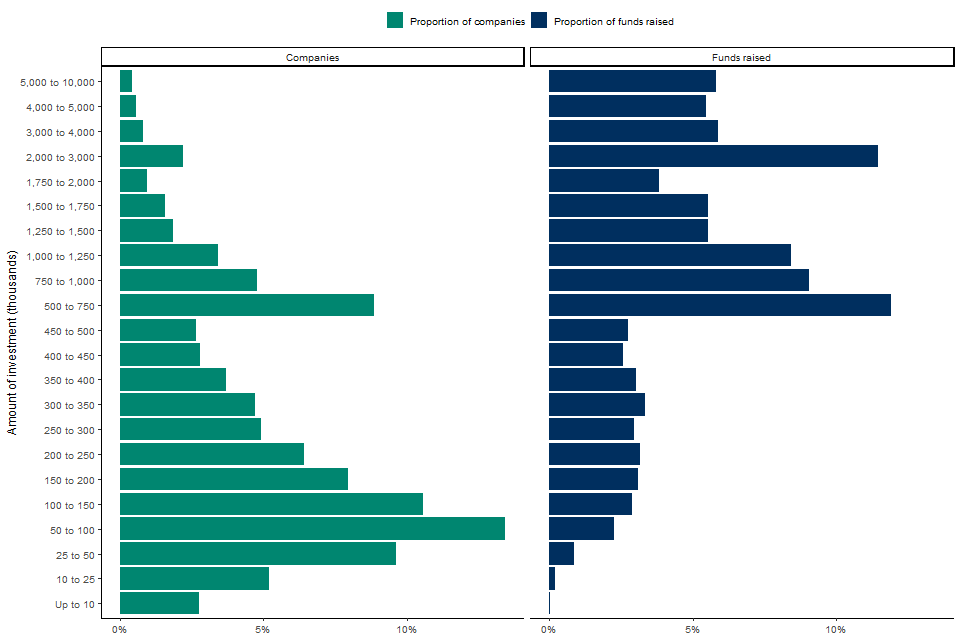
3.4 EIS: Size of investment per company
The distribution of the number of companies raising money under the EIS by investment size differs from the distribution of amount of funds raised by size of investment. A large proportion of companies receive relatively small investments, with 42% (1,685) of companies receiving investments of £150,000 or less in 2019 to 2020. This is a similar proportion to previous years.
For larger investments, in 2019 to 2020, 29% of the amount of funds was concentrated in investments above £2 million, with 11% going to investments over £4 million. It is likely that the risk-to-capital condition will have affected these higher investment categories in particular.
Since 2012 to 2013 the annual limit on investment has been £5 million. From 2018 to 2019 onwards this has been increased to £10 million for KICs.
Figure 5: Distribution of the proportion of funds raised under the EIS by investment band, 2019 to 2020
3.5 EIS: Geographical region of company registration
The proportion of the amount of investment in companies registered in London and the South East was 66% in 2019 to 2020. This proportion is similar to recent years.
The data used in this section come from EIS: Table 8.4.
Figure 6: Distribution of the number of EIS companies and amount of investment by location, 2019 to 2020

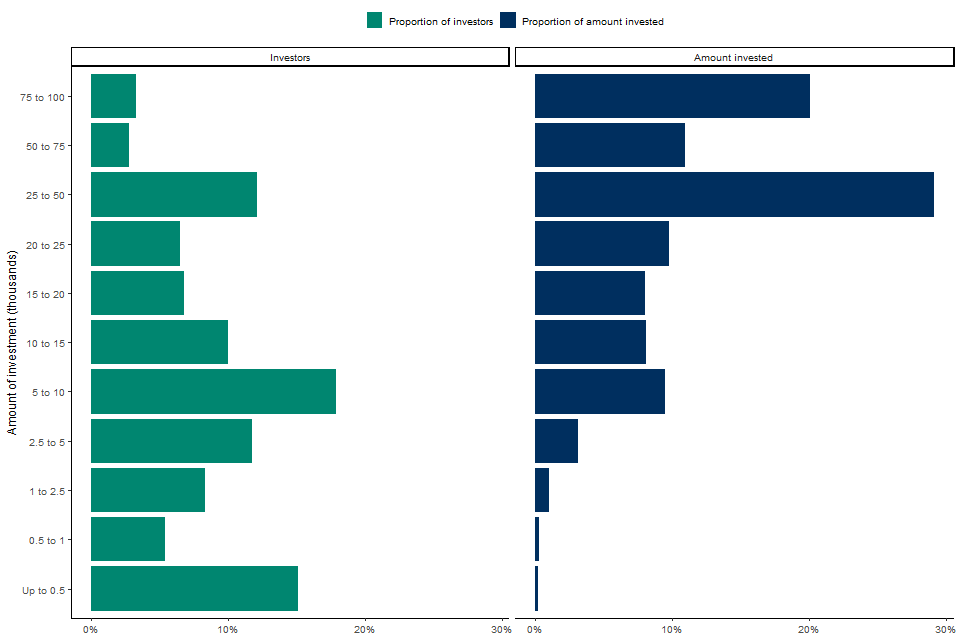
3.6 EIS: Investors claiming Income Tax relief under EIS
The number of investors claiming Income Tax relief on Self Assessment forms under the EIS has decreased, from 37,955 in tax year ending 2019 to 36,950 in 2020. However, these figures are provisional and likely to be revised as more returns are received by HMRC.
The majority of investors claiming Income Tax relief tend to invest smaller amounts of money into companies qualifying for EIS. In 2019 to 2020, 83% of EIS investors made a claim for tax relief in respect of an investment of £50,000 or less. This is similar to the levels seen in 2018 to 2019.
In 2018 to 2019, new limits were introduced for investments in KICs. These allow individuals to invest up to £2 million in a year if they are investing in a KIC. There were 65 investments of between £1 million and £2 million in 2019 to 2020, contributing £100 million of investment. With the higher limit available, investments of over £500,000 comprised 18% of the total amount of EIS investment raised on which claims were made in 2019 to 2020.
Figure 7: Proportion of investors and amount of investment, by size of investment (investment on which Income Tax relief was claimed), 2019 to 2020
The data used in this section come from EIS: Table 8.5. Total figures provided in EIS: Table 8.5 on the amount of investment on which Income Tax relief was claimed are not directly comparable with the figures in EIS: Table 8.1 on the amount of investment reported by companies. Some investors may choose to offset the tax liability against the previous year. A small amount of relief would also be claimed through the PAYE system; this is assumed to relate to about 5% of total EIS investment.
4. Seed Enterprise Investment Scheme
4.1 SEIS: Number of SEIS companies and amount of investment
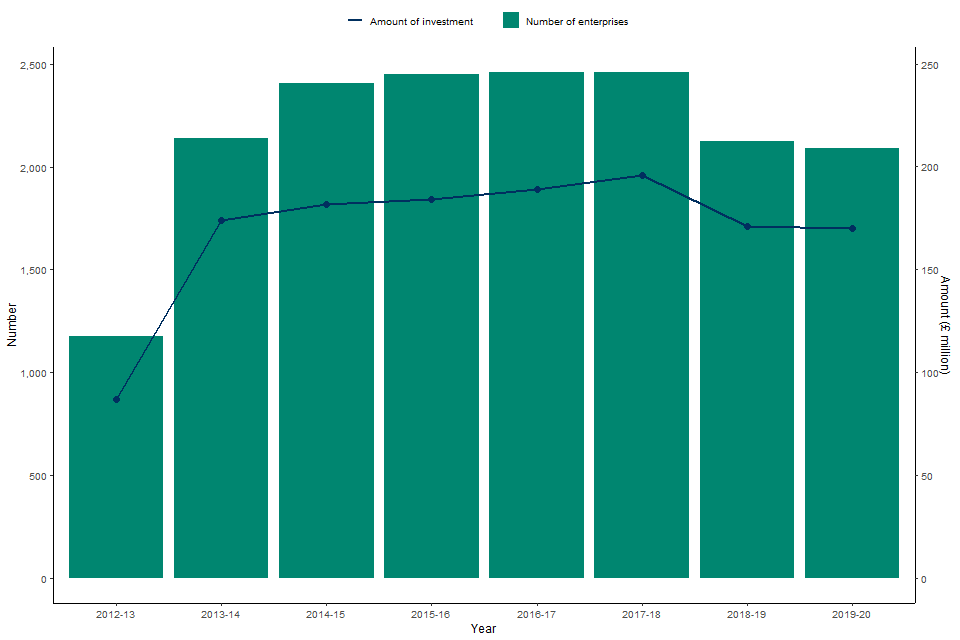
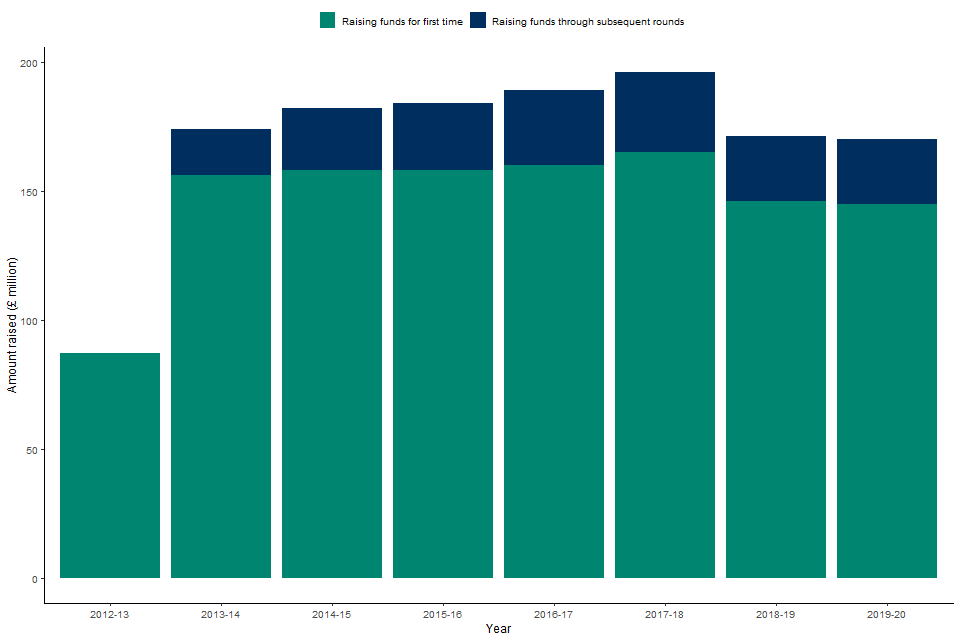
In 2019 to 2020, data show that 2,090 companies received investment through the Seed Enterprise Investment Scheme (SEIS) and funds worth £170 million were raised (Figure 8). Around 1,600 of these companies were raising funds under SEIS for the first time, raising a total of £145 million in investment (Figure 9). The average investment per company under SEIS in 2019 to 2020 was around £81,000.
The total amount of SEIS investment in 2019 to 2020 is lower than the previous year’s figures. The risk-to-capital condition introduced a requirement for growth and development to the SEIS for the first time, and it is expected that this will have had a short-term impact before the industry adjusts. However, note that the 2019 to 2020 figures are likely to be revised as more returns are received by HMRC, so this trend may change the next time the figures are published with these returns included.
Figure 8: Number of companies raising funds and amount raised, April 2012 to 2020
4.2 SEIS: New investment
Since the SEIS was launched in 2012 to 2013, 13,800 individual companies have received investment through the scheme and £1.4 billion of investment has been raised.
The data used in this section come from SEIS: Table 8.11.
Figure 9: Amount of funds raised by new and old SEIS companies, April 2012 to 2020
4.3 SEIS: Industry sector
In 2019 to 2020, companies from just one sector (the Information and Communication) accounted for £62 million of investment, which makes up 37% of the amount of SEIS investment received. The next 3 largest sectors (the Manufacturing, the Wholesale and Retail Trade, Repairs, the Professional, Scientific & Technical sectors) together account for 34% of investment.
The largest number of companies receiving SEIS investment in 2019 to 2020 were also in the Information and Communication sector, representing 36% of the total number of companies receiving investment through SEIS.
The data used in this section come from SEIS: Table 8.12.
Figure 10: The percentage distribution of the number of SEIS companies and amount of investment, by SIC2007 industry sector, 2019 to 2020
The distribution of SEIS investment by industry sector in 2019 to 2020 is similar to 2018 to 2019 (Figure 11), with an increase in the Information and Communication sector.
Figure 11: Comparison between the proportion of funds raised under the SEIS by different industry sectors, April 2018 to 2020

4.4 SEIS: Size of investment per company
The majority of companies receive investments of over £50,000 through the SEIS, with 63% of companies receiving investment of over £50,000 in 2019 to 2020. This is a similar proportion to previous years. The proportion of companies and investments show a similar trend by investment band.
The data used in this section come from SEIS: Table 8.13.
Figure 12: The percentage distribution of funds raised under the SEIS by investment band, 2019 to 2020

4.5 SEIS: Geographical region of company registration
The largest proportion of funds raised under the SEIS were through companies registered in London and the South East. In 2019 to 2020, these regions accounted for 63% of SEIS investment (Figure 13), which is similar to previous years. The geographical distribution of SEIS investments is based on the registered address of the company raising funds. This address may place the company in a different region from the region in which the business activity is carried out. Therefore, caution should be exercised in interpreting these data.
The data used in this section come from SEIS: Table 8.14.
Figure 13: The percentage distribution of the number of SEIS companies and amount of investment by location, 2019 to 2020

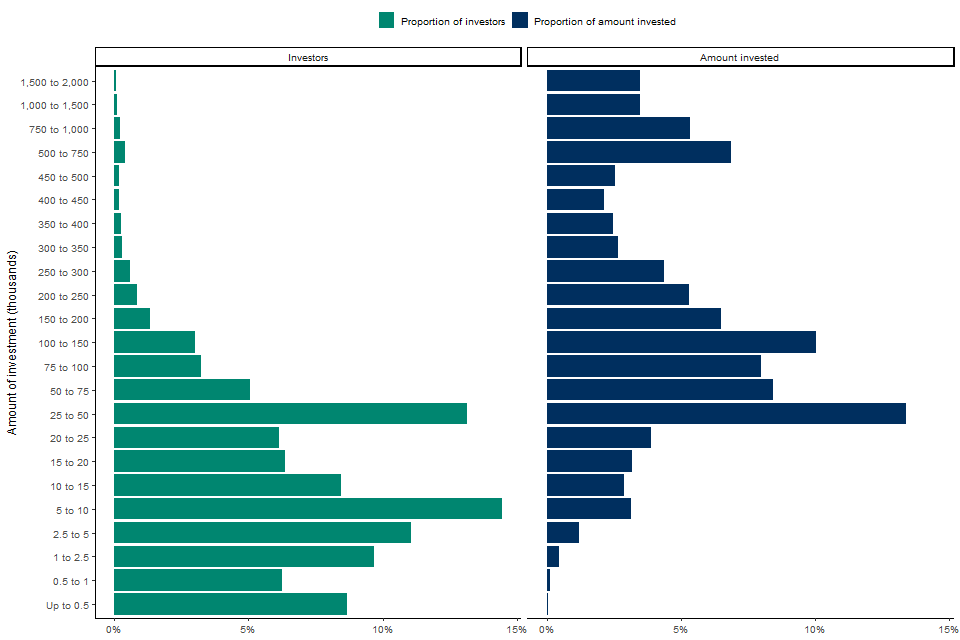
4.6 SEIS: Investors claiming Income Tax relief under SEIS
In 2019 to 2020, 8,665 investors claimed Income Tax relief on Self Assessment forms for the SEIS, compared to 8,725 investors in 2018 to 2019. This is a decrease from the previous 2 years, and as with the reduction in overall investment a likely result of the restrictions of the risk-to-capital condition.
The majority of the investors claiming the relief invested £10,000 or less into qualifying SEIS companies (58% of investors).
Investments of over £25,000 contributed 60% of the total amount of SEIS investment raised on which claims were made, which is very similar to 2018 to 2019. In Figure 14, data for 2019 to 2020 are still provisional.
The data used in this section come from SEIS: Table 8.15.
Figure 14: Proportion of SEIS investors claiming Income Tax relief and amount of investment by investment band, 2019 to 2020
5. Social Investment Tax Relief
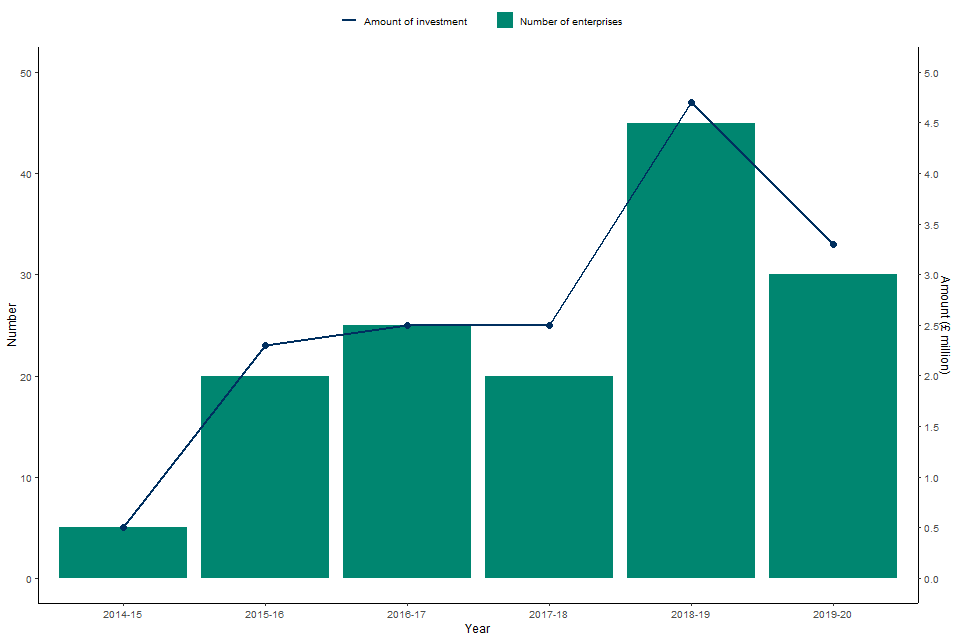
5.1 Number of social enterprises and amount of investment
In 2019 to 2020, 30 social enterprises received investment through the Social Investment Tax Relief (SITR) scheme and £3.3 million of funds were raised. Funds are raised through equity investment (shares) and debt investment (loans). This is a decrease on the previous year, where 45 social enterprises raised £4.7 million in total. However, with a relatively short time series, there may be some volatility in the amounts of funds raised each year. In future years, it should be possible to understand these trends in greater detail.
In 2017, the amount of investment younger qualifying social enterprises could raise through SITR was increased to £1.5 million. At the same time, restrictions on employee numbers and qualifying trades were introduced to make sure the scheme continued to comply with state aid requirements and was well targeted. Among the amendments was the exclusion of activities such as asset leasing, lending, and operating nursing and residential care homes.
The data can be found in SITR: Table 8.21.
Since SITR was launched in tax year 2014 to 2015, social enterprises have raised a total of £15.8 million in funds.
Figure 15: Number of companies raising funds and amount raised, April 2014 to 2020
6. Advance assurance requests
Companies considering using the EIS, SEIS or SITR can obtain advance assurance (AA) that HMRC will regard the shares to be issued as satisfying the requirements of the scheme.
These statistics show the number of companies seeking advance assurance, the number of AAR applications received, and, of these, how many were approved, rejected, or not pursued further. Statistics are presented from 2006 to 2007 for the EIS, 2012 to 2013 for the SEIS and 2014 to 2015 for SITR.
There are several reasons why the statistics may differ from those presented on the number of companies receiving investment through the various schemes shown in Section 3, 4 and 5. For example:
- The advance assurance process is not mandatory so not all companies put forward AARs before submitting compliance statements.
- There will also be instances where a company does not go on to use the EIS, SEIS or SITR despite having an advance assurance application approved, including where the legislation changes before an investment can be made.
For some companies, which we have collected in the category ‘not pursued’, they may choose not to continue with the application after receiving a request for more information from HMRC in response to their initial application.
Applications are received throughout the year, and some may be dealt with in subsequent tax years. This can particularly be the case for those received late in the year, for example in March when there is often a higher flow of applications.
AARs are both non-statutory and discretionary, and so the figures here will not match the number of completed applications. Due to increasing demand and limited resource, a consultation exercise was conducted in late 2017 about managing the AA service. To know more about the outcomes of the consultation, see Tax-advantaged venture capital schemes - streamlining the advance assurance service.
6.1 EIS: Number of AARs received and outcomes
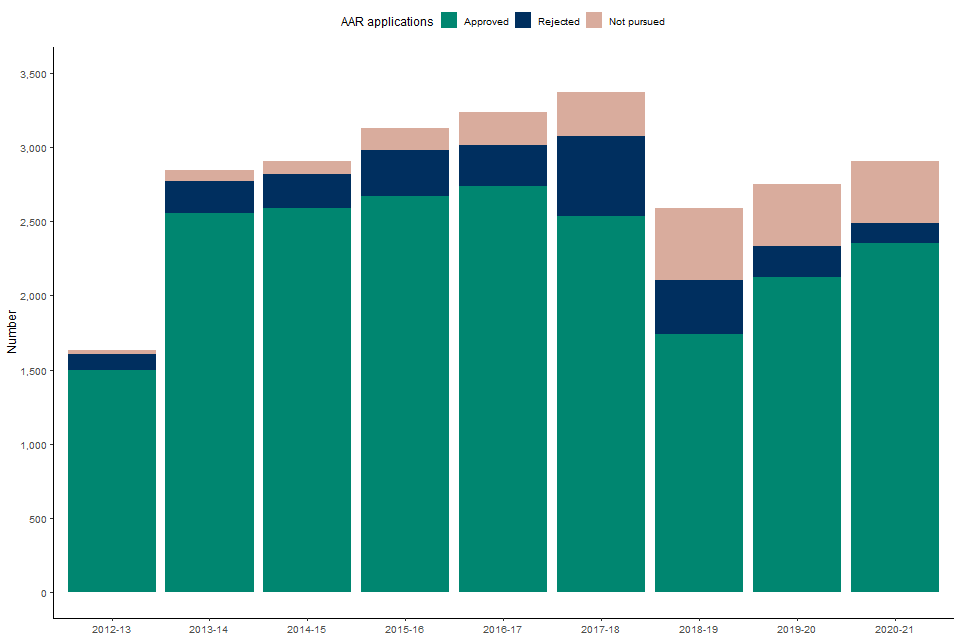
In 2020 to 2021, HMRC received 3,080 advance assurance applications for the EIS, a decrease of 360 from 2019 to 2020. A number of the applications for 2020 to 2021 are still being processed, but as of April 2021, 77% have been approved so far. Of the 3,440 applications received in 2019 to 2020, 77% have been approved (Figure 16).
Figure 16: Number of EIS advance assurance applications received, approved and rejected, April 2006 to 2021
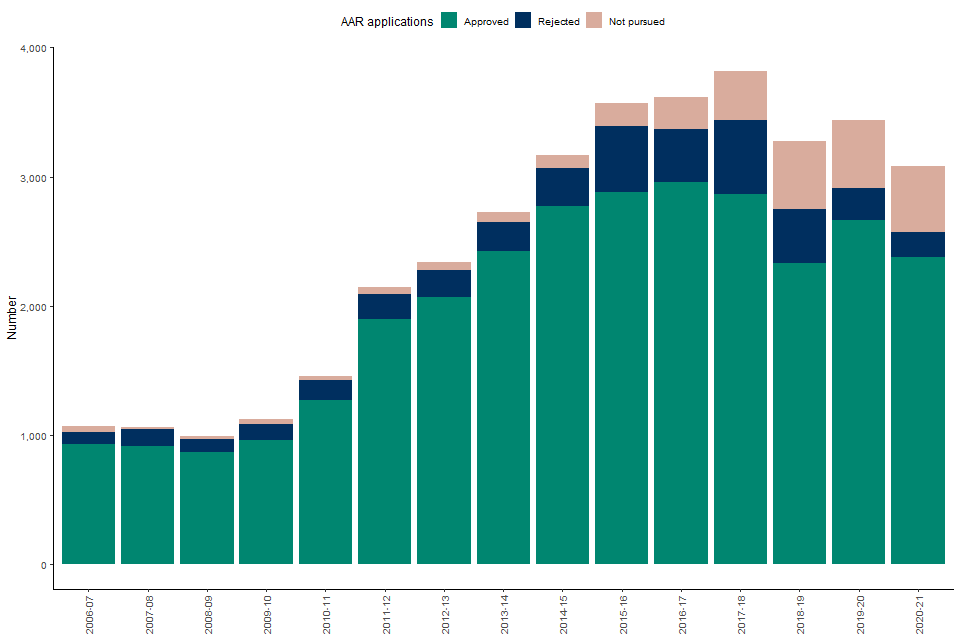
Since 2006 to 2007, there have been a total of 36,905 AAR applications received and of these 30,205 have so far been approved.
The data used in this section come from EIS Table 8.7.
6.2 SEIS: Number of AARs received and outcomes
In 2020 to 2021, HMRC received 2,900 SEIS AAR applications, an increase of 145 from 2019 to 2020. A number of the applications for 2020 to 2021 are still being processed, but as of April 2021, 81% of applications have been approved. In 2019 to 2020 there were 2,755 SEIS AAR applications and of these 2,120 (77%) have been approved.
In total since 2012 to 2013, 25,365 AAR applications have been received for the SEIS, of which 20,790 (82%) have been approved.
The data used in this section come from SEIS: Table 8.16 and 8.17.
Figure 17: Number of SEIS advance assurance applications received, approved and rejected, April 2012 to 2021
6.3 SITR: Number of AARs received and outcomes
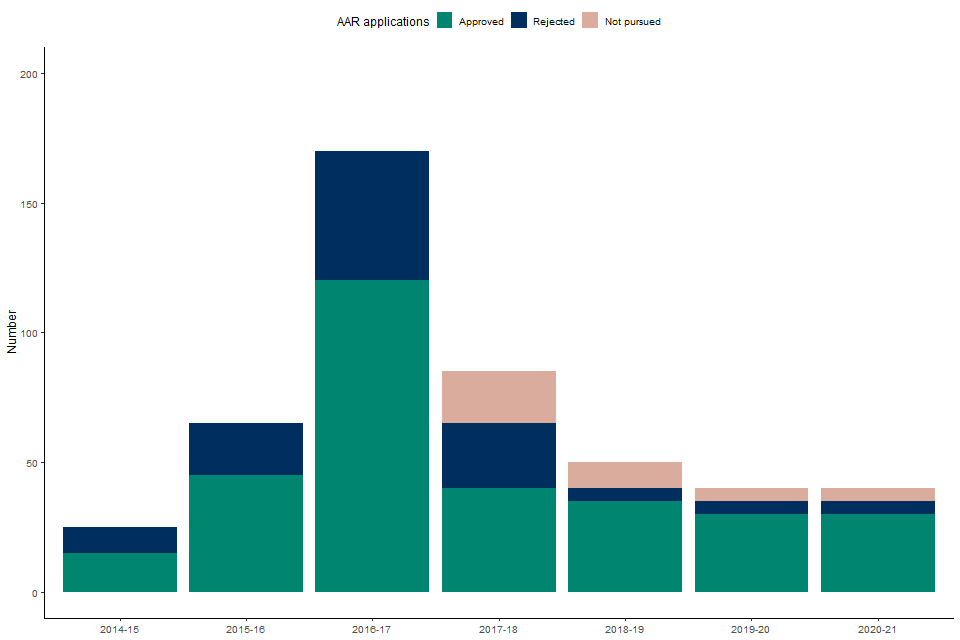
In 2020 to 2021, there were 40 SITR AAR applications. This remained consistent from 2019 to 2020, and the number of AAR applications have shown a reduction in the recent few years (Figure 18). The reduction in applications probably reflects changes in the SITR rules which took effect from 6 April 2017.
The changes included an increase in the maximum amount of investment a younger social enterprise may receive at any time, to £1.5 million, subject to a lifetime limit of the same amount. Certain activities such as leasing, energy and on-lending activities were excluded, and anti-abuse provisions were also introduced. As of April 2021, 30 out of 40 applications for 2020 to 2021 have been approved.
In 2019 to 2020, there were 40 SITR AAR applications and, of these 30 (71%) have been approved.
In total since 2014 to 2015, 475 SITR AAR applications have been received, of which 310 (65%) have been approved.
The data used in this section come from SITR: Table 8.21a.
Figure 18: Number of SITR advance assurance applications received, approved and rejected, April 2014 to 2021