Statistical commentary: end of life care profiles, July 2018 update
Published 3 July 2018

© Crown copyright 2018
This publication is licensed under the terms of the Open Government Licence v3.0 except where otherwise stated. To view this licence, visit nationalarchives.gov.uk/doc/open-government-licence/version/3 or write to the Information Policy Team, The National Archives, Kew, London TW9 4DU, or email: psi@nationalarchives.gov.uk.
Where we have identified any third party copyright information you will need to obtain permission from the copyright holders concerned.
This publication is available at https://www.gov.uk/government/statistics/end-of-life-care-profiles-july-2018-data-update/statistical-commentary-end-of-life-care-profiles-july-2018-update
1. New in this update
New death in usual place of residence data for 2016 has been added to the end of life care profiles for local authorities, Clinical Commissioning Groups (CCGs), Sustainability and Transformation Plan areas (STPs), Strategic Clinical Network areas (SCNs) and Government Office regions (GORs).
The following indicators were updated:
- percentage of deaths in the usual place of residence all ages and all causes of death
- percentage of deaths in the usual place of residence for age groups 0 to 64, 65 to 74, 75 to 84 and 85 and over
- percentage of deaths in the usual place of residence with an underlying cause of cancer (all ages)
- percentage of deaths in the usual place of residence with an underlying cause of circulatory disease (all ages)
- percentage of deaths in the usual place of residence with an underlying cause of respiratory disease (all ages)
2. Main findings
This update shows:
- in 2016, almost half of all deaths in England (45.8%) occurred in the usual place of residence
- the percentage of deaths in the usual place of residence rises with increasing age at death
- 44.5% of deaths from cancer, 44.8% of deaths from circulatory disease and 32.2% of deaths from respiratory disease occurred in the usual place of residence
- the recent trend in England was an increase in the annual percentage of deaths in the usual place of residence
- an increasing trend was observed in England for cancer and cardiovascular disease, but a decreasing trend for respiratory disease
- there is considerable variation in the percentage of deaths in the usual place of residence by CCG and district and local authority (LA)
- the percentage of deaths in the usual place of residence are generally lowest in highly urbanised CCGs and highest in parts of southern and south-west England, parts of East Anglia and northern England
3. Introduction
The vast majority of people would prefer to be cared for and die in their usual place of residence towards the end of life. Death in the usual place of residence is presented as a proxy indicator for choice and access to services towards the end of life. These indicators describe the proportion of deaths that occur at home or in a care home; they exclude deaths from external causes.
4. Summary
In 2016, 45.8% of people died in their usual place of residence (figure 1), the percentage of deaths rising with increasing age at death. Just over one third of deaths (35.8%) occurred in the usual place of residence for persons aged under 65, compared to more than half of deaths (53.9%) in persons aged 85 and over. 44.5% of deaths from cancer, 44.8% of deaths from circulatory disease and 32.2% of deaths from respiratory disease occurred in the usual place of residence during 2016.
Figure 1: Percentage of deaths in the usual place of residence, by age group, England, 2016
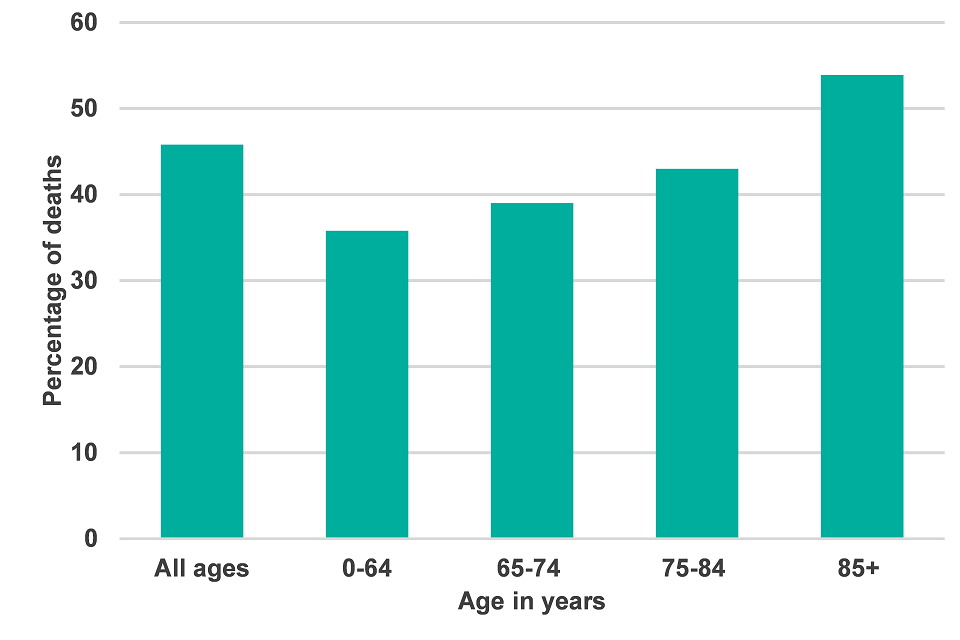
This bar chart shows the percentage of deaths in the usual place of residence, by age group, England, 2016
The recent trend in England of the percentage of deaths in usual place of residence was increasing, rising from 35% in 2004 to 45.2% in 2016 (figure 2).
Recent trends for England within each age group and by cause of death are summarised in Table 1. There were increases in the all age percentage and in all the age groups studied (0 to 64, 65 to 74, 75 to 84 and 85 and over). The largest percentage age group increases (10.2% and 9.1%) were associated with the age groups 75 to 84 years and 65 to 74 years respectively.
The recent trend in deaths in usual place of residence was increasing for cancer and circulatory disease similar to the all causes of death measure shown in figure 2. For respiratory disease the trend was decreasing (figure 3).
Figure 2: Deaths in the usual place of residence, 2004-2016, England
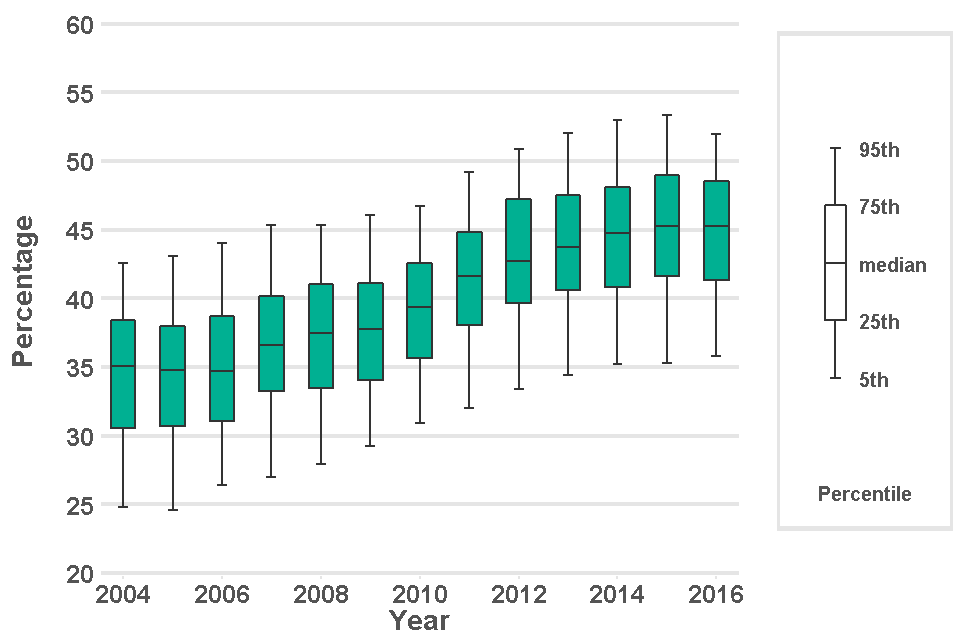
This box plot shows the median percentage number of deaths, and the range of values for deaths in the usual place of residence in CCGs from 2004 to 2016, England.
Figure 3: Deaths in the usual place of residence, deaths from respiratory disease, 2004-2016, England
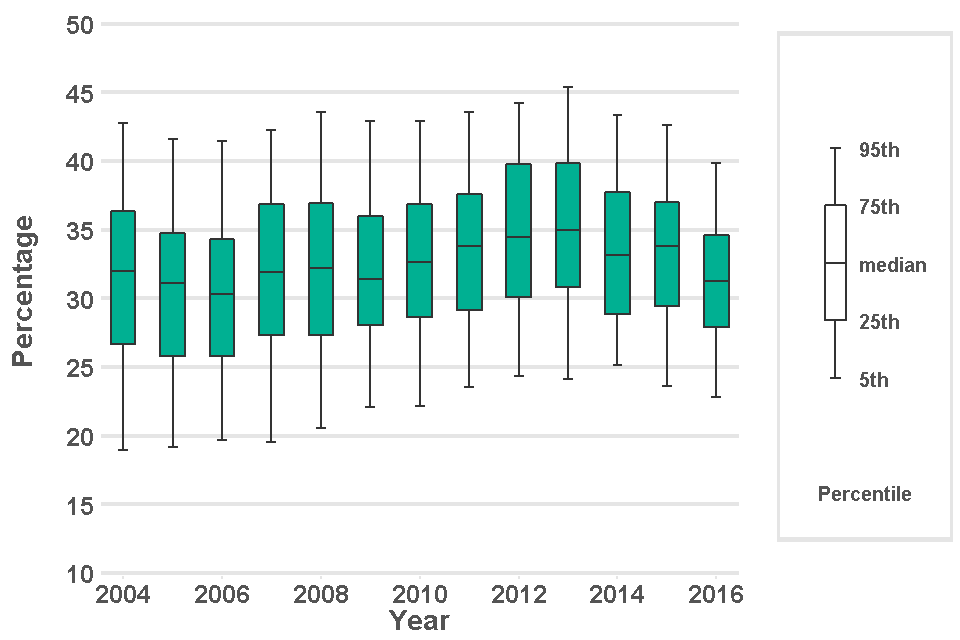
This box plot shows, for deaths from respiratory disease, the median percentage number of deaths, and the range of values for deaths in the usual place of residence in CCGs from 2004 to 2016, England.
Table 1: Summary of death in usual place of residence indicators for England, 2016
| Indicator | Period | England count | England value | Recent trend |
|---|---|---|---|---|
| Persons, all ages | 2016 | 215,013 | 45.8% | Increasing |
| Persons, aged 0 - 64 years | 2016 | 22,884 | 35.8% | Increasing |
| Persons (%), aged 65 - 74 years | 2016 | 31,014 | 39.0% | Increasing |
| Persons, aged 75 - 84 years | 2016 | 58,511 | 43.0% | Increasing |
| Persons, aged 85 years and over | 2016 | 102,604 | 53.9% | Increasing |
| Cancer (%), persons, all ages | 2016 | 60,968 | 44.5% | Increasing |
| Circulatory disease (%), persons, all ages | 2016 | 55,776 | 44.8% | Increasing |
| Respiratory disease (%), persons, all ages | 2016 | 21,576 | 32.2% | Decreasing |
In 2016, the percentage of deaths in CCGs (all ages and all causes of death) in the usual place of residence ranged from 27.3% to 57.4%. Map 1 shows that the percentage of deaths in the usual place of residence are generally lower in highly urbanised CCGs with the lowest values generally associated with London, Birmingham and parts of the north-west. Values are higher in the south, south-west, East Anglia and parts of the north.
There is also considerable variation across the country by district and local authority, the percentage of deaths in the usual place of residence ranging from 27.3% to 61.4%. The highest values associated with district and local authorities were mainly associated with rural areas and the lowest with urban areas and in particular the London area.
For both CCGs and district and unitary authority areas the percentage of deaths in the usual place of residence was lowest in the three most deprived deprivation deciles and highest in the three least deprived deprivation deciles. View the End of Life Care Profiles for more inequalities information.
Map 1: Percentage of deaths in the usual place of residence in CCGs in 2016 compared to the percentage value for England
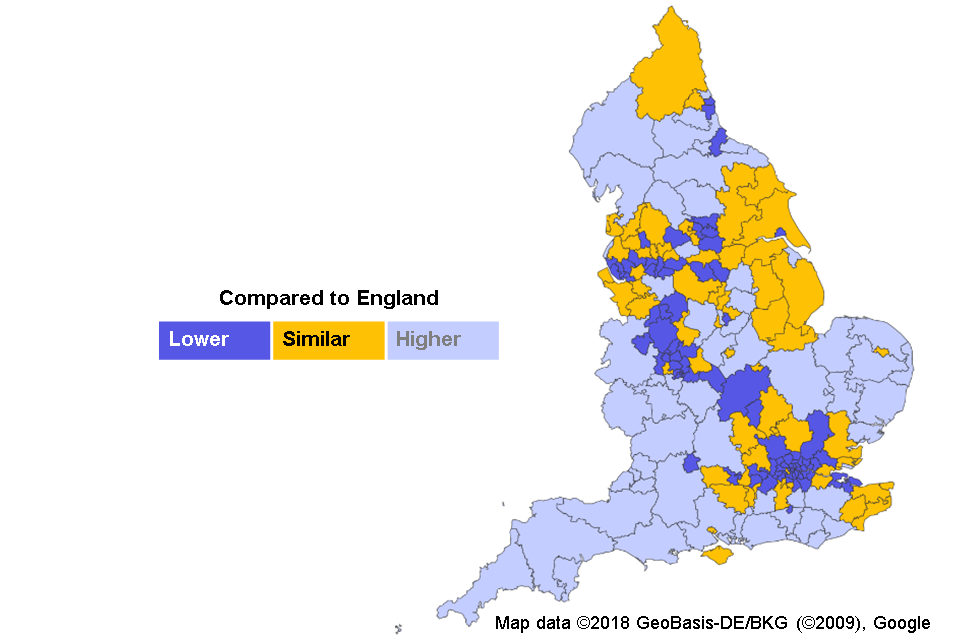
This map shows the percentage of deaths in the usual place of residence in CCGs in 2016 compared to the percentage value for England.
5. Background and further information
The End of Life Care Profiles aim to improve the availability and accessibility of information around end of life care. The profiles provide a snapshot overview for various geographies in England. They are intended to help local government and health services improve care at the end of life.
The website contains data for upper tier local authorities, former Government Office regions, England together with lower tier local authorities and Clinical Commissioning Groups.
Providing care at the end of life often involves the interaction of many different care agencies. The profiles will help commissioners and providers to get a clearer picture of the end of life care needs of their local populations. These will help with the planning and delivery of services and will support local drives towards improving end of life care.
The data has been extracted using the Office for National Statistics (ONS) annual mortality and population statistics. Further details about the profile methodology are available within the definitions section of the online version of the profile.
View the end of life care profiles
Responsible statistician, product lead: Andy Pring, Julia Verne
For queries relating to this publication, please contact: neolcin@phe.gov.uk