Employment Data Lab analysis: Walking With The Wounded
Published 8 May 2024

© Crown copyright 2024
This publication is licensed under the terms of the Open Government Licence v3.0 except where otherwise stated. To view this licence, visit nationalarchives.gov.uk/doc/open-government-licence/version/3 or write to the Information Policy Team, The National Archives, Kew, London TW9 4DU, or email: psi@nationalarchives.gov.uk.
Where we have identified any third party copyright information you will need to obtain permission from the copyright holders concerned.
This publication is available at https://www.gov.uk/government/statistics/employment-data-lab-analysis-walking-with-the-wounded/employment-data-lab-analysis-walking-with-the-wounded
This Employment Data Lab report presents descriptive statistics and outcomes information for participants of employment support programmes provided by the Walking With The Wounded charity between April 2014 and April 2022.
Unlike other Employment Data Lab reports, this report does not present an estimate of the impact of the Walking With The Wounded programmes. The outcomes presented cannot be used to infer the causal effect of the programme upon employment. The report does provide information about the participants and their labour market interactions before and after participation.
1. What you need to know
What is the Employment Data Lab?
The Employment Data Lab is a service provided by a team of analysts at the Department for Work and Pensions (DWP). The Data Lab provides group-level benefits and employment information to organisations who have worked with people to help them into employment. The purpose is to provide these organisations with information to help them understand the impact of their programmes. In this case an impact evaluation was not deemed feasible so only participant outcomes information has been provided.
Who are Walking With The Wounded?
Walking With The Wounded (WWTW) is a charity established in 2010 that works with those who served in the UK armed forces. WWTW deliver employment, mental health, and care coordination support programmes in collaboration with the NHS.
WWTW’s Employment Programme helps to secure positive employment outcomes for unemployed or significantly underemployed, ex-service personnel. The support provided includes pre-work (CV building, confidence building, job hunting, interview preparation) and in-work support (typically liaising with the employers to support with any small issues). There is no set time limit on the support provided.
WWTW Employment Advisors are embedded in NHS regional veteran mental health teams and in local communities. They practice the Individual Placement and Support (IPS) model, which is intended to support people with mental health difficulties into employment. IPS involves intensive, individual support, a rapid job search followed by placement in paid employment, and time-unlimited in-work support for both the employee and the employer.
To be eligible for the programme individuals must be:
- a veteran (having served at least one day in the armed forces)
- unemployed (or significantly under-employed) and want to find work
- have a mental health, physical health, or social barrier to finding employment
The majority (approximately 90%) of WWTW referrals come from professional partners such as the NHS veteran mental health teams, with the remainder (approximately 10%) coming from self-referrals. Since 2014 there have been 2,880 referrals to the WWTW employment programme.
Who was evaluated as part of this analysis?
This analysis focuses on 1,076 individuals who participated in WWTW programmes between 1 April 2014 and 1 April 2021. This is a subset of the 1,529 observations worth of data originally shared with DWP, Figure 1 shows the numbers and reasons for the exclusions. Primarily data was restricted to those who started on a programme before 1 April 2022 to ensure that one full year of employment follow-up data was available at the time of carrying out the analysis. The 1,076 individuals evaluated represents 37% of the 2,880 total referrals to WWTW since 2014.
Figure 1: Sankey diagram showing the participant data shared along with the numbers and reasons for exclusions from the analysis
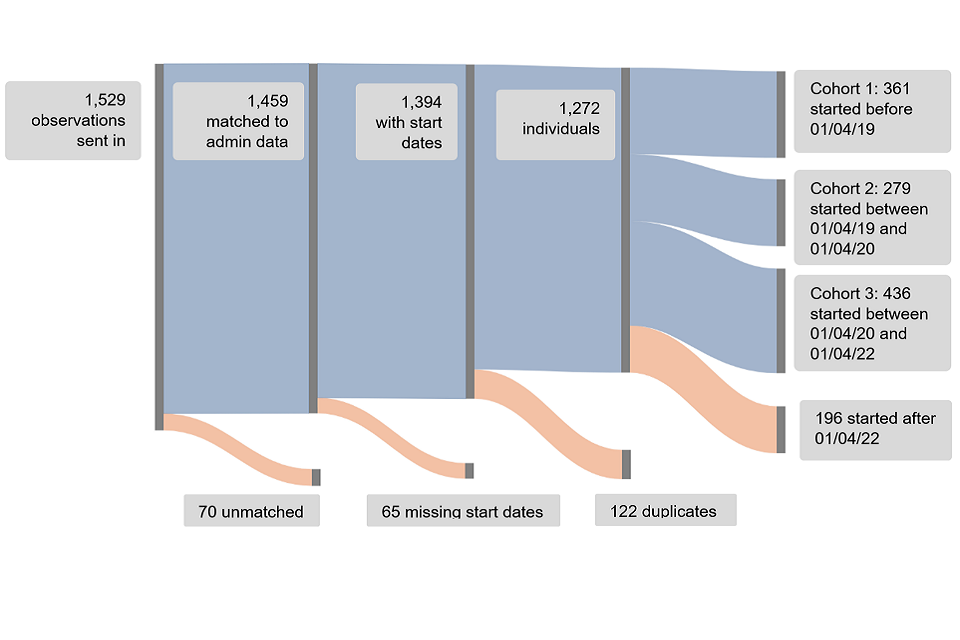
The data includes participants who started on the programme before, during and in the wake of the COVID-19 pandemic. The pandemic and the associated lockdowns which took place between March 2020 and the summer of 2021 had significant impacts on the UK labour market, with large swings in employment, unemployment, and inactivity rates[footnote 1]. To explore the impacts of the pandemic on the participants and their outcomes the data were split into four groups as follows:
-
Cohort 1: Those who started before 1 April 2019, whose one-year follow-up data is unaffected by the COVID-19 pandemic
-
Cohort 2: Those who started between 1 April 2019 and 1 April 2020. This will include participants whose selection will have been largely unaffected by the COVID-19 pandemic but whose one-year follow-up data will have been
-
Cohort 3: Those who started between 1 April 2020 and 1 April 2022. This will include participant whose selection and outcomes would have been impacted by the COVID-19 pandemic
-
All Cohorts: Those who started before 1 April 2022. An aggregation of the above three cohorts, ensuring that one full year of follow-up data is available
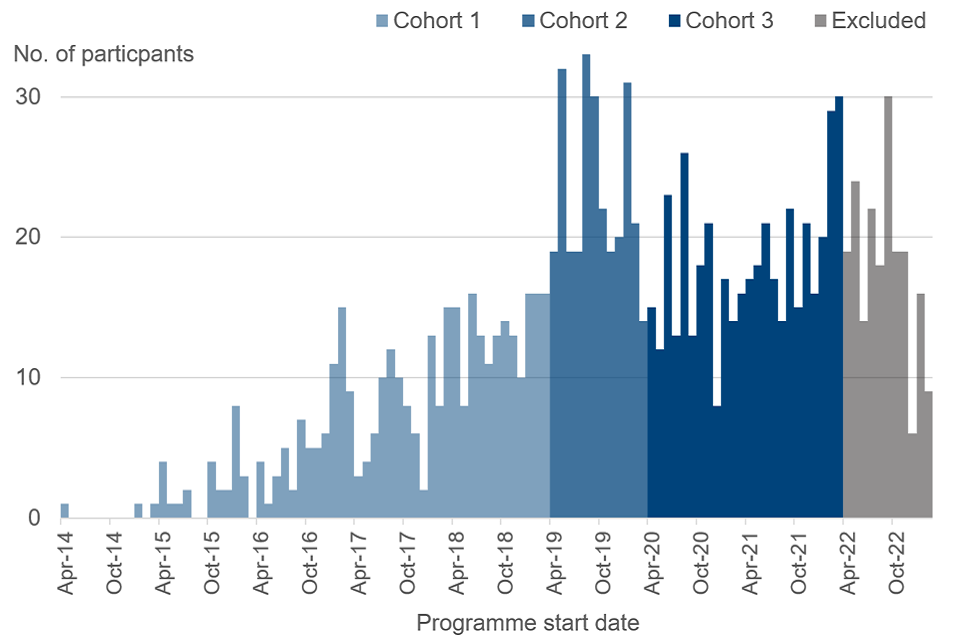
Figure 2 shows the distribution of matched start dates shared with DWP. The figure shows the numbers growing between 2014 and 2019 before levelling out somewhat between 2019 and 2023 at approximately 20 participants per month.
Figure 2: showing the distribution of start dates for WWTW programme participants. The three different cohorts and those who were excluded from the analysis due to a lack of available follow-up data are highlighted
The analysis in this report
A key aim of the Employment Data Lab is to provide estimates of the causal impact of employment support programmes. This has not been possible in this case due to limitations with the available data on people’s veteran status. This is discussed further in section 5. This report still provides useful information about the programme, its participants, and their outcomes.
2. Participant characteristics
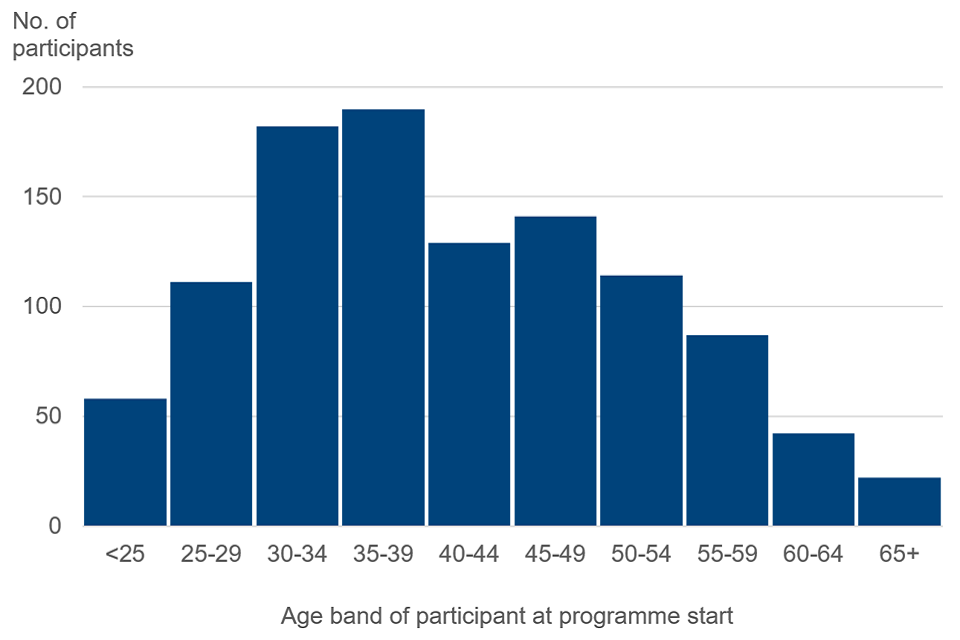
Table 1 below shows characteristics of the programme participants based on the available administrative data. It shows that vast majority of participants (91%) are male with an average age at starting the programme of 41 years. 36% were on a DWP benefit and had an indication in the data of a restricted ability to work. Figure 3 shows the distribution of ages of participants on starting a programme with WWTW. The range spans participants from as young as 17 up to the 80’s, with the middle 50% of participants falling between the ages of 33 and 49.
Table 1 also shows the labour market status of participants on starting the programme. It shows that of the full cohort who started before April 2022:
- 39% were recorded as being in Employment on starting the programme
- 35% were on a Looking for Work benefit
- 25% were on an inactivity benefit and
- 14% were in the Other category (see section 5 for details of the labour market categorisation)
This however hides some difference between the cohorts. Those who started before April 2019 had 16 percentage points fewer people in the Looking for Work category at start than the latter two cohorts, and 9 percentage points more in the Inactive category. These differences are statistically significant. Whilst the overall levels of Employment are similar between the cohorts these results may suggest that the earlier cohort are on average further from the labour market than the latter two cohorts, but it is difficult to be certain here. The COVID pandemic may be having an impact, but whether that is because it changed the way people acted in the labour market, or the type of people who joined the programme, cannot be determined from the data available.
Table 1: Participant characteristics. The table shows values of a range of characteristics broken down into each cohort
| Cohort 1 | Cohort 2 | Cohort 3 | All Cohorts | |
|---|---|---|---|---|
| Start date period | < 1 April 2019 | 1 April 2019 - 1 April 2020 | 1 April 2020 - 1 April 2022 | <1 April 2022 |
| Observations | 361 | 279 | 436 | 1076 |
| Male (%) | 88 | 94 | 92 | 91 |
| Mean age (years) | 40 | 43 | 41 | 41 |
| Restricted ability to work at start* (%) | 39 | 36 | 33 | 36 |
| In work at start ** (%) | 39 | 37 | 41 | 39 |
| On a Looking for work benefit at start (%) | 24 | 39 | 41 | 35 |
| On an inactive benefit at start (%) | 31 | 22 | 22 | 25 |
| Other at start (%) | 17 | 15 | 11 | 14 |
| In receipt of housing benefit at start (%) | 33 | 24 | 18 | 25 |
| In receipt of child benefit at start (%) | 7 | x | 6 | 6 |
| In receipt of child tax credits at start (%) | 7 | x | x | 5 |
| In receipt of working tax credits at start (%) | x | x | x | 4 |
| Weeks spent in work (previous 1 yr.) | 26 | 26 | 28 | 27 |
| Weeks spent in work (previous 2 yrs.) | 57 | 56 | 61 | 58 |
| Weeks spent Looking for Work (previous 1 yr.) | 7 | 11 | 13 | 10 |
| Weeks spent Looking for Work (previous 2 yrs.) | 11 | 16 | 20 | 16 |
| Weeks spent Inactive (previous 1 yr.) | 12 | 10 | 10 | 11 |
| Weeks spent Inactive (previous 2 yrs.) | 35 | 32 | 25 | 30 |
| Weeks spent in Other (previous 1 yr.) | 10 | 9 | 7 | 9 |
| Weeks spent in Other (previous 2 yrs.) | 13 | 14 | 18 | 15 |
Notes to table 1
The information in the table above has been collated from available administrative data. Limitations and variations in the coverage of the data available mean that this information should be used for indicative purposes only.
Figures marked with an x have been supressed for statistical disclosure purposes.
*This relates to individuals on a DWP benefit where there is an indication of a restricted ability to work.
**Employment flags are generated for individuals present in administrative datasets but may not reflect self-identified employment status for some individuals, such as those on zero-hour contracts with no earnings.
Figure 3: Plot showing the distribution of participant ages at programme start (all starters before April 2022)
3. Labour market outcomes
Labour market status
The longitudinal administrative data available to the Data Lab team allow for the labour market status of participants to be followed over several years. Figure 4 shows the percentages of participants in each of the cohorts in the four labour market categories (Employed, Looking for Work, Inactive and Other) over time. See section 5 for details of the categorisation.
Figure 4 a) shows the percentage of each cohort in employment over the years before and after starting on the programme. The blue line shows the full group of all participants starting before April 2022. This shows a characteristic drop in employment rates as the line approaches the start of the programme, before picking up after people start. This is a common feature of employment programmes as the programmes are often aimed at those who are out of work.
Similarly, in Figure 4 b), which shows the rates on a looking for work benefit, the line peaks around the point people start on the programme before falling away.
Since no estimation of the counterfactual has been made these plots give no information on the causal impact that the programme has had, but it is possible to explore differences between the cohorts, shown by the orange lines on the plots.
Figures 4 b) and c) show that the earliest cohort had lower rates of people on Looking for Work benefits and higher rates of people on inactive benefits, particularly when compared to cohort 3. The spread in the lines of Figure 4 a) shows the different employment trajectories for each of the three cohorts. Cohorts 1 and 3 have steeper rises after programme start, indicating a speedier take-up of employment than cohort 2, where the rise is more gradual. Many factors may be influencing this including the COVID-19 pandemic which may have affected availability of employment opportunities.
Time into work
The rate of take up of employment can be explored further by looking at the time it takes an individual to enter their first employment spell after starting the programme. This is shown in Figure 5 and Table 2.
Figure 5 shows the percentage of people who have entered their first employment spell (lasting more than five days) during the 52 weeks after starting the programme. It shows that people in the last cohort (cohort 3) appear to be finding work faster than the other two cohorts.
Table 2 Shows the percentages of each cohort finding their first employment in each quarter after starting. The final row of table 2 shows disparities in the numbers who were in or entered employment during the first year with 74% of cohort 3 being in or finding work compared to only 59% of cohort 2.
Figure 4 Plots showing the percentage of each cohort in each of the four labour market categories; a) Employment, b) Looking for work, c) Inactive, and d) Other
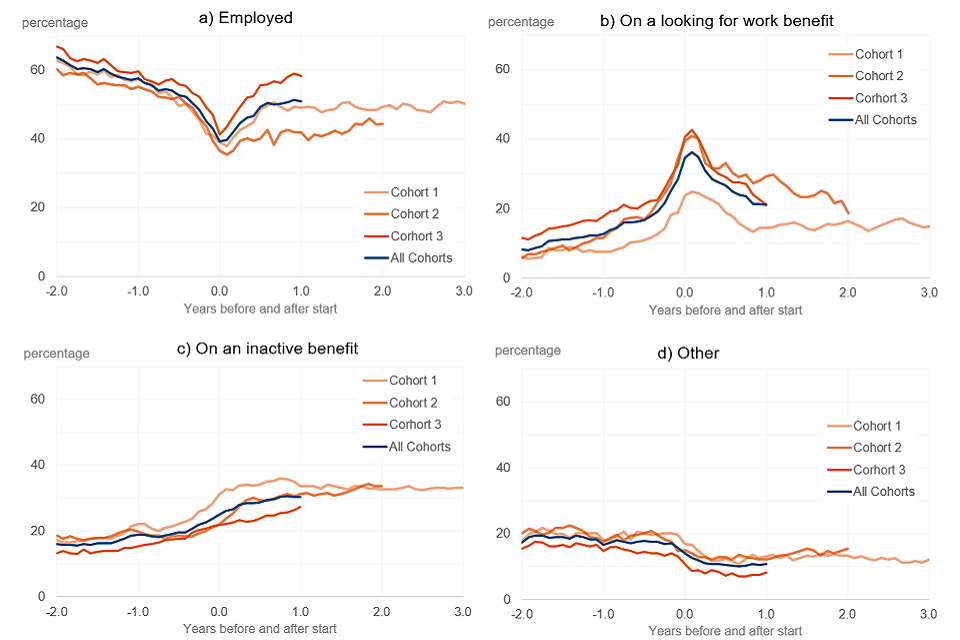
Figure 5 showing the percentage of people in each cohort entering employment (at least once) during the year after starting. People in the last cohort (cohort 3) appear to be finding work faster and at a higher rate than the other two cohorts
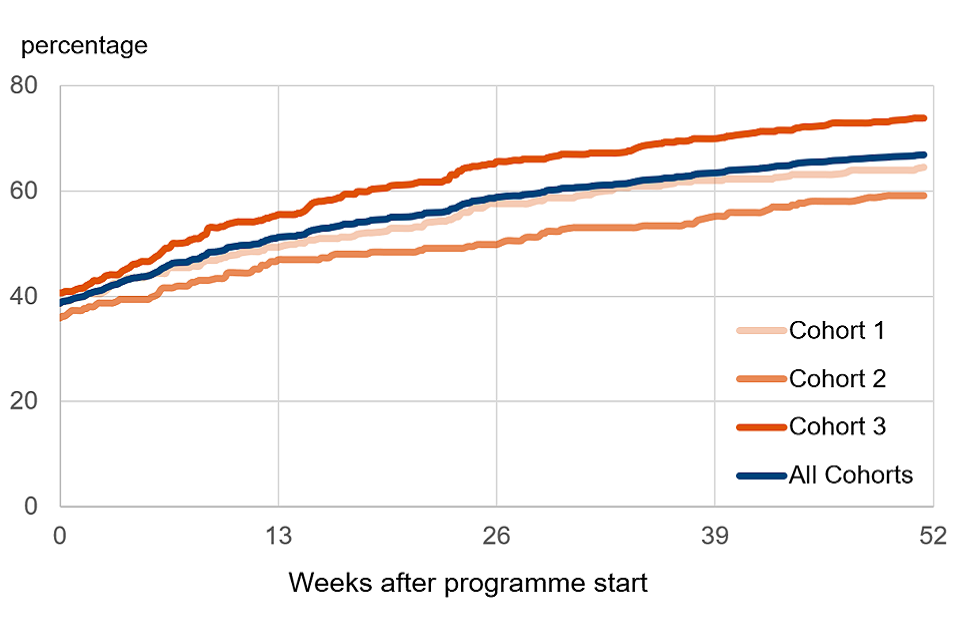
Table 2 showing the percentage of each cohort entering employment for the first time during the four quarters of the year after starting the programme
| Cohort 1 | Cohort 2 | Cohort 3 | All cohorts | |
|---|---|---|---|---|
| In employment at start | 39 | 36 | 41 | 39 |
| >0-13 weeks | 11 | 11 | 15 | 13 |
| >13-26 weeks | 8 | x | 10 | 8 |
| >26-39 weeks | x | x | x | 5 |
| >39-52 weeks | x | x | x | 3 |
| Total who started in or entered employment during the year after start | 65 | 59 | 74 | 67 |
Overlaps in categories
The categories used in this report are not mutually exclusive and it is possible to be in more than one at once. For example, it is possible to be in employment and, because of a combination of low hours and/or low earnings, be in receipt of benefits such as JSA (Jobseeker’s Allowance) or UC (Universal Credit) which would put someone in both the Employed and Looking for Work categories.
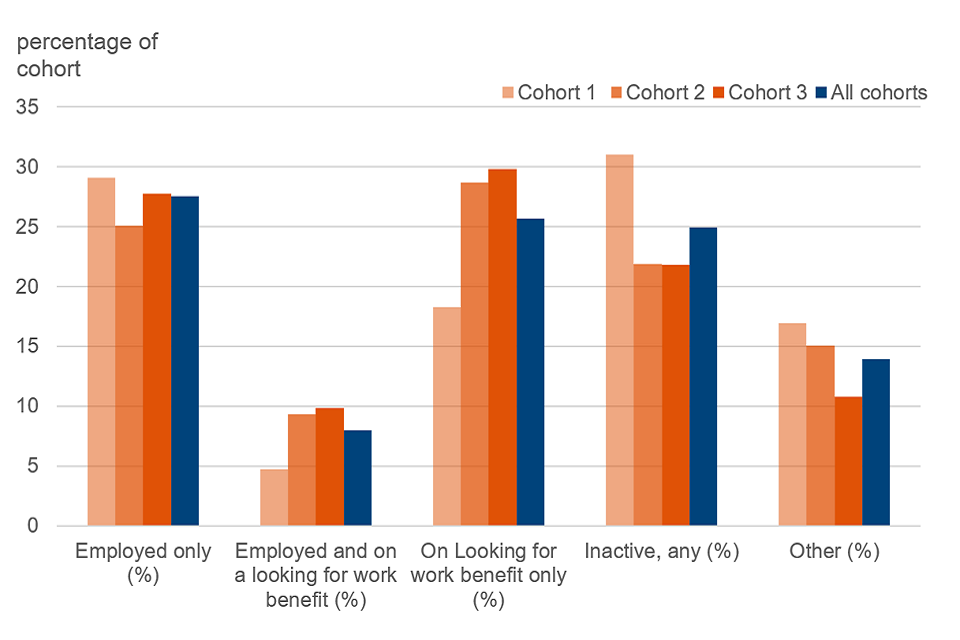
Table 3 and Figure 6 show the breakdown of the main labour market category combinations at programme start, again highlighting disparities between the cohorts, with the first cohort having a lower percentage in the Looking for work category (whether also employed or not) and higher percentages on an inactivity benefit than that the other cohorts.
Table 3 shows the percentage of each cohort falling into one of the five main labour market category combinations at programme start
| Status at start | Cohort 1 | Cohort 2 | Cohort 3 | All Cohorts |
|---|---|---|---|---|
| Employed only (%) | 29 | 25 | 28 | 28 |
| Employed and on a looking for work benefit (%) | 5 | 9 | 10 | 8 |
| On Looking for work benefit only (%) | 18 | 29 | 30 | 26 |
| Inactive, any combination (%) | 31 | 22 | 22 | 25 |
| Other (%) | 17 | 15 | 11 | 14 |
Figure 6 shows the percentage of each cohort falling in to one of the five main labour market category combinations at programme start
Labour market transitions
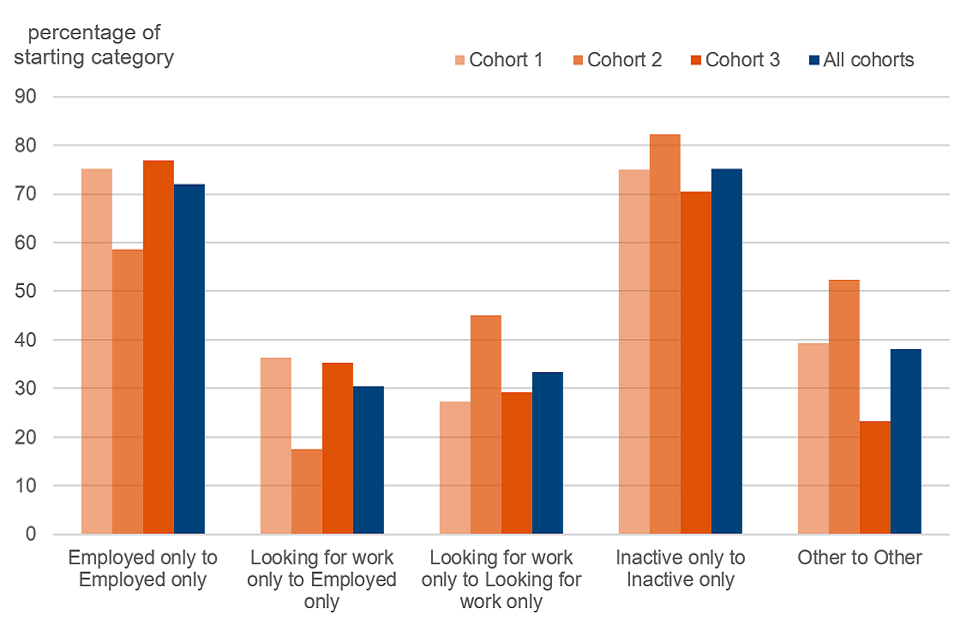
Table 4 and Figure 7 show a selection of the main transitions people made between their labour market status on starting the programme and one year later. The size of the flow is represented as a percentage of the number of participants in each starting category. For example, the top line of table 4 focuses on those in each cohort who were in employment only at start. For cohort 1, 75% of these people remained in employment one year later, this compares to only 59% for cohort 2. Cohort 2 also had a smaller percentage flowing into employment only from being in the Looking for work category at start. As noted above, many factors may be influencing these features, including the COVID-19 pandemic which may have affected availability of employment opportunities.
Table 4 shows a selection of the main transitions people made between their labour market category at start and one year later. The figures show the size of the flow as a percentage of the numbers in the starting category
| Transition | Cohort 1 | Cohort 2 | Cohort 3 | All cohorts |
|---|---|---|---|---|
| Employed only to Employed only | 75 | 59 | 77 | 72 |
| Looking for work only to Employed only | 36 | 18 | 35 | 30 |
| Looking for work only to Looking for work only | 27 | 45 | 29 | 33 |
| Inactive only to Inactive only | 75 | 82 | 70 | 75 |
| Other to Other | 39 | 52 | 23 | 38 |
Figure 7 shows a selection of the main transitions people made between their labour market category at start and one year later. The figures show the size of the flow as a percentage of the numbers in the starting category
4. Walking With The Wounded in their own words
Our organisation
Walking With The Wounded (WWTW) exists to empower those veterans who have fallen furthest from where they want to be, reigniting their sense of purpose, enabling them to make a positive contribution to their communities and lead independent lives.
WWTW’s Employment Programme helps to secure positive employment outcomes for unemployed or significantly underemployed, ex-service personnel veterans.
There are an estimated 1.85 million veterans living in the UK[footnote 2], with around 15,000 personnel leaving the UK armed forces each year[footnote 3]. Of those leaving, latest figures show that 4% are unemployed and 7% are economically inactive six months after leaving service[footnote 4]. Some groups face greater challenges when leaving the Armed Forces, making them more likely to experience unsuccessful employment in the longer-term. This includes women, ethnic minorities, those who are wounded, injured and sick, and older service leavers[footnote 5]. UK Ethnic Minority service leavers (9%) are notably more likely to be unemployed than White (3%) service leavers[footnote 6].This finding appears to reflect disparities in employment status between ethnic groups in the wider UK population.
Reports have highlighted that the veteran community faces real and perceived barriers on leaving the forces including a lack of relevant qualifications/experience and problems translating skills gained in the military to civilian roles. Negative employer perceptions, a lack of support (from the Armed Forces and employers), physical and mental health challenges and poor cultural fit in civilian organisations[footnote 7] all appear to contribute to difficulties some veterans face upon leaving the military.
WWTW’s intention is to find suitable, sustainable jobs for all veterans who are struggling since leaving the military.
Our response to the analysis
WWTW takes evaluation and review of our services seriously. We believe our services are only effective if we listen to the views and suggestions of the people who use them and take time to analyse our data to improve and develop the care we provide.
We were keen to work with the DWP Data Lab and are proud to be the first veteran charity to work through the evaluation. WWTW provided a subset of data for 1,529 veterans who had received our support between 2014 and 2021. The Employment Lab was able to analyse 1,076 of these individuals, to tell us more about their employment status before and after the period of intervention with WWTW.
There are five key take aways for us;
- unlike some employment programmes, WWTW has always championed the need to support the underemployed as well as the unemployed. Many of those we support, due to the real and perceived barriers facing the ex-forces community, find themselves in employment that does not meet their skills, aspirations or financial needs. The report highlighted that as many as 39% of our services users are in employment at the start of support. The data is unable to tell us anything about work progression i.e., how many of those 39% moved into more appropriate roles during the period of support from WWTW, so this is something for us to take away and consider how we might capture that important detail
- 67% of people had experienced some form of employment during the 1 year after joining our programme (including the 39% who were employed at start). Whilst we are pleased with this result, we can also see from the data that the rates do not return to the levels in employment seen two years prior to seeking our support[footnote 8]). This is something WWTW is keen to explore further; perhaps there is a ‘scarring effect’ of the time spent unemployed
- from the data on cohort 1 and 2, we can see that the percentage of people supported into employment at the end of year 1 does not reduce over the years that follow, suggesting that the support provided led to sustained employment
- at the start of joining the programme, 35% of the service users in the report were claiming employment benefits. One year later 21% were claiming benefits, this reduction in benefits spending is equivalent to over £650,000 over the course of a year (based on the current standard rate of Universal Credit for a single person aged over 25 at £368.74 per month, claimed for one year, for the number of veterans included in this evaluation). At this stage it is not possible to know what proportion of this reduction in spending is linked to the programme, which is something we hope to revisit in the future.
- there was a statistically significant shift in the three cohorts around the years of the pandemic, and we’re keen to look into that further
Unfortunately, The Employment Data Lab was unable to provide the impact analysis part of their offer due to issues with distinguishing veterans for this historical cohort. WWTW is hopeful that such an evaluation would be possible in the not-too-distant future and look forward to working with the Employment Data Lab again to build on this initial report.
5. About these statistics
Why no impact evaluation?
A key aim of the Employment Data Lab is to provide estimates of the causal impact of employment support programmes. This has not been possible in this case due to a lack of available data on people’s veteran status which was deemed critical for such an evaluation.
Since April 2021 a voluntary question about veteran status has been added to the Universal Credit (UC) claim processes. This data is collected in a dataset that now contains flags for hundreds of thousands of people indicating that they were (at the time) or had previously served in the armed forces. Whilst a sizeable minority of the WWTW participants shared with DWP were present on this dataset much of the data was collected after they had participated in the programme. Since the veteran status data is collected at the time an individual is claiming UC the presence of a flag is directly linked to an individual’s labour market outcomes. This means that using this data to select participants for evaluation would introduce bias into the results in this case (where the collection takes place after participants start on the programme). This dataset will continue to grow and may be a useful source of veteran’s data for WWTW or other programmes aimed at veterans in the future.
Categorisation
The analysis in this report is based on the labour market outcomes of the participants in the years before and after starting a programme. This report uses four categories of labour market status for the analysis, detailed below.
1. Employed
People who are either employed or self-employed
2. Looking for Work
People who are in receipt of Jobseekers Allowance (JSA), or in the Universal Credit (UC) “intensive work search”, “light touch out of work”, or “light touch in work” conditionality regimes. This also includes those in the “working enough” conditionality regime who are not in employment or self-employed.
3. Inactive
People who are in receipt of inactive benefits such as Employment and Support Allowance (ESA) or in the UC “no work requirements” or “work focussed interview” conditionality regimes. Several other benefits also fall into this category, though the numbers of people on these benefits is small. See the Employment Data Lab methodology document for details.
4. Other
People who do not fall into the above three categories. This could include people who are in full-time education and not working or receiving benefits or those who are serving a custodial sentence.
These categories are not mutually exclusive, and it is possible to be in more than one category. For example, someone working fewer than 16 hours a week may also be in receipt of JSA and would be classed as “employed” and “looking for work”.
Where to find out more
Further details can be found in the Employment Data Lab methodology document and the Employment Data Lab website.
6. Statement of compliance with the Code of Practice for Statistics
The Code of Practice for Statistics (the Code) is built around 3 main concepts, or pillars:
-
trustworthiness – is about having confidence in the people and organisations that publish statistics
-
quality – is about using data and methods that produce statistics
-
value – is about publishing statistics that support society’s needs
The following explains how we have applied the pillars of the Code in a proportionate way.
Trustworthiness
Employment Data Lab reports, such as this, are published to provide useful information about programmes that support employment. Releasing them via an ad hoc publication will give equal access to all those with an interest in them.
Quality
The methodology used to produce the information in this report has been developed by DWP analysts. The information is based on government administrative data and management information. The calculations have been quality assured by DWP analysts to ensure they are robust.
Value
Producing this analysis provides readers and the public with useful information about employment support provision that they may not have otherwise been able to generate or obtain.
Appendix A: Characteristics and outcomes
Table 5 shows characteristics and labour market outcomes for each of the benefit cohorts.
| Cohort 1 | Cohort 2 | Cohort 3 | All Cohorts | |
|---|---|---|---|---|
| Observations | 361 | 279 | 436 | 1076 |
| Male (%) | 88 | 94 | 92 | 91 |
| Mean age (years) | 40 | 43 | 41 | 41 |
| Restricted ability to work at start | 39 | 36 | 33 | 36 |
| Lone parent flag (%) | x | x | x | x |
| Lone parent flag missing (%) | 44 | 55 | 63 | 55 |
| Partnered flag (%) | x | 12 | 12 | x |
| Partnered flag missing (%) | 50 | 54 | 67 | 58 |
| Dependent children flag (%) | 19 | 20 | 22 | 20 |
| Dependent children flag missing (%) | 32 | 43 | 56 | 45 |
| Receiving housing benefit at start (%) | 33 | 24 | 18 | 25 |
| Receiving child benefit at start (%) | 7 | x | 6 | x |
| Receiving child tax credits at start (%) | 7 | x | x | 5 |
| Receiving working tax credits at start (%) | x | x | x | 4 |
| Employed 2 years before start (%) | 63 | 60 | 67 | 64 |
| Employed 1 year before start (%) | 57 | 55 | 60 | 58 |
| Employed at start (%) | 39 | 37 | 41 | 39 |
| Employed 1 years after start (%) | 49 | 42 | 58 | 51 |
| Employed 2 years after start (%) | 49 | 44 | x | x |
| Employed 3 years after start (%) | 50 | x | x | x |
| Looking for work 2 years before start (%) | x | x | 11 | 8 |
| Looking for work 1 year before start (%) | 7 | 11 | 18 | 13 |
| Looking for work at start (%) | 24 | 39 | 41 | 35 |
| Looking for work 1 years after start (%) | 14 | 29 | 21 | 21 |
| Looking for work 2 years after start (%) | 16 | 19 | . | . |
| Looking for work 3 years after start (%) | 15 | . | . | . |
| Inactive 2 years before start (%) | 17 | 19 | 13 | 16 |
| Inactive for work 1 year before start (%) | 22 | 20 | 15 | 19 |
| Inactive at start (%) | 31 | 22 | 22 | 25 |
| Inactive 1 years after start (%) | 34 | 31 | 27 | 30 |
| Inactive 2 years after start (%) | 33 | 34 | . | . |
| Inactive 3 years after start (%) | 33 | . | . | . |
| Other 2 years before start (%) | 18 | 20 | 15 | 17 |
| Other for work 1 year before start (%) | 18 | 18 | 15 | 17 |
| Other at start (%) | 17 | 15 | 11 | 14 |
| Other 1 years after start (%) | 13 | 12 | 8 | 11 |
| Other 2 years after start (%) | 13 | 15 | . | . |
| Other 3 years after start (%) | 12 | . | . | . |
| Weeks Employed during 2 years prior | 57 | 56 | 61 | 58 |
| Weeks Employed during 1 year prior | 26 | 26 | 28 | 27 |
| Weeks Employed during 1 year after | 24 | 21 | 28 | 25 |
| Weeks Employed during 2 years after | 50 | 43 | . | . |
| Weeks Looking for work during 2 years prior | 11 | 16 | 20 | 16 |
| weeks Looking for work during 1 year prior | 7 | 11 | 13 | 10 |
| Weeks Looking for work during 1 year after | 10 | 17 | 16 | 14 |
| Weeks Looking for work during 2 years after | 18 | 30 | . | . |
| Weeks Inactive during 2 years prior | 22 | 20 | 17 | 19 |
| Weeks Inactive during 1 year prior | 12 | 10 | 10 | 11 |
| Weeks Inactive during 1 year after | 18 | 15 | 13 | 15 |
| Weeks Inactive during 2 years after | 35 | 32 | . | . |
| Weeks Other during 2 years prior | 20 | 20 | 15 | 18 |
| Weeks Other during 1 year prior | 10 | 9 | 7 | 9 |
| Weeks Other during 1 year after | 7 | 7 | x | x |
| Weeks Other during 2 years after | 13 | 14 | . | . |
| Emp only to Emp only at 1 year | 22 | 15 | 21 | 20 |
| LFW only to Emp only at 1 year | 7 | x | 11 | x |
| LFW only to LFW only at 1 year | x | 13 | 9 | x |
Notes to table 5
The information in the table above has been collated from available administrative data. Limitations and variations in the coverage of the data available mean that this information should be used for indicative purposes only.
Figures marked with an x have been supressed for statistical disclosure purposes.
Figures marked with a “.” indicate that the data was not available.
-
See House of Commons Library briefing: Coronavirus: Impact of labour market for further details. ↩
-
Quarterly Service Personnel Statistics (Ministry of Defence, 2023) ↩
-
UK Regular Service Personnel Employment, 1 April 2022 - 31 March 2023 (Ministry of Defence, 2024, p.1) ↩
-
Longer-Term Employment Outcomes of Ex-Service Personnel (Fisher et al, no date) ↩
-
UK Regular Service Personnel Employment, 1 April 2022 - 31 March 2023 (Ministry of Defence, 2024, p.1) ↩
-
Longer-Term Employment Outcomes of Ex-Service Personnel (Fisher et al, no date) ↩
-
From WWTW data we know that most veterans wait significantly longer than two years from leaving the forces before seeking our support, so service employment does not account for those higher rates. ↩