Employment Data Lab Analysis: Street League: Academy, Street Sports and Schools programmes
Published 20 November 2024
Applies to England and Scotland

© Crown copyright 2024
This publication is licensed under the terms of the Open Government Licence v3.0 except where otherwise stated. To view this licence, visit nationalarchives.gov.uk/doc/open-government-licence/version/3 or write to the Information Policy Team, The National Archives, Kew, London TW9 4DU, or email: psi@nationalarchives.gov.uk.
Where we have identified any third party copyright information you will need to obtain permission from the copyright holders concerned.
This publication is available at https://www.gov.uk/government/statistics/employment-data-lab-analysis-street-league-academy-street-sports-and-schools-programmes/employment-data-lab-analysis-street-league-academy-street-sports-and-schools-programmes
This Employment Data Lab report presents an estimate of the impact of Street League’s Academy, Schools and Street Sports programmes on the benefit, employment, and education outcomes of the programme participants. Street League’s programmes are aimed at supporting young people who face barriers getting into work or education through sport-based interventions.
The results in this report have been generated using quasi-experimental techniques which introduce some uncertainty. The results should be used with a degree of caution. Further information can be found in section 8, and in an associated methodology report.
Headline results
Increase in employment at 12 months
The percentage of participants who were classed as Employed twelve months after starting a programme was between 4 and 8 percentage points higher than had they not participated in a programme.
This result was statistically significant.
- The main analysis focuses on a sub-group of 2,193 individuals who participated in England between April 2016 and March 2021 and were between the ages of 18 and 30 when they started the programme. Scottish participants were not included in the main analysis due to data availability.
- Additional sub-analyses were carried out exploring the impact of the COVID-19 pandemic and differences between Street League’s Academy and Street Sports / Schools programmes.
- Participants were followed for two years after starting the programme (although education outcomes were only available for one year).
- Participants were compared to a comparison group of “similar” individuals to evaluate the programme.
- The headline result was chosen as the primary outcome measure to assess the success of the programme. Other secondary outcome measures are also reported.
1. What you need to know
What is the Employment Data Lab?
The Employment Data Lab is a service provided by a team of analysts at the Department for Work and Pensions (DWP). The Data Lab provides group-level benefits and employment information to organisations who have worked with people to help them into employment. The purpose is to provide these organisations with information to help them understand the impact of their programmes.
Which programmes are provided by Street League?
Street League is a registered charity in England and Scotland that uses sport and education to support young people into employment. Street League’s programmes are targeted at individuals aged between 16 and 30, not in education, employment or training (NEET) who face personal barriers to employment.
Street League offers a range of support offerings which have been grouped into two programme types for this analysis: more intensive Academy programmes and Light-touch programmes.
Academy programmes typically last between 10 to 15 weeks with 4 days per week dedicated to the programme. Support includes a combination of classroom sessions, employability workshops, sports and fitness activities, work experience events, employer and college visits and one-to-one mentoring. Participants on Academy programmes have the opportunity to achieve qualifications in subjects including Functional Skills, Wellbeing and Customer Service.
Light-touch programmes focus on involvement in sport as a means to building life and work skills. Light-touch programmes can be broken down into two smaller sub-groups: ‘Street Sports’ and ‘Schools’. Street Sports programmes aim to help young people achieve physical fitness and build networks through participation in free sports sessions such as football and multi-sports. ‘Schools’ sessions aim to increase attainment in young people from low-income families transitioning from school into the workforce by providing mentorship, support and opportunities in the domain of sport within schools. As part of a new organisational strategy, Street League no longer deliver activity in school environments. The introduction of ‘Job Clubs’ focuses on bridging the gap between employers and young people through brokering of employment opportunities and bespoke 1-2-1 support around application processes, interview skills and workplace behaviours.
At the time of analysis, Street League programmes were run in 12 locations in England and Scotland. These were Ayrshire, Birmingham, Dundee and Angus, Edinburgh and the Lothians, Glasgow, Lanarkshire, Leeds, Liverpool, London, Manchester, Renfrewshire, and Sheffield. Participants can begin the programme at any point in the year.
Who was evaluated as part of this analysis?
Street League shared data on 11,430 participants who took part in a programme between April 2016 and March 2021. For reasons of data availability, this initial group was restricted to only those aged between 18 and 30 who participated in England. As a result, the main analysis in this report focusses on a subset of 2,193 participants (19% of the original cohort). For more details see Appendix A.
Participant information
Of the 2,193 participants included in this analysis, the available administrative data indicated:
- 69% were male and 31% were female
- the average age was 20.5 years
- 44% were white, 22% were black, 16% were Asian and 18% were other ethnicities (including missing)
- 10% were on a DWP benefit where these was in indication of a restricted ability to work (RATW) when they started a programme
- 48% had previously been eligible for free school meals between the ages of 14 and 18
- 45% had Special Educational Needs (SEN) provisions between the ages of 14 and 18
- 8% had ever been in care
- 14% had ever been a child in need
- 19% had been excluded from school at any point between the ages of 14 and 18
- 24% were in Employment on starting a programme*
- 52% were in receipt of Looking-for-Work benefits on starting a programme
- 7% were in receipt Inactive benefits on starting a programme
- 25% were in the Other category on starting a programme
Further information about those who were (and were not) included in the analysis and those missing markers in the administrative data can be found in Appendix A and Appendix B.
*Employment flags are generated for individuals present in administrative datasets but may not reflect current employment status for some individuals such as those on zero-hour contracts with no earnings.
This report presents analysis on the impact of Street League’s programmes by comparing employment, benefit, and education related outcomes of participants to those of a matched comparison group who did not participate. The comparison group is used to estimate the outcomes of participants had they not participated in the programme and was created using a method called propensity score matching. Further information about how the analysis was conducted can be found in the associated methodology document.
One primary outcome measure was selected for this evaluation before the analysis was undertaken.
Primary outcome measures
The primary outcome measure for this analysis is:
- The percentage of the group classed as employed twelve months after starting a programme.
The main analysis in this report (section 2, section 3 and section 5) presents the impact of an individual participating in any Street League programme irrespective of whether it was an Academy or Light-touch programme. Section 4 explores the impacts of these two types of programmes separately and section 5 explores the impact of the Covid-19 pandemic.
2. The impacts of the programme over time
This report uses four categories of labour market status in the analysis (see section 8 for more details).
The results for those who started on a Street League programme (Academy or Light-touch) show that the programme led to:
More classed as Employed, at 12 months
Between 4 and 8 percentage points more participants were classed as Employed twelve months after starting the programme, than had they not participated.
This result was statistically significant.
More on a Looking for Work benefit, at 12 months
Between 4 and 8 percentage points more participants were on a Looking for Work benefit 12 months after starting the programme, than had they not participated.
This result was statistically significant.
Fewer on an inactivity benefit, at 12 months
Between 0 and 3 percentage points fewer participants were on an Inactivity benefit 12 months after starting the programme, than had they not participated.
This result was statistically significant.
Fewer classed as “Other”, at 12 months
Between 6 and 10 percentage points fewer participants were classed as Other twelve months after starting the programme, than had they not participated.
This result was statistically significant.
The figures and tables in this section show the impact of the programme on the numbers of people in each labour market category over the twenty-four months after starting an intervention. The participants are compared to a comparison group used to estimate the outcomes had the participants not participated in a programme. The difference between the groups can be interpreted as the impact of the programme.
The results in Figure 1 and Table 1 show that the programmes led to a statistically significant increase in both employment and looking-for-work benefit claims at six, twelve and twenty-four* months after programme start. The results also show a statistically significant decrease in both the number of inactivity benefit claims as well as the number of individuals in the “other” category at six, twelve and twenty-four* months.
Table 2 shows an additional labour market impact measure – the percentage of each group who were employed at any point during the period of twelve and twenty-four months after starting a programme. The results indicate programmes lead to a statistically significant increase in the number of those who were in work at any point during twelve months after programme start of between 10 and 14 percentage points and the number of those who were in work at some point during twenty-four months after programme start of between 9 and 13 percentage points.
Impacts of the programme on other outcome measures can be found in Table 10 in Appendix D. This includes labour market transition variables which track changes in labour market status from the start to one and two years later.
*Results for twenty-four-month outcomes can be found in Appendix D.
Figure 1: Plots showing the impact of the programme on the numbers in each labour market category over time
The plots on the left (in orange) show the percentages of the participants and comparison groups in each category. The difference (or impact of the programme) is shown on the right in blue. The darker blue line shows the central estimate, and the shaded blue area is the 95% confidence interval.
1(a and b) - Employed: The impact plot (b) shows programmes had a large and statistically significant impact upon the percentage of participants in employment in the twenty-four months following programme start. The outcome plot (a) shows that the percentage of the comparison and participant group employed at start was similar, however the participant group increases at a faster rate after programme start.
1(c and d) - Looking for Work: The impact plot (d) shows programmes had a large and statistically significant impact upon the percentage of participants claiming looking for work benefits in the twenty-four months following programme start. The outcome plot (c) shows a decrease in the percentage of both groups in the ‘looking for work’ category, with the percentage for the comparison group decreasing at a faster rate.
1(e and f) - Inactive: The impact plot (f) shows programmes led to a small but statistically significant decrease in the percentage of participants claiming inactivity benefits in the twenty-four months following programme start. The outcome plot (e) shows the percentage of both groups claiming inactivity benefits over the twenty-four months after programme start increased, with the rate of increase being greater for the comparison group.
1(g and h) - Other: The impact plot (h) shows programmes led to a large and statistically significant decrease in the percentage of participants falling into the ‘other’ category in the twenty-four months following programme start. The outcome plot (g) shows the percentage of both groups classed as ‘other’ continued to decrease in the twenty-four months after start, with the rate of decrease being grater for the participant group.
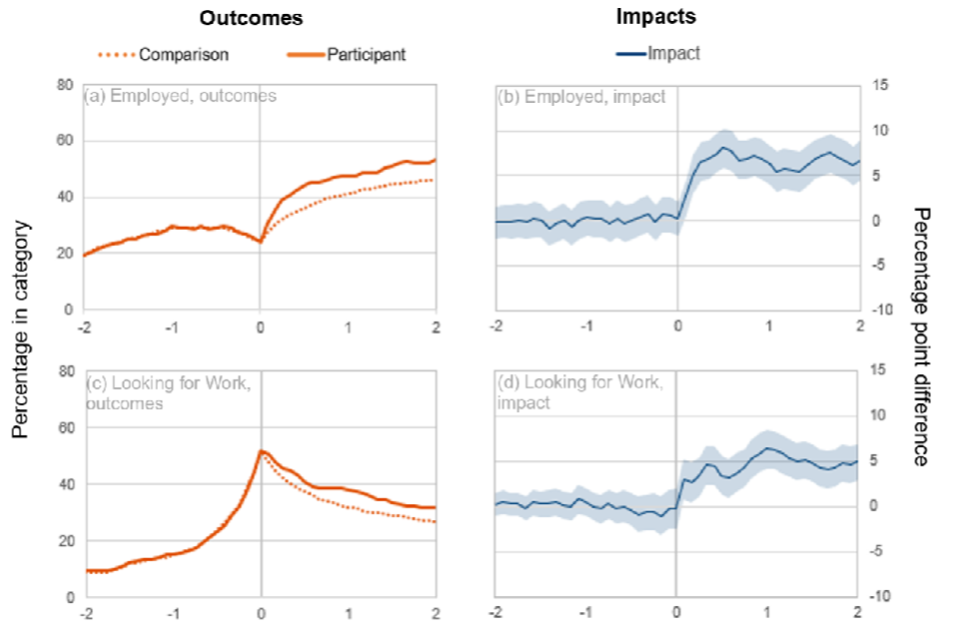
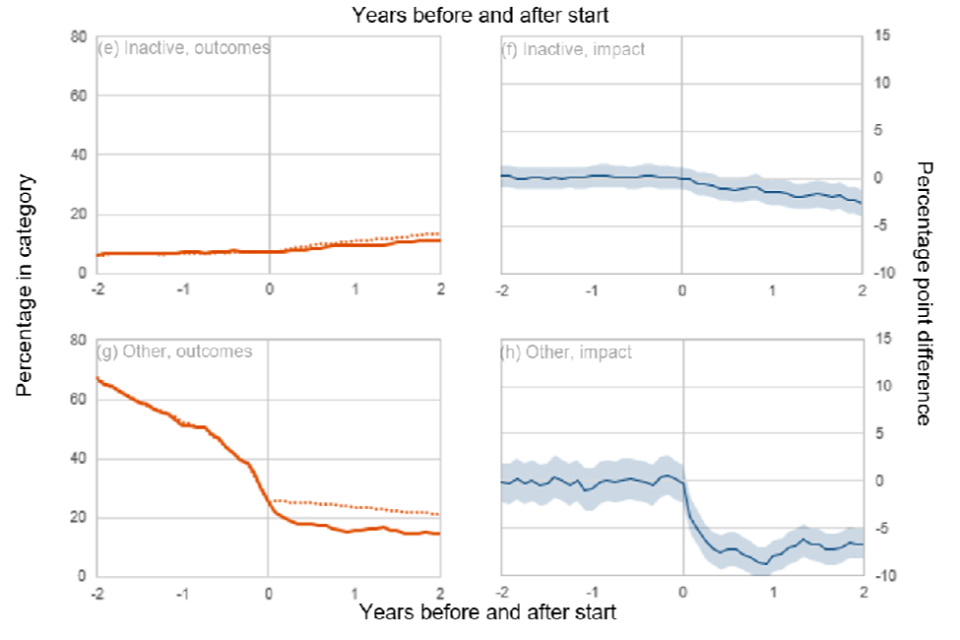
Table 1: Showing the percentage of participants in each labour market category at six and twelve months after starting the programme
The impact, or difference, is shown along with an indication of statistical significance. The “upper” and “lower” values give the confidence interval around the central estimate of the impact.
| Percentage of group in category at 6 and 12 months (%) – Main Run | Participant group | Comparison group | Impact (Central) | Impact (Lower) | Impact (Upper) | Sig. |
|---|---|---|---|---|---|---|
| Employed (6 months) | 44 | 36 | 8 | 6 | 10 | yes |
| Looking for Work (6 months) | 41 | 38 | 3 | 1 | 6 | yes |
| Inactive (6 months) | 8 | 9 | -1 | -2 | 0 | no* |
| Other (6 months) | 18 | 25 | -7 | -9 | -5 | yes |
| Employed (12 months) | 48 | 41 | 6 | 4 | 8 | yes |
| Looking for Work (12 Months) | 38 | 32 | 6 | 4 | 8 | yes |
| Inactive (12 months) | 9 | 11 | -1 | -3 | 0 | yes |
| Other (12 months) | 16 | 24 | -8 | -10 | -6 | yes |
*Significant at the 90% level of confidence.
Note: Categories are not mutually exclusive, so percentages in category do not sum to 100% and impacts do not sum to 0.
Table 2: Showing the percentage of the participant and comparison groups in the Employed category at any point during the twelve and twenty-four months after starting the programme
The impact, or difference, is shown along with an indication of statistical significance.
| Participant group (%) | Comparison group (%) | Impact: Central (ppt) | Impact: Lower (ppt) | Impact: Upper (ppt) | Sig. | |
|---|---|---|---|---|---|---|
| Employed (at any point in the 12 months after start) | 69 | 57 | 12 | 10 | 14 | yes |
| Employed (at any point in the 24 months after start) | 80 | 69 | 11 | 9 | 13 | yes |
3. Impact on education and training
Note: Specific data limitations mean that the figures in this section should be treated with a greater degree of caution. See section 8 for more details.
The figures and tables in this section show the impact of the programme on people passing an education or training course during the twelve months after starting a programme.
Increase in the percentage passing an education or training course
The percentage of participants who passed an education or training course at any point in the twelve months after programme start was between 5 and 9 percentage points greater than it would have been had they not participated.
This result was statistically significant.
Table 3 suggests that Street League programmes resulted in a statistically significant increase in the number of people obtaining qualifications within the first 12 months after starting, of between 5 and 9 percentage points.
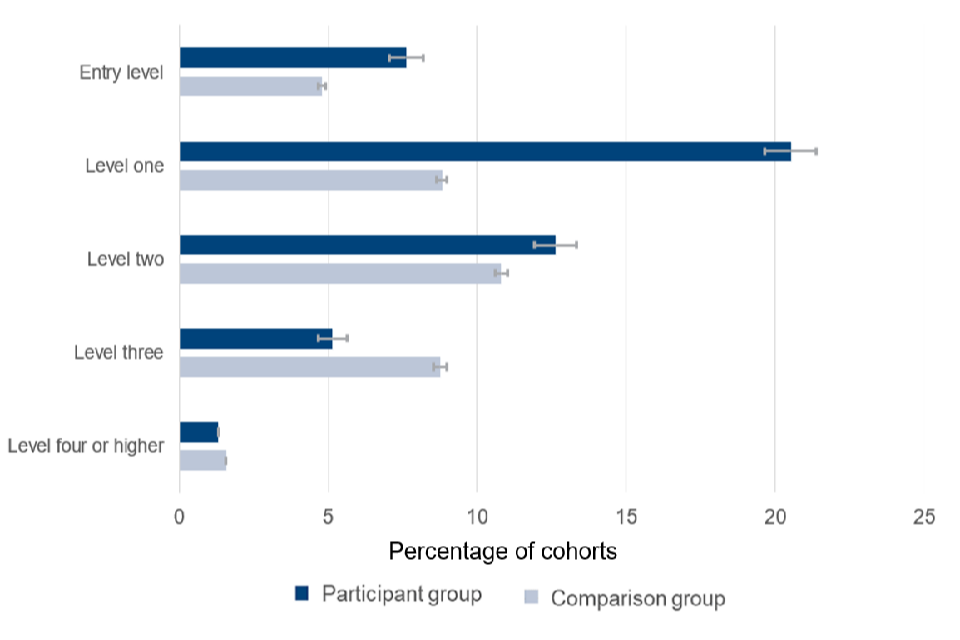
Figure 2 shows the percentage of the participant and comparison groups who obtained a qualification at the stated level during the twelve months after starting a programme. The results suggest Street League’s programmes led to a large, statistically significant increase in the number people passing a level one qualification, as well as more modest increases in those passing entry level and level 2 qualifications. The results also suggest that the programmes led to a statistically significant reduction in the number of people obtaining a level 3 qualification.
Specific data limitations mean that these figures should be treated with a greater degree of caution. See section 8 for more details.
Table 3: Showing the percentage of the participant and comparison groups who obtained a qualification at any level during the twelve months after starting a Street League programme
The impact, or difference, is shown along with an indication of statistical significance.
| Participant group | Comparison group | Impact (Central) | Impact (Lower) | Impact (Upper) | Sig. | |
|---|---|---|---|---|---|---|
| Obtaining qual. at any level (%) | 33 | 27 | 7 | 5 | 9 | yes |
Note: these figures include qualifications obtained for education spells that were active prior individuals starting the programme.
Note: Specific data limitations mean that these figures should be treated with a greater degree of caution. See section 8 for more details.
Figure 2: Showing the percentage of the participant and comparison groups who passed a qualification at the stated level at any point during the twelve months after programme start.
Notes for figure 2:
Level four and higher passed course outcomes were combined for statistical disclosure control reasons.
Individuals passing multiple courses at different levels will appear more than once.
These figures include qualifications obtained for education spells that were active prior individuals starting the programme.
Specific data limitations mean that these figures should be treated with a greater degree of caution. See section 8 for more details.
4. Comparing Academy and Light-touch interventions
For the purposes of this analysis Street League’s employment support provision was split into two types:
- Academy programmes: More intensive employment support programmes run over 10-15 weeks. 1,074 people, 49 percent of the evaluated sample were on an Academy programme.
- Light-touch programmes: Provide mentorship, support and facilitating opportunity in employment through participation in sport. 1,115 people, 51 percent of the evaluated sample participated in Light-touch programmes.
The analysis was repeated for each of the programme types in turn and the full list of results can be found in Tables 11 and 12 in Appendix D. Participant details for each programme can be found in Table 7 in Appendix B. Outcomes plots can be found in Figure 5 in Appendix E.
Table 4 shows, for each programme type, the percentage of the participant and comparison groups in the ‘Employed’ labour market category at six, twelve and twenty-four months after participants started a programme. The results show that both programme types had a positive and statistically significant impact on employment at six months, which persisted (though slightly reduced) for the full twenty-four month follow up period. Notably, the impacts of the Light-touch programmes appear comparable, if not larger, than the impacts of the more intensive, Academy programmes. For example, the Light-touch programmes led to an increase in employment rates of between 6 and 12 percentage points at six months compared to between 4 and 10 percentage points for Academy programmes. At twenty-four months the impact upon employment for Light-touch was between 4 and 10 percentage points compared to between 3 and 9 percentage points for Academy.
Table 5 presents a selection of characteristics for participants who took part in each intervention type. The table shows sizeable differences between the cohorts. For example, a lower percentage of the Academy participants were in employment on starting the programme compared to the Light-touch group (18 percent compared to 30). The Academy group also had higher percentages on a looking for work benefit at start (56 percent compared to 48), a higher percentage with flags indicating historical free school meal eligibility (52 percent compared to 45), a higher percentage with a flag indicating special educational needs (51 percent compared to 38 percent) and a lower percentage with a level 3 educational qualification at start (35 percent compared to 41 percent). These differences are statistically significant and indicate genuine differences between the average participants of each group. As a result, one should be cautious about direct comparisons between the impacts of each programme type. The figures suggest that the average participant on Academy programme may face more barriers and be further from the labour market than participants of the Light-touch programmes. This may go some way to explaining the similar impact estimates on employment despite differences in the nature and intensity of the programmes.
Table 4: Showing the percentage of the Academy and Light-touch cohorts in Employment at six, twelve and twenty-four months after starting a programme
The impact, or difference, is shown along with an indication of statistical significance. The “upper” and “lower” give the confidence interval around the central estimate of the impact.
| Percentage of cohort in Employment at 6, 12 and 24 months (%) | Participant group | Comparison group | Impact (Central) | Impact (Lower) | Impact (Upper) | Sig. |
|---|---|---|---|---|---|---|
| Academy (6 months) | 39 | 32 | 7 | 4 | 10 | Yes |
| Light Touch (6 months) | 49 | 40 | 9 | 6 | 12 | yes |
| Academy (12 months) | 43 | 37 | 6 | 3 | 9 | yes |
| Light Touch (12 months) | 52 | 45 | 7 | 4 | 10 | yes |
| Academy (24 months) | 48 | 43 | 6 | 3 | 9 | yes |
| Light Touch (24 months) | 57 | 50 | 7 | 4 | 10 | yes |
Table 5 showing participant characteristics for Academy and Light-touch cohorts based on available records in administrative data
| Characteristic | Academy | Light-touch |
|---|---|---|
| Number of participants | 1,074 | 1,115 |
| Restricted Ability to Work (at start) (%) * | 11 | 8 |
| Free School Meals (between age 14-18) (%) | 52 | 45 |
| Special Educational Needs (between age 14-18) (%) | 51 | 38 |
| Previously left care / been adopted (%) | 7 | 8 |
| Child in need (previously or currently) (%) | 14 | 15 |
| Level three qualifications (at start) (%) | 35 | 41 |
| Level four qualifications (at start) (%) | 5 | 10 |
| Level five qualifications (at start) (%) | 4 | 9 |
| Level six qualifications (at start) (%) | 4 | 8 |
| Enrolled in education course at programme start (%) | 40 | 38 |
| Employed (at start) (%) ** | 18 | 30 |
| Looking for Work (at start) (%) | 56 | 48 |
| Inactive (at start) (%) | 8 | 7 |
| Other (at start) (%) | 26 | 24 |
Notes for table 5:
The information in the table above has been collated from available administrative data. Limitations and variations in the coverage of the data available mean that this information should be used for indicative purposes only.
*This relates to individuals on a DWP benefit where there is an indication of a restricted ability to work.
**Employment flags are generated for individuals present in administrative datasets but may not reflect self-identified employment status for some individuals, such as those on zero-hour contracts with no earnings.
5. Covid-19 Impact
The programme spans the period of the COVID-19 pandemic. The pandemic and the associated lockdowns which took place between March 2020 and the summer of 2021 had significant impacts on the labour market in England, with large swings in employment, unemployment, and inactivity rates. See Coronavirus: Impact on the labour market (House of Commons Library briefing) for further details.
Street League’s programme delivery was moved online during the COVID pandemic. Street League ensured, where necessary, programme participants were provided with both the IT and data required to participate remotely. Practical elements of courses involved team building exercises, walks or runs which were tracked using Strava, and fitness circuits which could be completed at home. Session duration was unaffected by the pandemic.
To explore the impacts of the pandemic on the participants and their outcomes, a sub-analysis was carried out that split the participants into two cohorts; one where the programme delivery and one-year outcomes were not impacted by the pandemic, and another where they were:
-
Pre-COVID – Participants who started a programme (either Academy or Light Touch) before 1 April 2019. For this cohort the program delivery and one-year outcomes would be largely unaffected by the COVID-19 pandemic. There were 1,401 pre-COVID participants.
-
COVID impacted – Participants who started a programme (either Academy or Light Touch) between 1 April 2019 and 31 March 2021. For this group the one-year outcomes (and for some, the program delivery) were impacted by the COVID-19 pandemic. There were 786 COVID impacted participants.
In this section, the analysis was repeated for each cohort in turn. A selection of the results are presented below in Table 6. A fuller list of outputs and results can be found in Figure 6 and Table 7, 13 and 14 in the Appendices.
Table 6 below shows the percentages in the ‘Employed’ and ‘Looking for Work’ labour market categories at twelve months after programme start for each of the two cohorts. The results show only modest differences in the impact of Street League’s programmes between the two cohorts. The impact on employment twelve months after start appeared roughly similar between the cohorts with a 3 to 11 percentage point increase for the COVID-impacted cohort in comparison to the pre-COVID cohort where the increase was between 3 and 9 percentage points.
Perhaps the most notable difference is in the percentages of each cohort claiming a Looking for Work benefit. For example, 12 months after starting, 33 percent of participants in the pre-COVID cohort were claiming a looking for work benefit, compared to 47 percent in the COVID impacted cohort. This 14-percentage point difference is statistically significant and represents a 42 percent difference.
Table 6: Showing the percentage of the Pre-COVID and COVID impacted cohorts in labour market categories at twelve months after starting the programme
| Percentage of cohort in labour market category at 12 after start | Participant group | Comparison group | Impact (Central) | Impact (Lower) | Impact (Upper) | Sig. |
|---|---|---|---|---|---|---|
| Employed (Pre-Covid) | 48 | 42 | 6 | 3 | 9 | yes |
| Employed (Covid impacted) | 47 | 40 | 7 | 3 | 11 | yes |
| Looking for Work (Pre-Covid) | 33 | 26 | 7 | 4 | 9 | yes |
| Looking for Work (Covid impacted) | 47 | 41 | 6 | 2 | 10 | yes |
Note: Categories are not mutually exclusive, so percentages in category do not sum to 100% and impacts do not sum to 0.
6. How to use the results of this report
One primary outcome measure was chosen to assess the success of this programme. The results suggest that the programme had pronounced, positive, and statistically significant impacts on this measure. This suggests the programme has been successful at:
- increasing employment among participants during the twelve months after starting a programme
A range of secondary outcome measures were also analysed in this report (see Appendix D and can be used to learn more about the impacts of the programme. Results marked as statistically significant indicate an estimate that is unlikely to have occurred by chance (and more likely to be real). If a result is not statistically significant it does not mean that there was no impact, it just means there was insufficient evidence to verify this to the required threshold.
The estimates in this report were generated using quasi-experimental methods that can be less reliable than experimental methods such as a randomised control trial. The results should be used with a degree of caution.
The estimates were also generated using a subset of the Street League participants, notably those in the age range of 18 to 30 and those who were administered a programme in England. Care should be taken in generalising the results to those outside of this age range, and those who attended a programme in Scotland.
The estimates relate to a programme working in a particular context. This report makes no assessment as to whether these impacts are generalisable to different contexts. The estimates were also made in a “business as usual” setting where participants and comparators were free to go on to access other support. Notably 13 percent of the 2,193 Street League programme participants in the main analysis went on to participate in a DWP related programme in the two years after starting with Street League. For the comparison group the figure was 11 percent. This difference was statistically significant.
7. Street League in their own words
Our organisation
We believe Street League is an incredibly special organisation, which achieves significant, life changing positive impact on the lives of the young people that we serve. This is down to the talent and commitment of our people. Our staff act as the key relationship that can make a difference in young people’s lives. For many young people our staff act as ‘the significant other’ that can help save or change the direction of their life for the better.
Humbly, we know that our programmes and services make a very big impact on those young people as we see the results of our work every day. From internal analysis, last year we progressed 1,317 young people into work education and employment, with 694 of those being jobs. In the last six years we have progressed 7,959 young people into work education and employment. We deliver our services across the UK in over 40 different and diverse communities where we see the very difficult personal and environmental challenges that young people face.
Street League are delighted to work with the DWP Employment Data Lab and have independently verified, longitudinal, empirical evidence that validates our assumptions of the impact we make on the lives of unemployed young people. The fact that our services have a statistically significant impact on both employability and sustained employment at 12 months is something that we celebrate. This is a direct result of our incredible staff and how they serve our young people, also underpinning this is the support from our long-term financial stakeholders and funders who enable this work to happen.
There is further strength within the results when we consider the diversity and geographic spread of the group of young people the DWP Employment Data Lab examined. This earns Street League significant credibility which can only help support our reputation as we look to deliver our mission. The DWP Employment Data Lab reviewed the long-term employability status of 2,193 ex Street League participants with a broad demographic and gender mix. 45% had special educational needs, 19% had been excluded from school, 48% had previously qualified for free school meals due to their economic and social status and 8% had been in or were, care experienced.
Making the move into adulthood is not easy and our young people can face extra and complex challenges including housing insecurity, poor mental health, incredibly low confidence, low or no academic attainment, care responsibilities for infirm parents or younger siblings, no support network or access to money or welfare. We believe in our young people we don’t believe in labels, common misconceptions or rhetoric about their lack of motivation or difference from ‘older generations’. We know that with support that they can be active citizens in their own right. Our staff act as the change agent to give young people ‘a leg up’ to realise their potential.
Our services have the incredible mix of sport, learning and employability which is a powerful tool to help reset and rebuild a young person’s life. Unemployment, low or no qualifications and poor physical and mental health all have a very significant bearing on the life chances and life expectancy of our young people. Our model is mission focussed and directly works against these factors by attempting to lift a young person out of their challenging circumstances and set them on a new path with more options, choices and opportunities for a better life. We look forward to working with and again learning from the efforts of the team at the DWP Employment Data Lab.
Our response to the analysis
The analysis conducted by the Data Lab provides valuable insights into the impact of Street League’s programmes, and we appreciate their thorough examination and the significant findings they have highlighted. Here, we provide our response to the main points raised in their report, contextualised within our organisational mission and approach.
Employment, Education and Training
The key statistically significant finding of the analysis is the positive impact on the overall employment rates among our participants compared to those who did not participate in our programmes. This highlights our programme’s effectiveness in facilitating employment and supporting participants in overcoming barriers to job entry. It underscores the quality and intentionality of our programme delivery, which are crucial to achieving these positive outcomes.
The analysis further reveals an increase in the percentage of participants passing education or training courses within twelve months of starting our programmes. This statistically significant finding is very encouraging, suggesting that our programmes not only provide immediate benefits but also help participants develop learning skills and understanding that extend beyond our courses. By focusing on soft skills development, we enable participants to progress and succeed in learning environments beyond Street League.
The analysis also shows a decrease in the number of participants categorised as ‘Other’ in terms of their employment status. A reduction in this category suggests that our programmes effectively encourage participants to move towards more defined and positive employment statuses.
Finally, there is evidence of a reduction in the number of participants claiming Inactivity benefits. This significant finding highlights our success in helping individuals transition from inactivity to active participation in the labour market, demonstrating that our programmes are working as intended.
Insight into Street League Programmes
The analysis reveals that participants in our Academy programme face more barriers and are further from the labour market compared to those in our Light-touch programmes. This result aligns with our expectations, as participants with more significant challenges typically require more intensive support, which is why they are directed to the Academy programmes. In essence, participants with more barriers are generally further from the labour market, and our Academy programmes are tailored to address their specific needs. The statistically significant differences between the two programmes highlight the need for careful consideration when analysing data from these two groups internally to ensure accurate and meaningful results.
The impact of our programmes on employment outcomes shows only modest differences between cohorts affected by COVID-19 and those from the pre-COVID period. This similarity suggests that, regardless of circumstances, the impact of our programmes remains consistent. This consistency underscores the enduring effectiveness of our interventions, despite external challenges.
One notable difference highlighted by the analysis is the increase in the number of participants claiming Looking for Work benefits. Twelve months after starting the programme, a higher percentage of the COVID-impacted cohort were claiming these benefits compared to the pre-COVID cohort. This discrepancy may reflect the broader challenges faced by participants during the pandemic, such as redundancy and job market instability, which increased the number of individuals actively seeking employment and claiming benefits.
Conclusion
In summary, the analysis provides robust evidence of the positive impact of our programmes on participants’ educational achievements, employment rates, and benefit claims. These findings reinforce the importance of our work and motivate us to continue refining and expanding our interventions. We remain committed to supporting individuals facing barriers to employment and making a meaningful difference in their lives. The success of our model, which combines sport, learning, and employability, is evident in the progress of the participants we serve, and we are dedicated to further enhancing these outcomes in the communities we work in.
8. About these statistics
This report presents estimates of the impact of a programme. This is achieved by comparing the outcomes of the programme participants to a credible estimate of their outcomes had they not participated in the programme. This is often referred to as the counterfactual. In this report the counterfactual was generated using a quasi-experimental technique called propensity score matching (PSM). This involves constructing a comparison group of individuals, who did not participate in the programme but who are matched on key characteristics that affect whether an individual takes part in the programme and the outcomes that they experience as a result of participation.
Once this comparison group has been constructed the outcomes of the two groups can be compared to generate the estimate of the impact of the programme. More information about this technique and how it is used in the Data Lab can be found in the methodology report.
Categorisation
The analysis in this report is based on the labour market outcomes of the participants (and a matched comparison group) in the two years before and after starting the intervention. This report uses four categories of labour market status for the analysis, detailed below.
-
Employed: People who are either employed or self-employed
-
Looking for Work: People who are in receipt of Jobseekers Allowance (JSA), or in the Universal Credit (UC) “intensive work search”, “light touch out of work”, “light touch in work”, or “working enough” conditionality regimes.
-
Inactive: People who are in receipt of inactive benefits such as Employment and Support Allowance (ESA) or in the UC “no work requirements” or “work focussed interview” conditionality regimes. Several other benefits also fall into this category, though the numbers of people on these benefits is small. See methodology report for details.
-
Other: People who do not fall into the above three categories, this could include people who are in full-time education and not working or receiving benefits or those who are in custody.
These categories are not mutually exclusive, and it is possible to be in more than one category. For example, someone working fewer than 16 hours a week may also be in receipt of JSA and would be classed as “employed” and “looking for work”.
Statistical significance
The report highlights if the results are statistically significant or not. A statistically significant result is one that is unlikely to have occurred by chance because of sampling error. If a result is not statistically significant it does not mean that the intervention has no impact, it simply means that there is not enough evidence to verify this to a required threshold. In this report, unless otherwise stated, the threshold for significance is 95%.
This report sometimes presents the central estimate of a result along with the upper and lower confidence values. These upper and lower values create a range that you would expect the estimate to fall within if the test was to be redone, within a certain level of confidence. This level is set at 95 per cent unless otherwise stated. The confidence intervals will typically be stated in the tables of results and be presented on graphs and plots as either error bars or shaded regions.
Limitations
The validity of the technique used in this report rests on the assumption that all the characteristics that are linked to a person’s participation in the programme and the outcome variables of interest have been sufficiently accounted for in the analysis, either explicitly or otherwise. This is a strong assumption that cannot be tested and depends on the data available and on the nature of each programme and its participants. This is reviewed on a case-by-case basis in the Data Lab and impact evaluations are only carried out where the validity of this assumption is plausible. That said, these are quasi-experimental techniques that tend to be less robust than true experimental methods, such as a randomised control trial, and the results must be treated with a degree of caution.
Throughout this report it is highlighted that particular caution should be applied when using and interpreting the education related results. The reason for this stems from the fact that the education spells data relates to enrolment on a course, and actual attendance and/or drop-outs are not always captured and accounted for. This has the potential for someone to appear as though they are in education when in practice they are not (for example if they enrolled on a course and subsequently dropped out). Since these programmes are aimed at people who are NEET, i.e. Not in Employment, Education or Training, it is possible that this issue would be more likely to affect the participant group than the comparison group, therefore introducing some bias into the results. Whilst there are indications in the data that this sort of bias may be present to a degree, sensitivity analyses have been conducted providing reassurance that the benefit and employment related impact estimates are robust. The education related impacts are more exposed to this potential issue and therefore should be treated with more caution.
Where to find out more
Read the Employment Data Lab analysis, information and guidance.
9. Statement of compliance with the Code of Practice for Statistics
The Code of Practice for Statistics (the Code) is built around 3 main concepts, or pillars:
- Trustworthiness – is about having confidence in the people and organisations that publish statistics
- Quality – is about using data and methods that produce statistics
- Value – is about publishing statistics that support society’s needs
The following explains how we have applied the pillars of the Code in a proportionate way.
Trustworthiness
Employment Data Lab reports, such as this, are published to provide User Organisations with an estimate of the impact of their programmes that support employment. Releasing them via an ad hoc publication will give equal access to all those with an interest in them.
Quality
The methodology used to produce the information in this report has been developed by DWP analysts in conjunction with the Institute for Employment Studies. The information is based on data from the User Organisation and Government administrative data. The calculations have been quality assured by DWP analysts to ensure they are robust.
Value
Producing and releasing these estimates provides User Organisations and the public with useful information about employment support provision that they may not have otherwise been able to generate or obtain.
Appendix A: Exclusions from the treatment group
Street League shared data on 11,430 participants who took part in the programme between April 2016 and March 2021. The analysis focussed on a subset of these participants who were between 18 and 30 years old when they started a programme and received an intervention in England. This was to ensure that participants were unlikely to be in compulsory full-time education one year after starting the programme, and that they had coverage in the education and training data available to DWP.
Where individuals participated in more than one programme the programme with the earliest start date was selected as their reference programme. For example, if someone enrolled on Light-touch programme and then an Academy programme sometime later the Light-touch programme and its associated start date would be selected for use in the analysis.
Figure 3 shows the distribution of programme start dates for all 10,773 programme participants who could be matched to administrative data, along with reasons for exclusions from the analysis. The blue sections show the start dates for the final subset that were included in the main analysis.
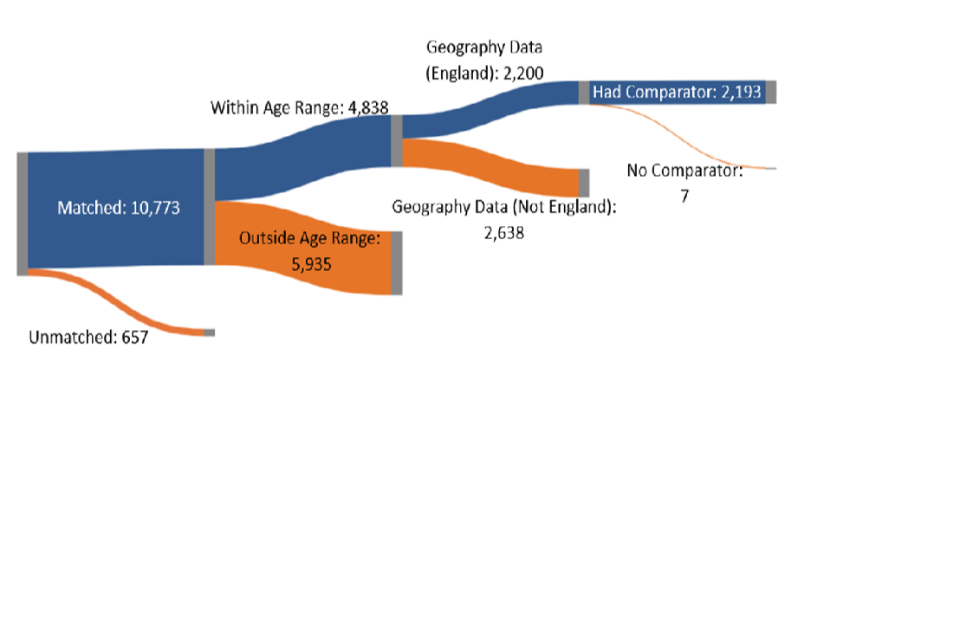
Figure 4 shows the stages that individuals were excluded from the analytical process. The final group of 2,193 participants represent 19% of the matched participants who took part in a programme during the analysis period. Since this analysis is based on a subset of participants care should be taken when generalising the results to the full programme.
Figure 3 showing the distribution of start dates of all matched programme participants sent across by Street League
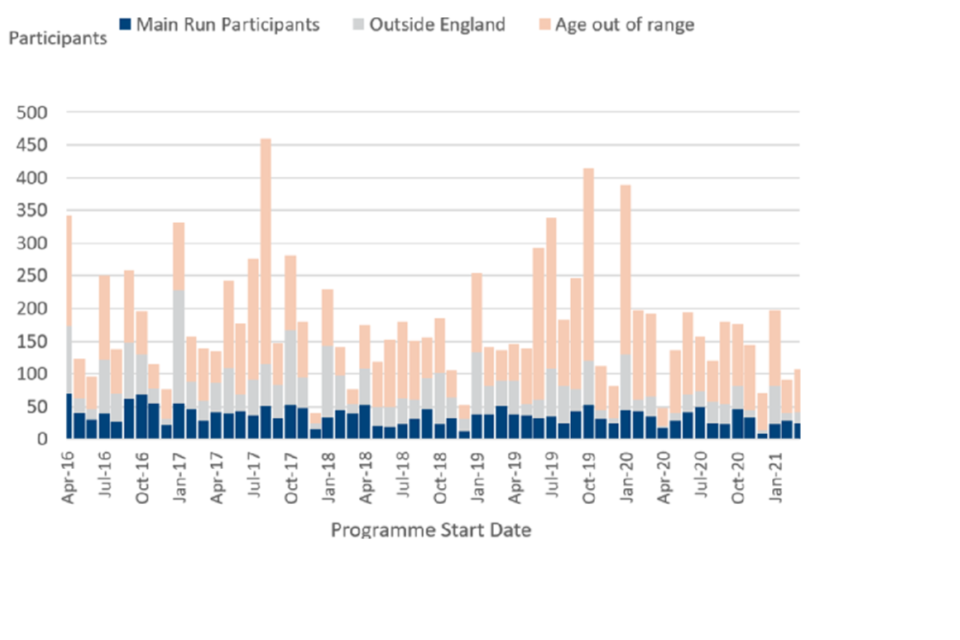
Figure 4 presents a diagram showing the numbers of Street League participants shared with DWP and the stages at which they were excluded from the analysis
Appendix B: Participant group information
The following table displays the participant group information for the full analysis sample and sub-groups. This is broken down into the “evaluated”; those who were selected for the evaluation, the “non-evaluated”; those who were excluded from the evaluation, and “all” of the treated, for whom data was available.
Table 7 shows personal characteristics for each of the cohorts which have been mentioned in this report. This includes: the 2,193 evaluated participants, the 8,580 non-evaluated participants who either did not fit the age range or were administered a programme in Scotland, all participants who could be matched to admin data, Academy and Light-touch cohorts and pre-COVID and COVID Impacted cohorts.
Table 7 showing characteristics, benefits and employment information for those who participated in a Street League programme
This is broken down into the “evaluated”; those who were selected for the evaluation, the “non-evaluated”; those who were excluded from the evaluation, and “all” of the participants, for whom data was available. This table only includes participants who could be linked to the administrative data.
See table 7 in:
- Tables: Street League: Academy, Street Sports and Schools programmes (open document spreadsheet)
- Tables: Street League: Academy, Street Sports and Schools programmes (Excel)
Appendix C: Matching the comparison group
The analysis in the report uses a technique called Propensity Score Matching (PSM) to construct a comparison group of individuals that are matched on key characteristics that are linked to a person’s participation in the Programme and the outcome variables of interest. More information about this technique and how it is used in the Data Lab can be found in the methodology report.
The comparison pool was selected from the Department for Education’s (DfE) administration data and was restricted to only include individuals who were in the same age range as the participants at the time of the programme start. This group was then randomly assigned a pseudo-start date in a way that matched the distribution of participant start dates. This group was then reduced further in several steps:
- The comparison group was restricted to geographical locations (NUTS2 (Nomenclature of Territorial Units for Statistics level 2)) that the programme was run in, ensuring the locations of the comparison group matched the participant group.
- The comparison pool was reduced further through stratified sampling. This ensures the proportions of key variables are consistent between the comparison and participant pools. The comparison pool was stratified on age, sex, percentage of participants who were neither in work or enrolled on an education or training course at start as well as the percentage of participants in work at start, and the percentage of participants who were ever excluded from school.
These steps resulted in a comparison pool of 167,124 individuals who were then used in the matching process.
The matching estimator used to generate the impact estimates presented in this report was nearest neighbour matching using 100 nearest neighbours and a bandwidth of 0.01. Nearest neighbour matching involves running through each participant and matching them with the closest eligible individuals from the comparison pool, determined by closeness of the propensity scores. The sensitivity of the impact estimates to the choice of matching estimator was tested using a range of estimators and found to be insensitive. Further information about matching estimators can be found in the methodology and literature review documents.
Table 8 below shows a sample of the variables used in the matching process and the mean values of these variables both before and after matching for the main run. These tables show that before matching the participant and comparison groups are not well matched, or balanced, shown by sizeable differences in the mean values. After matching the mean values of the participant and comparison groups are much closer. The percent bias and p-value columns provide information on how big the residual difference is and if this difference is statistically significant. Ideally one would like the percent biases to be small (below 5%) and there to be no statistically significant differences i.e., p-values above 0.05 (the 95 percent confidence level threshold).
Table 9 also presents some summary statistics that relate to how well matched the participant and comparison groups are for each of the sensitivity runs. It shows values for Rubin’s B, Rubin’s R and the maximum and median percent biases, all of which meet commonly accepted thresholds for the selected approach (see the methodology report for more details). These tables also shows there was a maximum of only 6 participants (0.004 percent) who were off support across all runs, a sufficiently small percentage so as not to raise concerns about the representativeness of the results.
Table 8 showing mean value of each control variable for the main run, before and after matching
See table 8 in:
- Tables: Street League: Academy, Street Sports and Schools programmes (open document spreadsheet)
- Tables: Street League: Academy, Street Sports and Schools programmes (Excel)
Note:
- Some figures have been suppressed for disclosure control purposes.
- The definition of the matching variables can be found in the methodology document.
Table 9: PSM summary statistics used to assess the success of the matching for the main analytical run
Summary Statistics
| Matching Estimator | 100 Nearest Neighbours |
|---|---|
| Bandwidth/Calliper | 0.01 |
| Rubin’s B | 12.11 |
| Rubin’s R | 1.01 |
| Max % bias | 3.55% |
| Median % bias | 0.71% |
| Number on support | 2,193 |
| Number off support | 6 |
| Percent off support | 0.003% |
Appendix D: Tables of results
Table 10 showing the full list of generated results for the main run featuring all participants aged between 18 and 30, in England and who started a programme before or on 31 March 2021
See table 10 in:
- Tables: Street League: Academy, Street Sports and Schools programmes (open document spreadsheet)
- Tables: Street League: Academy, Street Sports and Schools programmes (Excel)
Note: Some figures have been suppressed for disclosure control purposes.
Table 11 showing a full list of generated results for evaluated Academy participants
See table 11 in:
- Tables: Street League: Academy, Street Sports and Schools programmes (open document spreadsheet)
- Tables: Street League: Academy, Street Sports and Schools programmes (Excel)
Note: Some figures have been suppressed for disclosure control purposes.
Table 12 showing a full list of generated results for evaluated Light-touch participants
See table 12 in:
- Tables: Street League: Academy, Street Sports and Schools programmes (open document spreadsheet)
- Tables: Street League: Academy, Street Sports and Schools programmes (Excel)
Note: Some figures have been suppressed for disclosure control purposes.
Table 13 showing a full list of generated results for the pre-COVID cohort who started before 1 April 2019
See table 13 in:
- Tables: Street League: Academy, Street Sports and Schools programmes (open document spreadsheet)
- Tables: Street League: Academy, Street Sports and Schools programmes (Excel)
Note: Some figures have been suppressed for disclosure control purposes.
Table 14 showing a full list of generated results for the COVID impacted cohort who started on or after 1 April 2019
See table 14 in:
- Tables: Street League: Academy, Street Sports and Schools programmes (open document spreadsheet)
- Tables: Street League: Academy, Street Sports and Schools programmes (Excel)
Note: Some figures have been suppressed for disclosure control purposes.
Appendix E: Programme subgroup and COVID-19 outcome plots
Figure 5: Plots showing the percentage of participants and comparators in the four labour market categories for the Programme sub analysis
The solid lines show the participant group, and the dotted lines show the comparison group. The dark blue lines show the ‘Employed’ category, the dark orange lines show the ‘Looking for work’ category, the light blue lines show the ‘Inactive’ category, and the light orange lines show the ‘Other’ category.
5(a) – Shows the labour market outcomes of the Academy starters in the participant and comparison groups.
5(b) – Shows the labour market outcomes of the Light-touch starters in the participant and comparison groups.
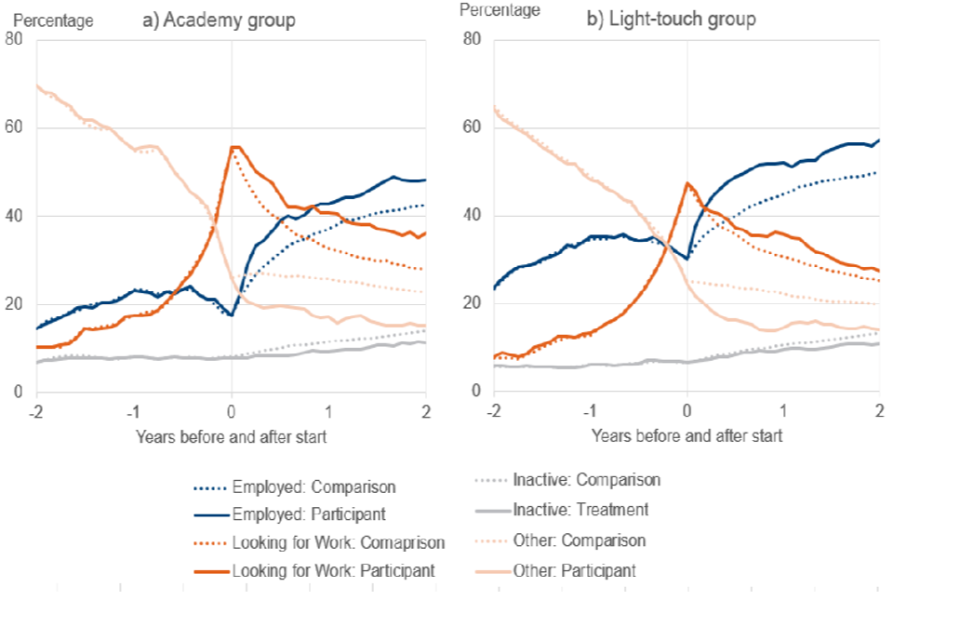
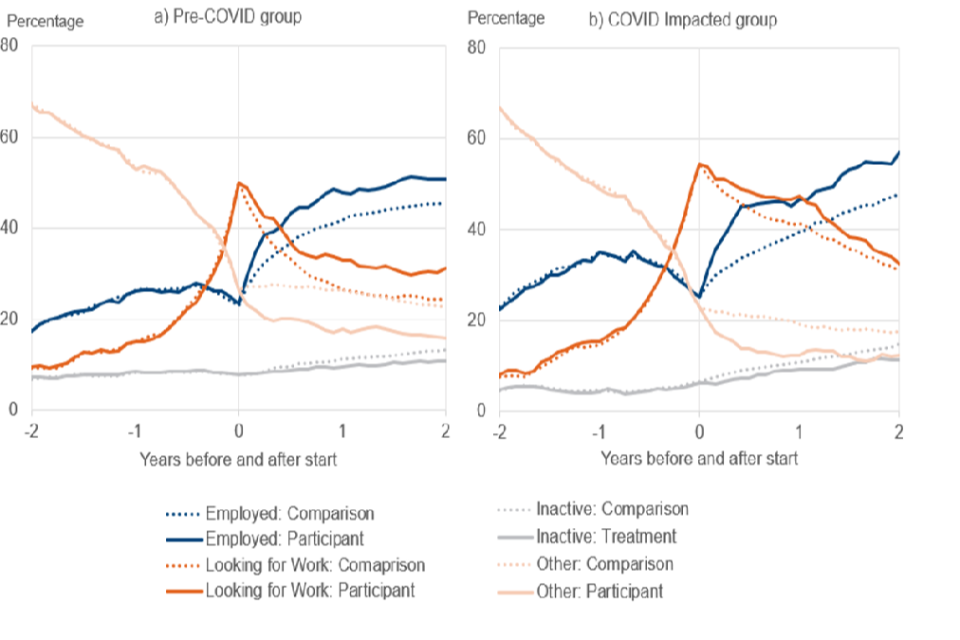
Figure 6: Plots showing the percentage of participants and comparators in the four labour market categories for the COVID sub analysis
The solid lines show the participant group, and the dotted lines show the comparison group. The dark blue lines show the ‘Employed’ category, the dark orange lines show the ‘Looking for work’ category, the light blue lines show the ‘Inactive’ category, and the light orange lines show the ‘Other’ category.
6(a) – Shows the labour market outcomes of the pre-COVID starters in the participant and comparison groups.
6(b) – Shows the labour market outcomes of the COVID impacted starters in the participant and comparison groups.
Appendix F: Glossary of Terms
| Term | Meaning |
|---|---|
| Common support/ On Support/ Off support | Once propensity scores have been assigned for each observation, the overlap of propensity scores between the participants and comparison group is called ‘common support’. Those who fall in the overlap are referred to as ‘on support’, those who do not fall into the overlap are ‘off support’. |
| Comparison group | Carefully selected subset of the comparison pool, selected to have outcomes as similar as possible, to act as a counterfactual. |
| DfE | Department for Education |
| DLA | Disability Living Allowance |
| DWP | The Department for Work and Pensions |
| ESA | Employment and Support Allowance |
| FSM | Free School Meals |
| JSA | Jobseeker’s Allowance |
| NEET | Not in Employment, Education or Training |
| Participant group | The people who took part in the programme being evaluated. |
| PIP | Personal Independence Payment |
| Programme | The employment support provision under investigation. |
| Pseudo-start date | Dates assigned to the comparison pool in lieu of the real programme start dates of the participant group. |
| PSM | Propensity Score Matching |
| Quasi-Experimental | An experimental technique that looks to establish a cause and effect relationship between two variables, where the assignment to the participant or comparison group is not random. |
| Rubin’s B & R | A test used to evaluate the matching in PSM |
| SEN | Special Educational Needs |
| Statistically significant | Describes a result where the likelihood of observing that result by chance, where there is no genuine underlying difference, is less than a set threshold. In the Data Lab reports, this is set at 5 per cent. |
| UC | Universal Credit |
| User Organisation | The organisation using the employment data lab service. |