Employment Data Lab Analysis: Springboard Hull and Humber programme
Published 25 March 2025

© Crown copyright 2025
This publication is licensed under the terms of the Open Government Licence v3.0 except where otherwise stated. To view this licence, visit nationalarchives.gov.uk/doc/open-government-licence/version/3 or write to the Information Policy Team, The National Archives, Kew, London TW9 4DU, or email: psi@nationalarchives.gov.uk.
Where we have identified any third party copyright information you will need to obtain permission from the copyright holders concerned.
This publication is available at https://www.gov.uk/government/statistics/employment-data-lab-analysis-springboard-hull-and-humber-programme/employment-data-lab-analysis-springboard-hull-and-humber-programme
This Employment Data Lab report presents an estimate of the impact of the Springboard Hull and Humber programme, on the benefit, employment, and education outcomes of the programme participants. The Springboard Hull and Humber programme is aimed at supporting 16 to 29-year-olds who face barriers getting into work or education.
The results in this report have been generated using quasi-experimental techniques which introduce some uncertainty. The results should be used with a degree of caution. Further information can be found in section 8 and in an associated methodology report.
Headline results:
Increase in employment
Between 2 and 7 percentage points more programme participants were classed as employed 2 years after starting the programme, than had they not participated. This result was statistically significant.
Increase in education and training courses passed
The percentage of participants who passed an education course 2 years after start, was between 1 and 5 percentage points higher than had they not participated. This result was statistically significant.
-
The main analysis focuses on a sub-group of 2,264 evaluated participants (out of 3,050) who were between the ages of 18 and 29 when they started the programme and received the intervention between 6 April 2016 and 15 April 2020.
-
Additional sub-analyses were carried out exploring the impact of the programme on those with special educational needs (SEN) provisions and the impact of the COVID-19 pandemic.
-
For this report the Employment Data Lab team followed participants for 2 years after starting the programme.
-
Participants were compared to a comparison group of “similar” individuals to evaluate the programme.
-
The 2 headline results were chosen as the primary outcomes measures to assess the success of the programme.
1. What you need to know
What is the Employment Data Lab?
The Employment Data Lab is a service provided by a team of analysts at the Department for Work and Pensions (DWP). The Data Lab provides group-level benefits and employment information to organisations who have worked with people to help them into employment. The purpose is to provide these organisations with information to help them understand the impact of their programmes.
What is the Springboard Hull and Humber programme?
The Springboard programme was a partnership project led by Humber Learning Consortium, that supported economically inactive and long term unemployed 16 to 29-year-olds into work (or self-employment) and further learning in the City of Hull and surrounding areas of East Riding of Yorkshire, North Lincolnshire and Northeast Lincolnshire. Humber Learning Consortium worked alongside 19 delivery partners to deliver the programme.
Support could include one-to-one employment mentoring, mental health support and a variety of work experience placements and vocational courses. Examples of such provision includes weekly job clubs helping with CV writing and functional Maths and English workshops.
Furthermore, Intermediate Labour Market (ILM) support was aimed at those who were long-term unemployed. The ILM support provided paid work experience placements initially connected to Hull’s creative industries and hospitality firms and post lockdown connected to community and voluntary organisations as well. The programme also provided self-employment support via weekly enterprise/business idea sessions.
There have been markedly different programme delivery phases, Pre-August 2021 overall ILM programme lengths were generally longer, with some nearly 7 and a half months (and COVID lockdowns 2019 to 2021 directly contributed to extended programmes) compared to just over 4 months from August 2021 to close in November 2023. The paid work placement element was also longer at the beginning of the programme, circa 20 weeks, reducing to 12 weeks and again to 4 weeks after April 2021.
Who was evaluated as part of this analysis?
Data was shared on 3,050 participants who took part in the programme between April 2016 and December 2022. The main impact analysis focusses on a subset of 2,264 participants who were between 18 and 29 when they started the programme. For more details see Appendix A.
The analysis in this report
This report presents analysis on the impact of the Springboard Hull and Humber programme by comparing employment, benefit, and education-related outcomes of participants to those of a matched comparison group who did not participate. The comparison group is used to estimate the outcomes of participants had they not participated in the programme and was created using a method called propensity score matching (PSM). Further information about how the analysis was conducted can be found in the associated methodology document.
The following primary outcome measures were selected for this evaluation before the analysis was undertaken.
Primary outcome measures:
-
The percentage of the group classed as employed 2 years after starting on the programme.
-
The percentage of the group who passed an education or training course at any time during the 2 years after starting the programme.
Participant information
Of the 2,264 participants included in this analysis, the available administrative data indicated:
-
61% were male and 39% were female
-
Average age was 22 years
-
86% were white
-
21% had a restricted ability to work (RATW)
-
40% had previously been eligible for Free School Meals (FSM)
-
46% had previously had Special Educational Needs (SEN) provisions
-
5% had ever been in care
-
12% had been classed as a Child in Need
-
9% were lone parents of a dependent child
-
33% had claimed Housing Benefit in the 2 years before starting the programme.
Further information on those who were and were not included as part of the analysis and missing markers in the administrative data can be found in Appendix A and Appendix B.
2. The labour market impacts of the programme over time
This report uses 4 categories of labour market status in this analysis (see section 8 for more details).
The results show that the programme led to:
-
more classed as employed, at 2 years
-
more classed as looking for work, at 2 years
-
fewer classed as inactive, at 2 years
-
fewer classed as “other”, at 2 years
An increase in employment, at 2 years
Between 2 and 7 percentage points more programme participants were classed as employed 2 years after starting the programme, than had they not participated. This result was statistically significant.
More classed as looking for work, at 2 years
Between 2 and 7 percentage points more programme participants were classed as looking for work 2 years after starting the programme, than had they not participated. This result was statistically significant.
Fewer classed as inactive, at 2 years
Between 1 and 5 percentage points fewer participants were classed as being on inactivity benefits, 2 years after start. This result was statistically significant.
Fewer classed as “other”, at 2 years
Between 3 and 6 percentage points fewer participants were classed as “other”, 2 years after start. This result was statistically significant.
The figures and tables in this section show the impact of the programme on the numbers of people in each labour market category over the 2 years after starting the intervention. The participants are compared to a comparison group used to estimate the outcomes had the participants not participated in the programme. The difference between the groups can be interpreted as the impact of the programme.
Figure 1 and Table 1 show the percentages of the participant and comparison groups in each labour market category in the 2 years after participants started the programme. Table 2 provides a breakdown of those employed in each time period (12 and 24 months). The difference shown between the groups, can be interpreted as an estimate of the impact of the programme.
To explore the labour market impacts further, Table 2 shows an additional labour market impact measure – the percentage of each group who were in work at any point during the 1 and 2 years after starting the programme. The results indicate the programme led to a statistically significant increase in people having some experience of work during the 2 years after starting the programme.
The results show that the programme led to a statistically significant and sustained increase in employment for its participants in the 2 years after start.
Further variables can be found in Table 12 in Appendix E, including labour market transition variables which track changes in labour market status from start to 1 and 2 years later.
Figure 1: Plots showing the impact of the programme on the numbers in each labour market category over time.
Figure 1 and Table 1 show the percentages of the participant and comparison groups in each labour market category in the 2 years after participants started the programme. The difference shown between the groups, can be interpreted as an estimate of the impact of the programme.
The plots on the left (in orange) show the percentages of the participant and comparison groups in each category. The difference (or impact of the programme) is shown on the right in blue. The darker blue line shows the central estimate, and the shaded blue area is the 95% confidence interval.
1(a & b) – Employed: The impact plot (b) shows the programme had a positive and statistically significant effect on the percentage of participants who were employed. Plot (a) shows the percentage of the participant and comparison group employed at start is similar but the percentages increase at a faster rate for the participant group over the 2 years after start.
1(c & d) – Looking for work: The impact plot (d) shows the programme resulted in an increase in those on looking-for-work benefits. Plot (c) shows a decrease in the percentage of both groups in the ‘looking for work’ category with the percentage of the comparison group ‘looking for work, decreasing at a faster rate.
1(e & f) – Inactive: The impact plot (f) shows that the programme led to a statistically significant reduction in the percentage of participants in receipt of ‘inactive’ benefits, that was sustained over the 2-year follow-up period. Plot (e) shows the percentage of both groups on ‘inactive’ benefits.
1(g & h) – Other: The impact plot (h) shows that the programme led to a statistically significant and sustained reduction in the percentage of participants in the ‘other’ category. Plot (g) shows the percentage of the participant group classed as ‘other’ dropped sharply prior to programme start, before remaining constant, at lower percentage to comparison.
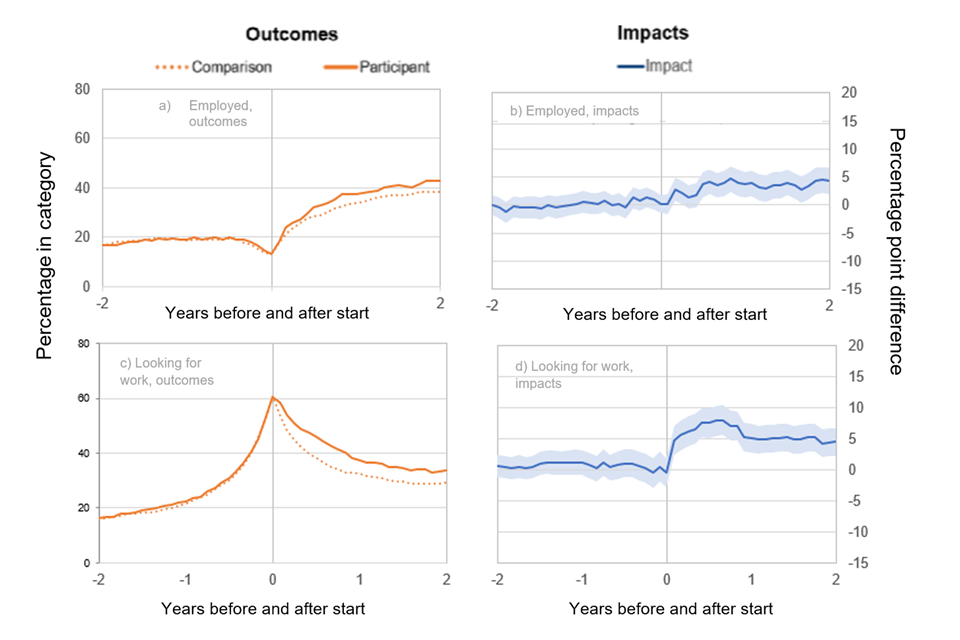
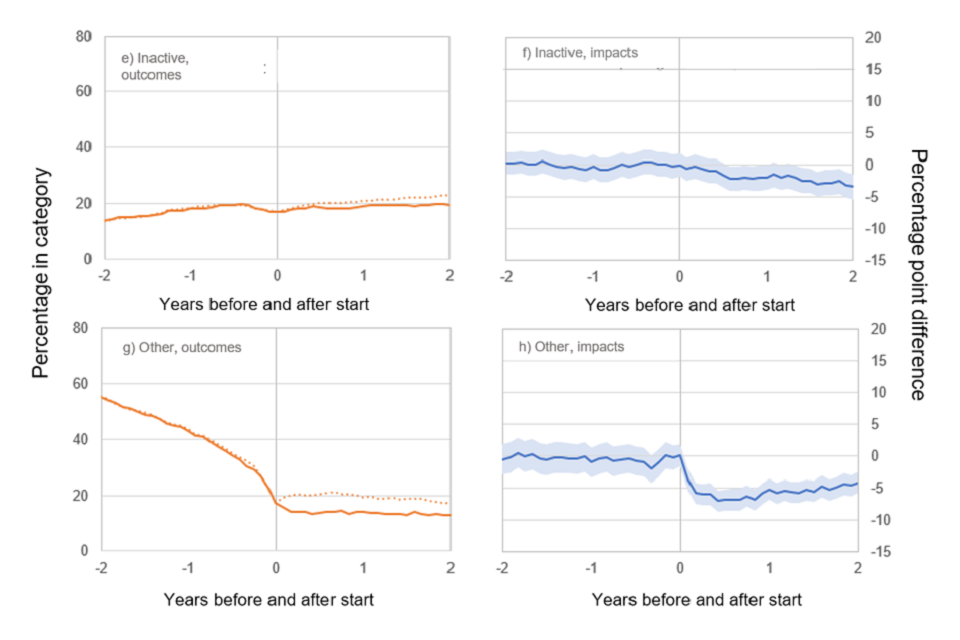
Table 1: Showing the percentage of each group in each category at 1 and 2 years after starting the programme. The impact, or difference, is shown along with an indication of statistical significance:
The impacts (difference between the 2 groups) are shown along with an indication of statistical significance. The “upper” and “lower” values give the confidence interval around the central estimate of the impact. Percentage points are denoted by ppt.
| Percentage of group in category | Participant group (%) | Comparison group (%) | Impact: Central (ppt) | Impact: Lower (ppt) | Impact: Upper (ppt) | Significance |
|---|---|---|---|---|---|---|
| Employed (1 year) | 38 | 34 | 4 | 1 | 6 | yes |
| Looking for work (1 year) | 37 | 32 | 5 | 3 | 7 | yes |
| Inactive (1 year) | 19 | 21 | -2 | -4 | 0 | yes |
| Other (1 year) | 14 | 19 | -5 | -7 | -4 | yes |
| Employed (2 years) | 43 | 39 | 4 | 2 | 7 | yes |
| Looking for Work (2 years) | 34 | 29 | 4 | 2 | 7 | yes |
| Inactive (2 years) | 19 | 23 | -3 | -5 | -1 | yes |
| Other (2 years) | 13 | 17 | -4 | -6 | -3 | yes |
Table 2: Showing the percentage of the participant and comparison groups in the Employed category at any point during the 12 and 24 months after start.
| Percentage of group employed at any point | Participant group (%) | Comparison group (%) | Impact: Central (ppt) | Impact: Lower (ppt) | Impact: Upper (ppt) | Significance |
|---|---|---|---|---|---|---|
| Employed (at any point in the 12 months after start) | 55 | 49 | 7 | 4 | 9 | yes |
| Employed (at any point in the 24 months after start) | 66 | 60 | 6 | 4 | 9 | yes |
3. Impact on education and training
Note: Specific data limitations mean that the figures in this section should be treated with a greater degree of caution. See section 8 for more details.
Increase in the percentage passing an education or training course
The percentage of participants who passed an education course 2 years after start, was between 1 and 5 percentage points higher than had they not participated. This result was statistically significant.
The figures and tables in this section show the impact of the programme on people entering, and passing, an education or training course during the 1 or 2 years after start.
Table 3 shows the impact on the percentage of participants who passed an education or training at any time during the 1 and 2 years after starting the programme. The results suggest the programme resulted in a large statistically significant increase in the year after starting and that this continued into year 2.
Figure 2 provides a breakdown of the level of qualifications obtained by participants and the comparison group at any point during the 2 years after start. The results suggest the programme led to a large, statistically significant increase in the number people passing level 1 and level 2 courses, as well as more modest increases in those passing entry level courses. The results also suggest that the programmes led to a statistically significant reduction in the number of people obtaining a level 3 or higher qualification.
Specific data limitations mean that these figures should be treated with a greater degree of caution. See section 8 for more details.
Table 3: Showing the percentage of the participant and comparison groups classed as passing a course during the year after programme start and during the 2 years after programme start.
The impacts (difference between the 2 groups) are shown along with an indication of statistical significance.
Note: these figures include qualifications obtained for education spells that were active prior to individuals starting the programme.
| Percentage of group who passed a qualification at any point: | Participant group | Comparison group | Impact: Central (ppt) | Impact: Lower (ppt) | Impact: Upper (ppt) | Sig. |
|---|---|---|---|---|---|---|
| 1 year after start | 28 | 22 | 6 | 3 | 8 | yes |
| 2 years after start | 22 | 19 | 3 | 1 | 5 | yes |
Figure 2: Showing the percentage of the participant and comparison groups who passed at least one entry level, level 1, level 2, and level 3 or higher course at any point during the 2 years after programme start.
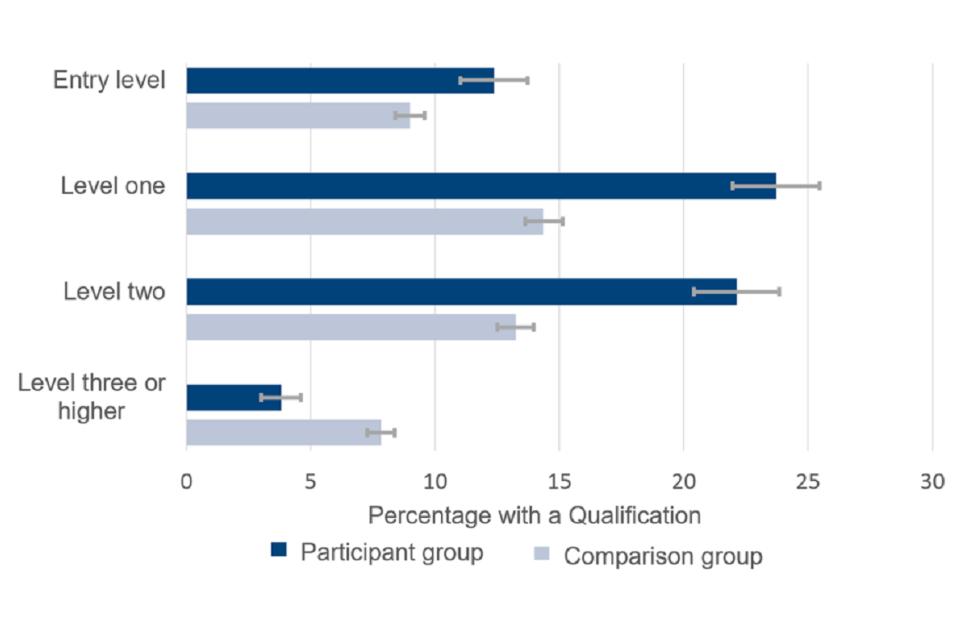
Note: Level 3 and higher passed course outcomes were combined for statistical disclosure control reasons.
Note: These levels are not mutually exclusive, so where an individual passed different courses at different levels, multiple levels would all be recorded.
Note: These figures include qualifications obtained for education spells that were active prior to individuals starting the programme.
Note: Specific data limitations mean that these figures should be treated with a greater degree of caution. See section 8 for more details.
4. Exploring impact of COVID-19 Pandemic
The programme spans the period of the COVID-19 pandemic. The pandemic and the associated lockdowns which took place between March 2020 and the summer of 2021 had significant impacts on the labour market in England, with large swings in employment, unemployment, and inactivity rates. See Coronavirus: Impact on the labour market (House of Commons Library briefing) for further details.
To explore the impacts of the pandemic on the participants and their outcomes, a sub-analysis was carried out that split the participants into 2 cohorts; one whose follow-up period was not impacted by the pandemic, and the other where it was:
-
Pre-COVID – Participants who started the programme before 1 April 2018. For this group the 2-year outcomes would be unaffected by the COVID-19 pandemic.
-
COVID impacted – Participants who started the programme between 1 April 2018 and 1 April 2020. For this group the 2-year outcomes were impacted by the COVID-19 pandemic.
The analysis was repeated for each cohort and the results of each run can be found in tables 13 and 14 in Appendix E. Participant details for each cohort can be found in Table 8 in Appendix B.
The results of the 2 respective runs are illustrated in Table 4 below. This table shows the percentages in each labour market category 2 years after starting the programme.
The results show that the COVID pandemic appeared not to have an adverse effect on the employment impacts of the programme on participants. The results show the programme led to a positive statistically significant increase in employment for both the pre-COVID and COVID impacted groups. However, the increase in employment was approximately twice as large in the COVID impacted group. Although only 380 participants started the programme during the COVID impacted period, compared to 1,871 during the pre-COVID period, so there is a larger variation in the estimated impact of the programme on COVID impacted participants. The differences in employment impacts between the pre-COVID and COVID impacted subgroups was not statistically significant.
Table 4: Showing the percentage of each group in each category at 2 years after starting the programme for the Pre-COVID and COVID impacted groups.
| Category | Participant group | Comparison group | Impact: Central (ppt) | Impact: Lower (ppt) | Impact: Upper (ppt) | Significance |
|---|---|---|---|---|---|---|
| Employed (Pre-COVID) | 42 | 38 | 4 | 1 | 7 | yes |
| Employed (COVID impacted) | 48 | 40 | 9 | 2 | 15 | yes |
| Looking for Work (Pre-COVID) | 32 | 28 | 4 | 2 | 7 | yes |
| Looking for Work (COVID impacted) | 38 | 34 | 3 | -3 | 10 | no |
| Inactive (Pre-COVID) | 20 | 23 | -3 | -5 | -1 | yes |
| Inactive (COVID impacted) | 18 | 22 | -5 | -10 | 1 | no |
| Other (Pre-COVID) | 14 | 18 | -4 | -6 | -3 | yes |
| Other (COVID impacted) | 9 | 17 | -8 | -12 | -4 | yes |
The impact, or difference, is shown along with an indication of statistical significance. The “upper” and “lower” give the confidence interval around the central estimate of the impact.
Note: Categories are not mutually exclusive, so percentages in category do not sum to 100% and impacts do not sum to 0.
5. Impact of programme on those with SEN provision
Table 5 illustrates the estimated impacts of the programme on labour market status for the subgroup of participants who had a SEN provision at any time between the ages of 14 and 18. This group consisted of 1,045 programme participants. The results show that the programme had no statistically significant impact on the percentage of these participants classed as Employed, with an estimated impact between 1 point higher and 4 percentage points lower than had they not participated.
Table 5 also shows a statistically significant decrease in the percentage of participants classed as Other as well as a statistically significant increase in the percentage of participants in receipt of looking-for-work benefits.
Table 6 illustrates the labour market impacts for non-SEN participants, which constituted 1,209 of the participant group. The results from this table show that there was a statistically significant increase in employment for programme participants without a SEN provision (between 3 and 8 percentage points).
A full list of results can be found in table 15 in Appendix E. Participant details for SEN and non-SEN groups can be found in Table 9 in Appendix B.
Table 5: Showing the percentage of those with a SEN provision in each category at 2 years after starting the programme.
| Category | Participant group | Comparison group | Impact: Central (ppt) | Impact: Lower (ppt) | Impact: Upper (ppt) | Significance |
|---|---|---|---|---|---|---|
| Employed | 30 | 31 | -1 | -4 | 1 | no |
| Looking for Work | 48 | 40 | 8 | 5 | 11 | yes |
| Inactive | 23 | 25 | -1 | -4 | 2 | no |
| Other | 13 | 17 | -4 | -6 | -3 | yes |
Table 6: Showing the percentage of those who did NOT have a SEN provision in each category at 2 years after starting the programme.
| Category | Participant group | Comparison group | Impact: Central (ppt) | Impact: Lower (ppt) | Impact: Upper (ppt) | Significance |
|---|---|---|---|---|---|---|
| Employed | 44 | 38 | 6 | 3 | 8 | yes |
| Looking for Work | 39 | 35 | 4 | 2 | 7 | yes |
| Inactive | 17 | 19 | -2 | -4 | 0 | no |
| Other | 14 | 21 | -6 | -8 | -5 | yes |
6. How to use the results of this report?
Two primary outcome measures were chosen to assess the success of this programme. The results suggest that the programme had positive, and statistically significant impacts on both primary outcome measures. Notably, the programme was successful at:
-
increasing the number of participants entering employment, 2 years after enrolling onto the Springboard programme
-
increasing the number of participants passing an education course in the 2 years after starting the programme
The estimates in this report were generated using quasi-experimental methods that can be less reliable than experimental methods such as a randomised control trial. The results should be used with a degree of caution.
The estimates were also generated using a subset of Springboard Hull and Humber programme participants, most notably those who were over 18 years old on starting. Care should be taken in generalising the results to those under 18.
The estimates relate to a programme working in a particular context. This report makes no assessment as to whether these impacts are generalisable to different contexts. The estimates were also made in a “business as usual” setting where participants and comparators were free to go on to access other support.
7. HLC in their own words
Our organisation
Founded in 2002, Humber Learning Consortium (HLC) is a VCSE learning and skills quality and funding partnership organisation, which manages UK Shared Prosperity and UK government mainstream adult skills funded provision. We are highly experienced deliverers of European Social Fund (ESF) and National Lottery Community Fund programmes.
We provide a single access point for national and local funding bodies to engage with voluntary and community organisations and the people and communities they represent. This enables access to contracts that might ordinarily be out of reach for some organisation and so helps strengthen local learning and skills delivery capacity. HLC are committed to supporting disadvantaged learners and communities and the development of our valued delivery partners.
Springboard – project overview
The Springboard programme was a partnership project led by Humber Learning Consortium, supporting economically inactive and long term unemployed 16 to 29 year olds into work (or self-employment) and further learning in the City of Hull and surrounding areas of East Riding of Yorkshire, North Lincolnshire and North East Lincolnshire. It commenced in April 2016 and ended in December 2023, comprising 19 separate delivery partners and total funds of £21.2 million, making it one of the largest youth employment and skills support programmes the area has seen. It was part financed through the European Union via the European Social Fund (ESF) and the original Youth Employment Initiative funds. Match funding was provided by Hull City Council and the National Lottery Community Fund (previously Big Lottery), the latter helped provide a specialist disability pathway programme to work for those with long term health conditions. More than 5,700 young people were supported via the programme, receiving support from local authority key workers providing one-to-one mentoring support and specialist mental health well-being counselling, alongside personal and social development skills development and employability and employment support training provision.
Our response to the analysis
HLC were pleased to see the inclusion of the Springboard programme in this DWP Employment Data Lab analysis. We welcome the report’s headline findings that the programme positively contributed to longer term sustainable employment and education and training outcomes. We also noted the positive influence for those with special educational needs provision looking for work and accessing education and training and also its role in ensuring vital support remained available during the COVID-19 pandemic.
This corroborates our own programme data analysis, which highlighted the effectiveness of the model in both reaching priority groups and participants and ensuring positive destination outcomes for these. More than 41% of people supported were helped into positive work, self-employment or further learning/training destinations directly upon leaving programme, with high numbers of inactive, NEET, long term unemployed, those with disabilities and lone parents successfully engaged and supported.
It is particularly encouraging to see the Springboard programme’s longer-term impact outlined in the analyses, complementing the more immediate results and outcomes that we were already aware of. We would like to thank the DWP Employment Data Lab team for their insightful analysis and findings.
8. About these statistics
This report presents estimates of the impact of a programme. This is achieved by comparing the outcomes of the programme participants to a credible estimate of their outcomes had they not participated in the programme. This is often referred to as the counterfactual. In this report the counterfactual was generated using a quasi-experimental technique called propensity score matching (PSM). This involves constructing a comparison group of individuals, who did not participate in the programme but who are matched on key characteristics that affect whether an individual takes part in the programme and the outcomes that they experience as a result of participation.
Once this comparison group has been constructed the outcomes of the 2 groups can be compared to generate the estimate of the impact of the programme. More information about this technique and how it is used in the Data Lab can be found in the methodology report.
Categorisation
The analysis in this report is based on the labour market outcomes of the participants (and a matched comparison group) in the 2 years before and after starting the intervention. This report uses 4 categories of labour market status for the analysis, detailed below.
-
Employed: People who are either employed or self-employed
-
Looking for Work: People who are in receipt of Jobseekers Allowance (JSA), or in the Universal Credit (UC) “intensive work search”, “light touch out of work”, “light touch in work”, or “working enough” conditionality regimes.
-
Inactive: People who are in receipt of inactive benefits such as Employment and Support Allowance (ESA) or in the UC “no work requirements” or “work focussed interview” conditionality regimes. Several other benefits also fall into this category, though the numbers of people on these benefits is small. See methodology report for details.
-
Other: People who do not fall into the above 3 categories, this could include people who are in full-time education and not working or receiving benefits or those who are in custody.
These categories are not mutually exclusive, and it is possible to be in more than one category. For example, someone working fewer than 16 hours a week may also be in receipt of JSA and would be classed as “employed” and “looking for work”.
Statistical significance
The report highlights if the results are statistically significant or not. A statistically significant result is one that is unlikely to have occurred by chance because of sampling error. If a result is not statistically significant it does not mean that the intervention has no impact, it simply means that there is not enough evidence to verify this to a required threshold. In this report, unless otherwise stated, the threshold for significance is 95%.
This report sometimes presents the central estimate of a result along with the upper and lower confidence values. These upper and lower values create a range that you would expect the estimate to fall within if the test was to be redone, within a certain level of confidence. This level is set at 95% unless otherwise stated. The confidence intervals will typically be stated in the tables of results and be presented on graphs and plots as either error bars or shaded regions.
Limitations
The validity of the technique used in this report rests on the assumption that all the characteristics that are linked to a person’s participation in the programme and the outcome variables of interest have been sufficiently accounted for in the analysis, either explicitly or otherwise. This is a strong assumption that cannot be tested and depends on the data available and on the nature of each programme and its participants. This is reviewed on a case-by-case basis in the Data Lab and impact evaluations are only carried out where the validity of this assumption is plausible. That said, these are quasi-experimental techniques that tend to be less robust than true experimental methods, such as a randomised control trial, and the results must be treated with a degree of caution.
Throughout this report it is highlighted that particular caution should be applied when using and interpreting the education related results. The reason for this stems from the fact that the education spells data relates to enrolment on a course, and actual attendance and/or drop-outs are not always captured and accounted for. This has the potential for someone to appear as though they are in education when in practice they are not (for example if they enrolled on a course and subsequently dropped out). Since these programmes are aimed at people who are NEET, i.e. Not in Employment, Education or Training, it is possible that this issue would be more likely to affect the participant group than the comparison group, therefore introducing some bias into the results. Whilst there are indications in the data that this sort of bias may be present to a degree, sensitivity analyses have been conducted providing reassurance that the benefit and employment related impact estimates are robust. The education related impacts are more exposed to this potential issue and therefore should be treated with more caution.
Where to find out more
Read the Employment Data Lab analysis, information and guidance.
9. Statement of compliance with the Code of Practice for Statistics
The Code of Practice for Statistics (the Code) is built around 3 main concepts, or pillars:
-
Trustworthiness – is about having confidence in the people and organisations that publish statistics
-
Quality – is about using data and methods that produce statistics
-
Value – is about publishing statistics that support society’s needs
The following explains how we have applied the pillars of the Code in a proportionate way.
Trustworthiness
Employment Data Lab reports, such as this, are published to provide User Organisations with an estimate of the impact of their programmes that support employment. Releasing them via an ad hoc publication will give equal access to all those with an interest in them.
Quality
The methodology used to produce the information in this report has been developed by DWP analysts in conjunction with the Institute for Employment Studies. The information is based on data from the User Organisation and Government administrative data. The calculations have been quality assured by DWP analysts to ensure they are robust.
Value
Producing and releasing these estimates provides User Organisations and the public with useful information about employment support provision that they may not have otherwise been able to generate or obtain.
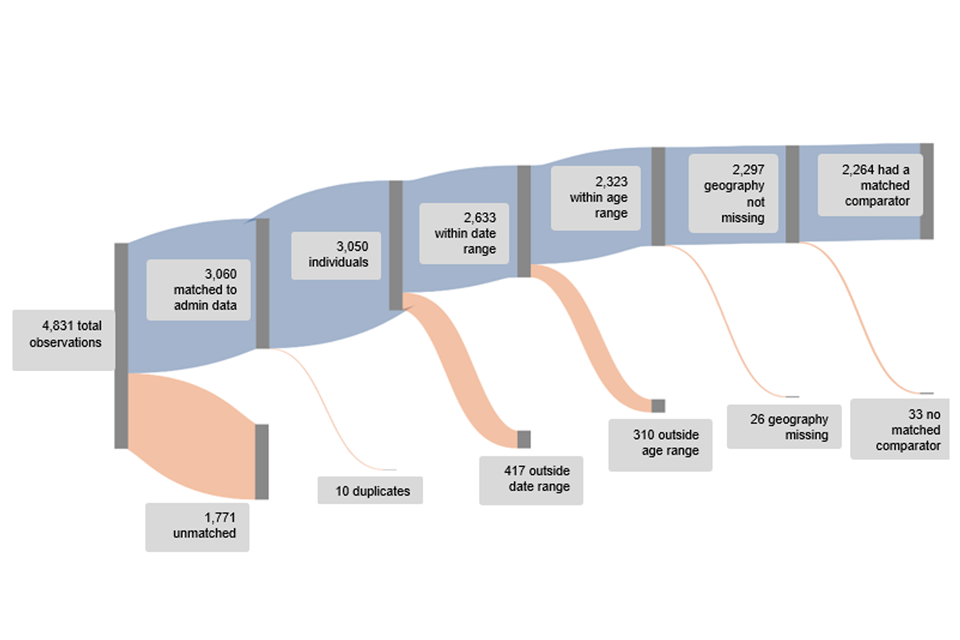
Appendix A: Exclusions from the treatment group
HLC shared data on 3,050 participants who took part in the programme between April 2016 and December 2022. The main impact analysis focussed on a subset of these participants who were between 18 and 29 when they started the programme and started the programme on or before 1 April 2020. This was to ensure that participants were unlikely to be in compulsory full-time education 1 year and 2 years after starting the programme and had at least 2 full years of labour market outcomes in the data available.
The distribution of programme start dates and exclusions, in Figure 3, shows that for the participants who started on or before 1st April 2020, exclusions from the evaluation were fairly evenly distributed throughout the period.
Figure 4 shows the final group of 2,264 participants, comprising the main analysis group used in the PSM, represented approximately 86% of the matched participants who took part during the relevant period.
Figure 3 shows the distribution of start dates of the programme participants.
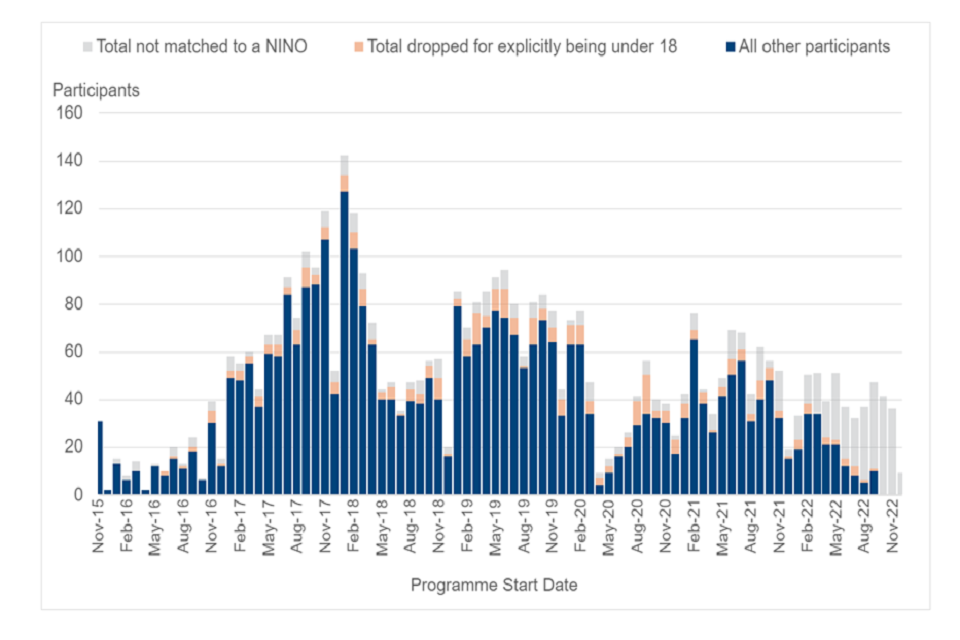
The grey bars show the participants who were excluded from the analysis because they could not be linked to the administrative data, the orange bars show the linked participants who were excluded because they were under 18, and the blue bars show all other participants.
Figure 4 presents a diagram showing the numbers of participants and the stages at which they were excluded from the analysis.
Appendix B: Participant group information
Table 7: Showing characteristics, benefits and employment information for the participant group (%)
This is broken down into the “evaluated”; those who were selected for the evaluation, the “non-evaluated”; those who were excluded from the evaluation, and “all” of the participants, for whom data was available. This table only includes participants who could be linked to the administrative data.
| Variable | Evaluated | Non-Evaluated | All |
|---|---|---|---|
| Observations | 2264 | 786 | 3050 |
| Age (mean years) | 21.6 | 19.1 | 20.9 |
| <18 years (%) | 0 | 55 | 14 |
| 18-24 years (%) | 83 | 34 | 70 |
| 25-30 years (%) | 17 | 11 | 15 |
| >30 years (%) | 0 | 0 | 0 |
| Male (%) | 61 | 58 | 60 |
| RATW at start marker set (%) | 21 | 10 | 18 |
| Partner marker set (%) | 6 | x | 5 |
| Partner marker missing (%) | 40 | 80 | 50 |
| Dependent children marker (%) | 16 | 9 | 14 |
| Dependent children marker missing (%) | 14 | 72 | 29 |
| Lone parent marker set (%) | 9 | 5 | 8 |
| Lone parent marker missing (%) | 19 | 79 | 34 |
| SEN marker set (%) | 46 | 37 | 44 |
| SEN marker missing (%) | 2 | 7 | 4 |
| FSM marker set (%) | 40 | 45 | 41 |
| FSM marker missing (%) | 2 | 7 | 4 |
| Care leaver/adopted marker (%) | 5 | 7 | 6 |
| Care leaver/adopted missing (%) | 0 | 0 | 0 |
| Child in need marker (%) | 12 | 19 | 14 |
| Child in need missing (%) | 6 | 7 | 6 |
| Exclusion marker (%) | 14 | 17 | 14 |
| Exclusion marker missing (%) | 8 | 11 | 9 |
| Permanent exclusion marker (%) | x | x | 1 |
| Permanent exclusion missing (%) | 8 | 11 | 9 |
| Housing benefit marker (%) | 33 | 12 | 27 |
| DLA/PIP marker set (%) | 10 | 9 | 10 |
| DLA/PIP at start marker set (%) | 9 | 7 | 8 |
| White ethnicity (%) | 86 | 87 | 87 |
| Other ethnicity (%)Other ethnicity (%) | 13 | 13 | 14 |
| Entry level qualification (%) | 95 | 86 | 93 |
| Level 1 qualification (%) | 93 | 85 | 91 |
| Level 2 qualification (%) | 81 | 70 | 78 |
| Level 3 qualification (%) | 31 | 18 | 28 |
| Level 4 qualification (%) | 6 | 5 | 6 |
| Level 5 qualification (%) | x | x | x |
| Level 6 qualification (%) | x | x | x |
| Level 7 qualification (%) | x | x | x |
| Level 8 qualification (%) | x | x | x |
| NEET at start (%)* | 65 | 60 | 63 |
| Enrolled in education start (%) | 26 | 35 | 28 |
| Employed at start (%)* | 13 | 9 | 12 |
| Looking for Work at start (%) | 61 | 32 | 53 |
| Inactive at start (%) | 17 | 9 | 15 |
| Other at start (%) | 17 | 55 | 27 |
| Number of weeks Employed in the previous 2 years | 20 | 11 | 17 |
| Number of weeks Looking for Work in the previous 2 years | 28 | 15 | 25 |
| Number of weeks Inactive in the previous 2 years | 18 | 8 | 15 |
| Number of weeks Other in the previous 2 years | 42 | 73 | 50 |
Note: Some figures which have been suppressed for disclosure control purposes are denoted by an x.
*NEET percentage is based on presence in certain administrative datasets and is not necessarily reflective of the results of Springboard referral assessments conducted by HLC. For example, education flags may show individuals are present in administrative data but may not reflect actual school attendance.
*Employment flags are generated for individuals present in administrative datasets but may not reflect current employment status for some individuals such as those on zero hour contracts with no earnings.
Table 8: Showing characteristics, benefits and employment information for the subsets of the evaluated participant group who started before and after 1 April 2018
| Variable | Pre-Covid | Covid |
|---|---|---|
| Observations* | 1871 | 380 |
| Age (mean years) | 21.6 | 21.4 |
| <18 years (%) | 0 | 0 |
| 18-24 years (%) | 83 | 83 |
| 25-30 years (%) | 17 | 17 |
| >30 years (%) | 0 | 0 |
| Male (%) | 62 | 58 |
| RATW at start marker set (%) | 21 | 18 |
| Partner marker set (%) | 7 | x |
| Partner marker missing (%) | 36 | 57 |
| Dependent children marker (%) | 16 | 15 |
| Dependent children marker missing (%) | 10 | 36 |
| Lone parent marker set (%) | 9 | 8 |
| Lone parent marker missing (%) | 14 | 41 |
| SEN marker set (%) | 48 | 40 |
| SEN marker missing (%) | 2 | 3 |
| FSM marker set (%) | 40 | 40 |
| FSM marker missing (%) | 2 | 3 |
| Care leaver/adopted marker (%) | 5 | 8 |
| Care leaver/adopted missing (%) | 0 | 0 |
| Child in need marker (%) | 12 | 12 |
| Child in need missing (%) | 6 | 5 |
| Exclusion marker (%) | 14 | 12 |
| Exclusion marker missing (%) | 8 | 7 |
| Permanent exclusion marker (%) | x | x |
| Permanent exclusion missing (%) | 8 | 7 |
| Housing benefit marker (%) | 34 | 26 |
| DLA/PIP marker set (%) | 11 | 9 |
| DLA/PIP at start marker set (%) | 9 | 7 |
| White ethnicity (%) | 86 | 89 |
| Other ethnicity (%)Other ethnicity (%)Other ethnicity (%) | 14 | 11 |
| Entry level qualification (%) | 95 | 94 |
| Level 1 qualification (%) | 94 | 92 |
| Level 2 qualification (%) | 81 | 82 |
| Level 3 qualification (%) | 30 | 39 |
| Level 4 qualification (%) | 5 | 12 |
| Level 5 qualification (%) | x | x |
| Level 6 qualification (%) | x | x |
| Level 7 qualification (%) | x | x |
| Level 8 qualification (%) | x | x |
| NEET at start (%)* | 66 | 57 |
| Enrolled in education start (%) | 24 | 32 |
| Employed at start (%)* | 13 | 16 |
| Looking for Work at start (%) | 62 | 54 |
| Inactive at start (%) | 18 | 16 |
| Other at start (%) | 15 | 23 |
| Number of weeks Employed in the previous 2 years | 19 | 26 |
| Number of weeks Looking for Work in the previous 2 years | 30 | 21 |
| Number of weeks Inactive in the previous 2 years | 19 | 15 |
| Number of weeks Other in the previous 2 years | 41 | 46 |
Note: Some figures which have been suppressed for disclosure control purposes are denoted by an x.
*Descriptive stats are presented for participants who were used in the relevant analysis. As additional participants in this sub analysis had no matched comparators these values do not sum to 2,264.
*NEET percentage is based on presence in certain administrative datasets and is not necessarily reflective of the results of Springboard referral assessments conducted by HLC. For example, education flags may show individuals are present in administrative data but may not reflect actual school attendance.
*Employment flags are generated for individuals present in administrative datasets but may not reflect current employment status for some individuals such as those on zero hour contracts with no earnings.
Table 9: Showing characteristics, benefits and employment information for the subsets of the evaluated participant group who had an SEN provision at any point between the ages of 14 and 18.
| Variable | SEN | Non-SEN |
|---|---|---|
| Observations* | 1045 | 1209 |
| Age (mean years) | 21.2 | 21.9 |
| <18 years (%) | 0 | 0 |
| 18-24 years (%) | 90 | 77 |
| 25-30 years (%) | 10 | 23 |
| >30 years (%) | 0 | 0 |
| Male (%) | 65 | 58 |
| RATW at start marker set (%) | 29 | 14 |
| Partner marker set (%) | 7 | 6 |
| Partner marker missing (%) | 33 | 46 |
| Dependent children marker set (%) | 13 | 19 |
| Dependent children marker missing (%) | 10 | 18 |
| Lone parent marker set (%) | 6 | 11 |
| Lone parent marker missing (%) | 15 | 22 |
| SEN marker set (%) | 100 | 0 |
| SEN marker missing (%) | 0 | 4 |
| FSM marker set (%) | 48 | 33 |
| FSM marker missing (%) | 0 | 4 |
| Care leaver/adopted marker (%) | 8 | 3 |
| Care leaver/adopted missing (%) | 0 | 0 |
| Child in need marker (%) | 16 | 8 |
| Child in need missing (%) | 0 | 10 |
| Exclusion marker (%) | 19 | 9 |
| Exclusion marker missing (%) | 0 | 14 |
| Permanent exclusion marker (%) | x | x |
| Permanent exclusion missing (%) | 0 | 14 |
| Housing benefit marker (%) | 31 | 34 |
| DLA/PIP marker set (%) | 18 | 4 |
| DLA/PIP at start marker set (%) | 16 | 3 |
| White ethnicity (%) | 97 | 77 |
| Other ethnicity (%) | 3 | 23 |
| Entry level qualification (%) | 98 | 93 |
| Level 1 qualification (%) | 96 | 91 |
| Level 2 qualification (%) | 80 | 82 |
| Level 3 qualification (%) | 21 | 40 |
| Level 4 qualification (%) | 3 | 8 |
| Level 5 qualification (%) | x | x |
| Level 6 qualification (%) | x | x |
| Level 7 qualification (%) | x | x |
| Level 8 qualification (%) | x | x |
| NEET at start (%)* | 65 | 64 |
| Enrolled in education start (%) | 27 | 25 |
| Employed at start (%)* | 12 | 15 |
| Looking for Work at start (%) | 62 | 59 |
| Inactive at start (%) | 19 | 16 |
| Other at start (%) | 15 | 19 |
| Number of weeks Employed in the previous 2 years | 17 | 22 |
| Number of weeks Looking for Work in the previous 2 years | 31 | 26 |
| Number of weeks Inactive in the previous 2 years | 20 | 17 |
| Number of weeks Other in the previous 2 years | 40 | 43 |
Note: Some figures which have been suppressed for disclosure control purposes are denoted by an x.
*Descriptive stats are presented for participants who were used in the relevant analysis. As additional participants in this sub analysis had no matched comparators these values do not sum to 2,264.
*NEET percentage is based on presence in certain administrative datasets and is not necessarily reflective of the results of Springboard referral assessments conducted by HLC. For example, education flags may show individuals are present in administrative data but may not reflect actual school attendance.
*Employment flags are generated for individuals present in administrative datasets but may not reflect current employment status for some individuals such as those on zero hour contracts with no earnings.
Appendix C: Matching the comparison group
The analysis in the report uses a technique called propensity score matching to construct a comparison group of individuals that are matched on key characteristics that are linked to a person’s participation in the Programme and the outcome variables of interest. More information about this technique and how it is used in the Data Lab can be found in the methodology report.
Before proceeding with the analysis, the Data Lab team assessed the plausibility of constructing a comparison group that satisfies the conditional independence assumption that underlies PSM (see methodology report for more details). The programme was targeted at individuals with characteristics that were largely well represented in the available data.
The comparison pool was selected from the Department for Education’s (DfE) administration data and was restricted to only include individuals who were in the same age range as the participants at the time of the programme start. This group was then randomly assigned a pseudo-start date (in lieu of an actual start date) in a way that matched the distribution of participant start dates. This group was then reduced further in a number of steps:
-
Firstly, individuals who were known to have participated in other ESF programmes were excluded.
-
The group was then restricted to geographic locations that were similar to, but excluded, the locations that the programme was delivered in. The selection of these locations was based on cluster analysis that used local labour market characteristics and indicators to group Local Authorities in Great Britain into 14 groups. See Appendix D for more info.
-
The comparison pool was restricted further by stratified sampling that matched the distributions of the comparison and participant groups on their labour market status at programme start/pseudo-start.
These steps resulted in a comparison pool of approximately 53,000 individuals who were then used in the matching process.
The matching estimator used to generate the impact estimates presented in this report was nearest neighbour matching using 100 nearest neighbours and a bandwidth of 0.01. Nearest neighbour matching involves running through each participant and matching them with the closest eligible individuals from the comparison pool, determined by closeness of the propensity scores. The sensitivity of the impact estimates to the choice of matching estimator was tested using a range of estimators and found to be insensitive. Further information about matching estimators can be found in the methodology and literature review documents.
Table 10 below shows a sample of the variables used in the matching process and the mean values of these variables both before and after matching. The table shows that before matching, the participant and comparison groups are not well matched, or balanced, as shown by sizeable differences in the mean values. After matching, the mean values of the participant and comparison groups are much closer. The percent bias and p-value columns provide information on how big the residual difference is and if this difference is statistically significant. Ideally one would like the percent biases to be small (below 5%) and there to be no statistically significant differences i.e., p-values above 0.05 (the 95% confidence level threshold).
Table 11 also presents summary statistics that relate to how well matched the participant and comparison groups are for the main run. It shows values for Rubin’s B, Rubin’s R and the maximum and median percent biases, all of which meet commonly accepted thresholds for the selected approach (see the methodology report for more details). The table also shows there were only 33 participants (1.14%) who were off support (had no matched comparator). This is a sufficiently small percentage so as not to raise concerns about the representativeness of the results.
Table 10 showing mean value of each control variable for the main run, before and after matching
| Variable | Unmatched Comparison Group | Unmatched participant group | Matched comparison group | Matched participant group | Percent bias | P value |
|---|---|---|---|---|---|---|
| a_week_m1 | 8.8 | 16.1 | 18 | 16 | -6.1 | 0.07 |
| a_start | 8.8 | 15.9 | 17.7 | 15.8 | -5.6 | 0.1 |
| a_month_m_18 | 16.2 | 33.8 | 36.1 | 33.7 | -5.5 | 0.1 |
| a_month_m_21 | 18 | 36.2 | 38.6 | 36.4 | -5.2 | 0.11 |
| a_month_m_12 | 13.8 | 30.6 | 32.7 | 30.6 | -5.2 | 0.13 |
| a_month_m_9 | 12.4 | 27.8 | 29.7 | 27.7 | -5 | 0.15 |
| a_month_m_15 | 15.2 | 33.3 | 35.2 | 33.2 | -4.7 | 0.16 |
| a_month_m_6 | 10.5 | 23.5 | 24.8 | 23.4 | -3.8 | 0.26 |
| a_month_m_3 | 9.3 | 19.9 | 20.9 | 19.8 | -3.3 | 0.34 |
| o_month_m_3 | 20 | 29.6 | 30.2 | 29 | -2.8 | 0.37 |
| l_month_m_12 | 23.4 | 22.2 | 21.4 | 22.5 | 2.8 | 0.35 |
| c_month_m_24 | 9.9 | 16.4 | 17.3 | 16.4 | -2.7 | 0.41 |
| l_month_m_15 | 20.2 | 20.5 | 19.7 | 20.7 | 2.5 | 0.39 |
| l_month_m_18 | 17.9 | 18.9 | 18.2 | 19.1 | 2.5 | 0.41 |
| missing_level_1_start | 0.2 | 1.5 | 1.1 | 0.9 | -2.5 | 0.45 |
| f_age | 23.4 | 21.6 | 21.5 | 21.6 | 2.4 | 0.38 |
| a_month_m_24 | 18.4 | 34.9 | 36.2 | 35.1 | -2.4 | 0.46 |
| o_month_m_9 | 27.4 | 39.3 | 39.9 | 38.8 | -2.4 | 0.43 |
| cluster7 | 39.7 | 5.7 | 6.7 | 5.8 | -2.3 | 0.22 |
| l_month_m_9 | 27.4 | 25.8 | 25 | 26 | 2.3 | 0.43 |
| f_age_sq | 559.5 | 475.7 | 471 | 474.5 | 2.3 | 0.39 |
| o_month_m_12 | 29.7 | 43.3 | 43.8 | 42.8 | -2.1 | 0.49 |
| w_month_m_3 | 20.7 | 18 | 17.3 | 18.2 | 2.1 | 0.47 |
| l_month_m_6 | 33.1 | 30.8 | 30 | 31 | 2.1 | 0.48 |
| c_week_m1 | 5.1 | 11.6 | 12.3 | 11.7 | -2.1 | 0.56 |
| dlapip_start | 10.9 | 8.8 | 9.5 | 8.9 | -2.1 | 0.48 |
| c_month_m_12 | 8.8 | 17.3 | 18.1 | 17.4 | -2 | 0.56 |
| missing_sen_pit | 1.6 | 3.5 | 2.2 | 2.5 | 2 | 0.49 |
| missing_fsm_pit | 1.6 | 3.5 | 2.2 | 2.5 | 2 | 0.49 |
| o_month_m_6 | 24.4 | 34.7 | 35 | 34.1 | -1.9 | 0.55 |
| snc_hst_flg | 18.8 | 19.5 | 19 | 19.7 | 1.8 | 0.54 |
| c_month_m_18 | 8.9 | 15.1 | 15.8 | 15.2 | -1.8 | 0.58 |
| c_month_m_21 | 9.1 | 14.8 | 15.5 | 14.9 | -1.8 | 0.59 |
| c_month_m_15 | 9 | 16.3 | 17 | 16.4 | -1.7 | 0.62 |
| binary_dlapiphist | 12.5 | 10.2 | 10.7 | 10.3 | -1.4 | 0.62 |
| c_month_m_3 | 6 | 14.3 | 14.8 | 14.4 | -1.4 | 0.68 |
| l_month_m_24 | 15.3 | 16.3 | 15.9 | 16.4 | 1.4 | 0.64 |
| missing_cin_flag | 4.3 | 6.5 | 5.2 | 5.5 | 1.3 | 0.65 |
| c_month_m_9 | 8.3 | 17.5 | 18.1 | 17.6 | -1.3 | 0.7 |
| level_6_start | 6.3 | 5 | 4.7 | 5 | 1.3 | 0.64 |
| wp_start | x | x | x | x | 1.3 | 0.71 |
| l_month_m_21 | 16.2 | 17.7 | 17.3 | 17.8 | 1.3 | 0.68 |
| level_2_start | 76.6 | 80.5 | 81.6 | 81.1 | -1.2 | 0.66 |
| o_month_m_18 | 33.6 | 49.4 | 49.5 | 48.9 | -1.2 | 0.7 |
| cluster13 | 37.5 | 81.7 | 80.9 | 81.4 | 1.2 | 0.65 |
| o_month_m_24 | 37.7 | 55.3 | 55.5 | 54.9 | -1.2 | 0.7 |
| level_3_start | 31.3 | 30.9 | 31.7 | 31.1 | -1.1 | 0.7 |
| binary_uc_ltiwhist | 3.7 | x | x | x | -1.1 | 0.57 |
| cluster14 | 22.7 | 12.5 | 12.3 | 12.7 | 1 | 0.7 |
| w_month_m_15 | 28.4 | 19 | 19.6 | 19.2 | -1 | 0.72 |
| w_month_m_18 | 28.5 | 18.7 | 19.3 | 18.9 | -1 | 0.73 |
| h_start | 4 | x | x | x | -0.9 | 0.58 |
| w_week_m1 | 13.5 | 12.8 | 12.5 | 12.9 | 0.9 | 0.75 |
| h_week_m1 | 4 | x | x | x | -0.9 | 0.59 |
| level_7_start | 1 | x | x | x | -0.9 | 0.69 |
| uasc_flag | x | x | x | x | 0.9 | 0.73 |
| binary_ishist | 15.1 | 14.6 | 15 | 14.7 | -0.9 | 0.75 |
| f_ratw_start | 16.1 | 13.8 | 14.2 | 13.9 | -0.9 | 0.76 |
| l_start | 62.5 | 60.2 | 61 | 60.6 | -0.9 | 0.76 |
| sen_pit | 37.5 | 46.1 | 46.9 | 46.5 | -0.9 | 0.77 |
| l_week_m1 | 60.1 | 59.6 | 60.3 | 59.8 | -0.9 | 0.77 |
| o_month_m_15 | 31.7 | 46.2 | 46.1 | 45.7 | -0.8 | 0.78 |
| i_month_m_12 | 24.1 | 17.9 | 18.4 | 18.1 | -0.8 | 0.77 |
| level_0_start | 94 | 94.6 | 95.1 | 95.3 | 0.8 | 0.77 |
| w_month_m_21 | 28.5 | 17.5 | 18 | 17.7 | -0.8 | 0.77 |
| level_5_start | 7.4 | 5.6 | 5.4 | 5.6 | 0.8 | 0.78 |
| h_month_m_12 | 5.2 | 3.2 | 3.4 | 3.3 | -0.8 | 0.78 |
| intervention_month | 6.1 | 6.1 | 6.1 | 6.2 | 0.7 | 0.8 |
| level_m1_start | 4.1 | 2.5 | 2.4 | 2.5 | 0.7 | 0.77 |
| c_month_m_6 | 7.1 | 16.1 | 16.4 | 16.1 | -0.7 | 0.83 |
| i_month_m_15 | 23.9 | 17.2 | 17.7 | 17.4 | -0.7 | 0.79 |
| fsm_pit | 34.2 | 39.5 | 40.2 | 39.9 | -0.7 | 0.81 |
| binary_ctchist | 20.3 | 15 | 14.6 | 14.8 | 0.7 | 0.8 |
| level_8_start | x | x | x | x | 0.7 | 0.69 |
| h_month_m_9 | 5 | 2.6 | 2.8 | 2.7 | -0.7 | 0.78 |
| w_start | 12.6 | 13.2 | 13.1 | 13.3 | 0.7 | 0.82 |
| w_month_m_9 | 26.2 | 19.2 | 19 | 19.3 | 0.7 | 0.81 |
| h_month_m_15 | 5.3 | 3.2 | 3.4 | 3.2 | -0.7 | 0.8 |
| f_ethnicity_2_other | 24.2 | 14.1 | 13.5 | 13.3 | -0.6 | 0.8 |
| o_week_m1 | 11.4 | 18.4 | 17.7 | 17.9 | 0.6 | 0.84 |
| f_ethnicity_2_white | 74.9 | 85.6 | 86.2 | 86.4 | 0.6 | 0.81 |
| cin_flag | 9.5 | 11.8 | 12.1 | 11.9 | -0.6 | 0.84 |
| f_sex | 54.8 | 61 | 60.8 | 61.1 | 0.6 | 0.83 |
| w_month_m_12 | 27.3 | 19 | 18.8 | 19.1 | 0.6 | 0.84 |
| f_partner | 9.1 | 6.4 | 6.3 | 6.4 | 0.6 | 0.84 |
| i_month_m_9 | 24 | 18.6 | 19 | 18.8 | -0.5 | 0.85 |
| l_month_m_3 | 42.6 | 40.3 | 40.3 | 40.6 | 0.5 | 0.86 |
| f_children | 23.8 | 16.2 | 15.7 | 15.9 | 0.5 | 0.85 |
| f_miss_partner | 31.4 | 40.3 | 40 | 39.8 | -0.5 | 0.87 |
| binary_hbhist | 35.2 | 33 | 32.5 | 32.7 | 0.5 | 0.87 |
| binary_esahist | 22.3 | 18.7 | 18.7 | 18.9 | 0.5 | 0.86 |
| binary_emphist | 54.8 | 47.8 | 48 | 48.2 | 0.5 | 0.87 |
| binary_ibhist | x | x | x | x | 0.5 | 0.88 |
| binary_icahist | 4.4 | 2.8 | 2.9 | 2.8 | -0.5 | 0.86 |
| level_4_start | 8.3 | 5.9 | 5.8 | 5.9 | 0.4 | 0.87 |
| w_month_m_6 | 24.6 | 19.7 | 19.7 | 19.9 | 0.4 | 0.88 |
| wp_hist | x | x | x | x | 0.4 | 0.89 |
| i_month_m_24 | 22.4 | 13.7 | 13.6 | 13.8 | 0.4 | 0.87 |
| h_month_m_3 | 4.4 | 1.5 | 1.6 | 1.5 | -0.4 | 0.86 |
| h_month_m_6 | 4.7 | 2.2 | 2.3 | 2.2 | -0.4 | 0.88 |
| i_month_m_21 | 23 | 14.8 | 14.9 | 15 | 0.3 | 0.91 |
| o_month_m_21 | 35.6 | 51.9 | 51.6 | 51.5 | -0.3 | 0.92 |
| cla_flag | 4.9 | 5.4 | 5.4 | 5.4 | 0.3 | 0.92 |
| f_loneparent | 14.7 | 8.7 | 8.8 | 8.7 | -0.3 | 0.92 |
| c_start | 5 | 11.1 | 11.3 | 11.2 | -0.3 | 0.94 |
| i_month_m_18 | 23.7 | 15.4 | 15.4 | 15.5 | 0.3 | 0.92 |
| h_month_m_24 | 5.2 | 3.6 | 3.7 | 3.6 | -0.3 | 0.92 |
| binary_sahist | 2.8 | 1.5 | 1.6 | 1.5 | -0.3 | 0.92 |
| binary_uc_iwshist | 42.8 | 29.1 | 29.3 | 29.5 | 0.2 | 0.93 |
| h_month_m_18 | 5.2 | 3.4 | 3.5 | 3.4 | -0.2 | 0.93 |
| level_1_start | 91.9 | 92.7 | 93.4 | 93.3 | -0.2 | 0.94 |
| binary_uc_misshist | 1.1 | x | x | x | 0.2 | 0.85 |
| binary_jsahist | 34.4 | 50.7 | 50.8 | 50.7 | -0.2 | 0.95 |
| i_week_m1 | 22 | 17 | 17.2 | 17.1 | -0.2 | 0.95 |
| missing_exclusion_pit | 8.3 | 8.8 | 7.8 | 7.8 | 0.2 | 0.95 |
| missing_permanent_pit | 8.3 | 8.8 | 7.8 | 7.8 | 0.2 | 0.95 |
| h_month_m_21 | 5.3 | 3.4 | 3.5 | 3.4 | -0.2 | 0.95 |
| permanent_pit | x | x | x | x | 0.2 | 0.95 |
| f_miss_loneparent | 20.8 | 19 | 18.7 | 18.8 | 0.1 | 0.96 |
| o_start | 9.9 | 17.8 | 17.3 | 17.3 | 0.1 | 0.97 |
| int_start | 3.9 | 5.2 | 5.2 | 5.2 | -0.1 | 0.97 |
| binary_uc_ltoowhist | 5.8 | 2.6 | 2.6 | 2.6 | -0.1 | 0.96 |
| exclusion_pit | 15.8 | 13.5 | 13.6 | 13.6 | 0.1 | 0.97 |
| w_month_m_24 | 27.6 | 16.6 | 16.8 | 16.8 | -0.1 | 0.97 |
| binary_uc_eehist | 9.7 | 4.5 | 4.5 | 4.5 | 0.1 | 0.97 |
| intervention_year | 2017.2 | 2017.1 | 2017.1 | 2017.1 | -0.1 | 0.98 |
| i_start | 21.9 | 16.9 | 17.1 | 17 | -0.1 | 0.98 |
| i_month_m_6 | 23.7 | 19.4 | 19.5 | 19.6 | 0.1 | 0.98 |
| f_miss_children | 18.1 | 14.4 | 14.5 | 14.5 | -0.1 | 0.98 |
| int_hist | 1 | 1.2 | 1.2 | 1.2 | -0.1 | 0.98 |
| binary_uc_wfihist | 1.5 | x | x | x | -0.1 | 0.96 |
| i_month_m_3 | 23.1 | 18.1 | 18.3 | 18.3 | 0 | 0.99 |
| binary_uc_wprephist | 1 | x | x | x | 0 | 0.98 |
| binary_wtchist | 8.2 | 5.2 | 5.2 | 5.2 | 0 | 0.99 |
| binary_cbhist | 19.9 | 12.4 | 12.3 | 12.3 | 0 | 0.99 |
| f_ethnicity_2_black | x | x | x | x | 0 | 1 |
| binary_bbhist | x | x | x | x | 0 | 1 |
| binary_bsphist | x | x | x | x | 0 | 1 |
| binary_pibhist | x | x | x | x | 0 | 1 |
| binary_sdahist | x | x | x | x | 0 | 1 |
| binary_wbhist | x | x | x | x | 0 | 1 |
| missing_cla_flag | x | x | x | x | 0 | 1 |
Note: Some figures which have been suppressed for disclosure control purposes are denoted by an x.
Note: The definition of the matching variables can be found in the methodology document.
Table 11: PSM summary statistics used to assess the success of the matching for the main analytical run
| Summary Statistics | |
|---|---|
| Matching estimator | 100 Nearest Neighbours |
| bandwidth/calliper | 0.01 |
| Rubin’s B | 15.39 |
| Rubin’s R | 0.88 |
| Max % bias | 6.11% |
| Median % bias | 0.74% |
| Number on support | 2,264 |
| Number off support | 33 |
| Percent off support | 1.44% |
Appendix D: Regional cluster analysis
For all of the analysis presented in this report the comparison pool was selected from outside the regions where the programme was implemented. As discussed in the methodology report, care must be taken when doing this as local factors such as the availability of employment and public transport, levels of disadvantage, etc. all have an impact on the likelihood of someone finding and maintaining employment.
This analysis took advantage of cluster analysis carried out within DWP that groups the Local Authorities of Great Britain into 14 groups based on a range of variables about key features of the local labour market. These include local employment rates, unemployment-related benefit caseload, qualification levels, variables related to mental and physical health / disability characteristics of the local population.
This cluster information was used as a way of selecting the comparison pool from “similar” regions of Great Britain, and as a control variable in the propensity score matching. The cluster information was also used in the regional sub analysis to group the local authorities in which the programme was delivered.
Appendix E: Tables of results
Table 12: Showing the full list of generated results for the main run featuring all participants aged 18 to 29.
| Outcome measure | Participant group | Comparison group | Impact central | Impact lower | Impact upper | p-value |
|---|---|---|---|---|---|---|
| no. weeks at 1 year - employed | 16.0 | 14.4 | 1.6 | 0.7 | 2.5 | 0.00 |
| no. weeks at 1 year - looking for work | 24.6 | 21.3 | 3.3 | 2.3 | 4.4 | 0.00 |
| no. weeks at 1 year - inactive | 9.6 | 10.3 | -0.7 | -1.6 | 0.2 | 0.12 |
| no. weeks at 1 year - other | 7.0 | 10.2 | -3.2 | -3.8 | -2.5 | 0.00 |
| no. weeks at 2 years - employed | 37.4 | 33.9 | 3.5 | 1.7 | 5.3 | 0.00 |
| no. weeks at 2 years - looking for work | 43.0 | 37.0 | 5.9 | 4.1 | 7.8 | 0.00 |
| no. weeks at 2 years - inactive | 19.7 | 21.7 | -2.0 | -3.7 | -0.2 | 0.03 |
| no. weeks at 2 years - other | 13.7 | 19.6 | -5.9 | -7.2 | -4.7 | 0.00 |
| % at 1 year - employed | 37.7 | 34.0 | 3.7 | 1.4 | 6.0 | 0.00 |
| % at 2 years -employed | 42.9 | 38.5 | 4.4 | 2.0 | 6.7 | 0.00 |
| % at 1 year - looking for work | 37.4 | 32.4 | 5.0 | 2.8 | 7.3 | 0.00 |
| % at 2 years - looking for work | 33.5 | 29.1 | 4.5 | 2.2 | 6.7 | 0.00 |
| % at 1 year - inactive | 18.9 | 20.9 | -2.0 | -3.9 | -0.1 | 0.04 |
| % at 2 years -inactive | 19.4 | 22.9 | -3.4 | -5.4 | -1.5 | 0.00 |
| % at 1 year - other | 14.2 | 19.4 | -5.2 | -6.9 | -3.5 | 0.00 |
| % at 2 years - other | 13.1 | 17.3 | -4.2 | -5.8 | -2.5 | 0.00 |
| % in education at 3 months | 27.3 | 24.7 | 2.5 | 0.5 | 4.6 | 0.02 |
| % in education at 6 months | 27.0 | 22.0 | 5.0 | 2.9 | 7.0 | 0.00 |
| % in education at 9 months | 25.0 | 19.8 | 5.2 | 3.3 | 7.2 | 0.00 |
| % in education at 12 months | 22.8 | 17.5 | 5.3 | 3.4 | 7.2 | 0.00 |
| % neet at 3 months | 54.5 | 57.2 | -2.7 | -5.1 | -0.3 | 0.03 |
| % neet at 6 months | 50.2 | 56.3 | -6.0 | -8.4 | -3.7 | 0.00 |
| % neet at 9 months | 48.5 | 55.1 | -6.6 | -9.0 | -4.2 | 0.00 |
| % neet at 12 months | 49.0 | 54.8 | -5.9 | -8.2 | -3.5 | 0.00 |
| % work (start) to work (1 yr) | 8.9 | 9.7 | -0.8 | -2.2 | 0.6 | 0.27 |
| % work (start) to education (1 yr) | 3.5 | 2.3 | 1.3 | 0.4 | 2.1 | 0.00 |
| % work (start) to NEET (1 yr) | 3.2 | 2.8 | 0.4 | -0.4 | 1.2 | 0.32 |
| % education (start) to work (1 yr) | 10.2 | 9.3 | 0.9 | -0.5 | 2.3 | 0.20 |
| % education (start) to education (1 yr) | 10.2 | 10.7 | -0.5 | -1.9 | 0.9 | 0.45 |
| % education (start) to NEET (1 yr) | 9.6 | 9.8 | -0.2 | -1.6 | 1.1 | 0.75 |
| % NEET (start) to work (1 yr) | 20.7 | 17.3 | 3.3 | 1.4 | 5.3 | 0.00 |
| % NEET (start) to education (1 yr) | 10.5 | 6.1 | 4.4 | 3.0 | 5.7 | 0.00 |
| % NEET (start) to NEET (1 yr) | 37.2 | 42.8 | -5.6 | -7.9 | -3.3 | 0.00 |
| % at 1 year in work only | 29.5 | 27.4 | 2.1 | 0.0 | 4.3 | 0.05 |
| % at 2 years in work only | 34.1 | 30.9 | 3.2 | 0.9 | 5.4 | 0.01 |
| % at 1 year in looking for work only | 30.1 | 26.8 | 3.3 | 1.1 | 5.4 | 0.00 |
| % at 2 years in looking for work only | 26.1 | 23.2 | 2.9 | 0.9 | 5.0 | 0.01 |
| % at 1 year in inactive only | 18.0 | 19.7 | -1.7 | -3.6 | 0.1 | 0.07 |
| % at 2 years in inactive only | 17.8 | 21.0 | -3.2 | -5.0 | -1.3 | 0.00 |
| % at 1 year in other | 14.2 | 19.4 | -5.2 | -6.9 | -3.5 | 0.00 |
| % at 2 years in other | 13.1 | 17.3 | -4.2 | -5.8 | -2.5 | 0.00 |
| % at 1 year in looking for work and work | 7.3 | 5.5 | 1.8 | 0.6 | 3.0 | 0.00 |
| % at 2 years in looking for work and work | 7.2 | 5.8 | 1.5 | 0.3 | 2.7 | 0.02 |
| % at 1 year in inactive and work | x | 1.1 | -0.2 | -0.7 | 0.2 | 0.31 |
| % at 2 years in inactive and work | 1.6 | 1.9 | -0.3 | -0.9 | 0.3 | 0.38 |
| % at 1 year in looking for work and inactive | x | x | 0.0 | -0.1 | 0.1 | 0.92 |
| % at 2 years in looking for work and inactive | x | x | 0.0 | -0.1 | 0.1 | 0.68 |
Note: Some figures which have been suppressed for disclosure control purposes are denoted.
Table 13: Showing a list of generated results for the Pre-COVID group who started before 1 April 2018.
| Outcome measure | Participant group | Comparison group | Impact central | Impact lower | Impact upper | p-value |
|---|---|---|---|---|---|---|
| no. weeks at 1 year - employed | 15.5 | 14.1 | 1.4 | 0.4 | 2.4 | 0.00 |
| no. weeks at 1 year - looking for work | 24.8 | 21.2 | 3.6 | 2.5 | 4.7 | 0.00 |
| no. weeks at 1 year - inactive | 10.0 | 10.6 | -0.6 | -1.6 | 0.4 | 0.22 |
| no. weeks at 1 year - other | 6.8 | 10.1 | -3.3 | -4.0 | -2.6 | 0.00 |
| no. weeks at 2 years - employed | 36.2 | 33.3 | 2.9 | 1.0 | 4.9 | 0.00 |
| no. weeks at 2 years - looking for work | 42.6 | 36.6 | 5.9 | 3.9 | 7.9 | 0.00 |
| no. weeks at 2 years - inactive | 20.5 | 22.1 | -1.6 | -3.5 | 0.3 | 0.10 |
| no. weeks at 2 years - other | 13.8 | 19.8 | -6.0 | -7.4 | -4.7 | 0.00 |
| % at 1 year - employed | 37.3 | 33.7 | 3.5 | 1.0 | 6.0 | 0.01 |
| % at 2 years - employed | 41.8 | 37.9 | 4.0 | 1.4 | 6.5 | 0.00 |
| % at 1 year - looking for work | 36.3 | 31.5 | 4.8 | 2.3 | 7.2 | 0.00 |
| % at 2 years - looking for work | 32.5 | 28.0 | 4.5 | 2.1 | 6.9 | 0.00 |
| % at 1 year - inactive | 19.5 | 21.4 | -1.9 | -4.1 | 0.2 | 0.07 |
| % at 2 years -inactive | 20.1 | 22.9 | -2.8 | -4.9 | -0.6 | 0.01 |
| % at 1 year - other | 14.5 | 19.9 | -5.5 | -7.3 | -3.6 | 0.00 |
| % at 2 years - other | 13.7 | 18.1 | -4.4 | -6.2 | -2.6 | 0.00 |
| % in education at 3 months | 26.3 | 23.5 | 2.9 | 0.7 | 5.1 | 0.01 |
| % in education at 6 months | 26.5 | 20.7 | 5.8 | 3.6 | 8.0 | 0.00 |
| % in education at 9 months | 24.9 | 18.3 | 6.5 | 4.4 | 8.7 | 0.00 |
| % in education at 12 months | 22.7 | 16.7 | 6.0 | 3.9 | 8.1 | 0.00 |
| % neet at 3 months | 56.0 | 58.6 | -2.6 | -5.2 | -0.1 | 0.05 |
| % neet at 6 months | 51.1 | 57.5 | -6.4 | -9.0 | -3.8 | 0.00 |
| % neet at 9 months | 49.0 | 56.3 | -7.3 | -9.9 | -4.7 | 0.00 |
| % neet at 12 months | 49.4 | 55.8 | -6.3 | -8.9 | -3.7 | 0.00 |
| % work (start) to work (1 yr) | 8.5 | 9.2 | -0.7 | -2.2 | 0.7 | 0.32 |
| % work (start) to education (1 yr) | 3.6 | 2.0 | 1.6 | 0.7 | 2.5 | 0.00 |
| % work (start) to NEET (1 yr) | 3.2 | 2.2 | 1.0 | 0.1 | 1.9 | 0.03 |
| % education (start) to work (1 yr) | 9.5 | 8.9 | 0.6 | -0.9 | 2.1 | 0.41 |
| % education (start) to education (1 yr) | 9.2 | 9.4 | -0.2 | -1.7 | 1.2 | 0.75 |
| % education (start) to NEET (1 yr) | 9.4 | 9.0 | 0.3 | -1.1 | 1.8 | 0.68 |
| % NEET (start) to work (1 yr) | 21.1 | 17.7 | 3.4 | 1.3 | 5.6 | 0.00 |
| % NEET (start) to education (1 yr) | 11.3 | 6.5 | 4.8 | 3.2 | 6.3 | 0.00 |
| % NEET (start) to NEET (1 yr) | 37.9 | 44.9 | -7.0 | -9.6 | -4.5 | 0.00 |
| % at 1 year in work only | 29.8 | 27.2 | 2.6 | 0.3 | 5.0 | 0.03 |
| % at 2 years in work only | 33.8 | 31.1 | 2.7 | 0.3 | 5.2 | 0.03 |
| % at 1 year in looking for work only | 29.8 | 26.1 | 3.7 | 1.3 | 6.0 | 0.00 |
| % at 2 years in looking for work only | 25.8 | 22.7 | 3.1 | 0.9 | 5.3 | 0.01 |
| % at 1 year in inactive only | 18.4 | 20.2 | -1.7 | -3.8 | 0.3 | 0.10 |
| % at 2 years in inactive only | 18.6 | 21.2 | -2.6 | -4.7 | -0.6 | 0.01 |
| % at 1 year in other | 14.5 | 19.9 | -5.5 | -7.3 | -3.6 | 0.00 |
| % at 2 years in other | 13.7 | 18.1 | -4.4 | -6.2 | -2.6 | 0.00 |
| % at 1 year in looking for work and work | 6.5 | 5.4 | 1.1 | -0.2 | 2.4 | 0.09 |
| % at 2 years in looking for work and work | 6.6 | 5.2 | 1.3 | 0.1 | 2.6 | 0.04 |
| % at 1 year in inactive and work | x | 1.2 | -0.2 | -0.7 | 0.3 | 0.44 |
| % at 2 years in inactive and work | 1.4 | 1.6 | -0.1 | -0.7 | 0.5 | 0.73 |
| % at 1 year in looking for work and inactive | x | x | 0.0 | -0.1 | 0.1 | 0.92 |
| % at 2 years in looking for work and inactive | x | x | 0.0 | -0.1 | 0.1 | 0.75 |
Note: Some figures which have been suppressed for disclosure control purposes are denoted by an x.
Table 14: Showing a list of generated results for the COVID impacted group who started on or after 1 April 2018 and on or before 1 April 2020
| Outcome measure | Participant group | Comparison group | Impact central | Impact lower | Impact upper | p-value |
|---|---|---|---|---|---|---|
| no. weeks at 1 year - employed | 15.5 | 14.1 | 1.4 | 0.4 | 2.4 | 0.00 |
| no. weeks at 1 year - looking for work | 24.8 | 21.2 | 3.6 | 2.5 | 4.7 | 0.06 |
| no. weeks at 1 year - inactive | 10.0 | 10.6 | -0.6 | -1.6 | 0.4 | 0.47 |
| no. weeks at 1 year - other | 6.8 | 10.1 | -3.3 | -4.0 | -2.6 | 0.00 |
| no. weeks at 2 years - employed | 36.2 | 33.3 | 2.9 | 1.0 | 4.9 | 0.00 |
| no. weeks at 2 years - looking for work | 42.6 | 36.6 | 5.9 | 3.9 | 7.9 | 0.02 |
| no. weeks at 2 years - inactive | 20.5 | 22.1 | -1.6 | -3.5 | 0.3 | 0.26 |
| no. weeks at 2 years - other | 13.8 | 19.8 | -6.0 | -7.4 | -4.7 | 0.00 |
| % at 1 year - employed | 37.3 | 33.7 | 3.5 | 1.0 | 6.0 | 0.04 |
| % at 2 years -employed | 41.8 | 37.9 | 4.0 | 1.4 | 6.5 | 0.01 |
| % at 1 year - looking for work | 36.3 | 31.5 | 4.8 | 2.3 | 7.2 | 0.01 |
| % at 2 years - looking for work | 32.5 | 28.0 | 4.5 | 2.1 | 6.9 | 0.31 |
| % at 1 year - inactive | 19.5 | 21.4 | -1.9 | -4.1 | 0.2 | 0.57 |
| % at 2 years -inactive | 20.1 | 22.9 | -2.8 | -4.9 | -0.6 | 0.10 |
| % at 1 year - other | 14.5 | 19.9 | -5.5 | -7.3 | -3.6 | 0.00 |
| % at 2 years - other | 13.7 | 18.1 | -4.4 | -6.2 | -2.6 | 0.00 |
| % in education at 3 months | 26.3 | 23.5 | 2.9 | 0.7 | 5.1 | 0.33 |
| % in education at 6 months | 26.5 | 20.7 | 5.8 | 3.6 | 8.0 | 0.09 |
| % in education at 9 months | 24.9 | 18.3 | 6.5 | 4.4 | 8.7 | 0.15 |
| % in education at 12 months | 22.7 | 16.7 | 6.0 | 3.9 | 8.1 | 0.05 |
| % neet at 3 months | 56.0 | 58.6 | -2.6 | -5.2 | -0.1 | 0.10 |
| % neet at 6 months | 51.1 | 57.5 | -6.4 | -9.0 | -3.8 | 0.03 |
| % neet at 9 months | 49.0 | 56.3 | -7.3 | -9.9 | -4.7 | 0.01 |
| % neet at 12 months | 49.4 | 55.8 | -6.3 | -8.9 | -3.7 | 0.03 |
| % work (start) to work (1 yr) | 8.5 | 9.2 | -0.7 | -2.2 | 0.7 | 0.61 |
| % work (start) to education (1 yr) | x | x | 1.6 | 0.7 | 2.5 | 0.46 |
| % work (start) to NEET (1 yr) | x | x | 1.0 | 0.1 | 1.9 | 0.83 |
| % education (start) to work (1 yr) | 9.5 | 8.9 | 0.6 | -0.9 | 2.1 | 0.11 |
| % education (start) to education (1 yr) | 9.2 | 9.4 | -0.2 | -1.7 | 1.2 | 0.98 |
| % education (start) to NEET (1 yr) | 9.4 | 9.0 | 0.3 | -1.1 | 1.8 | 0.02 |
| % NEET (start) to work (1 yr) | 21.1 | 17.7 | 3.4 | 1.3 | 5.6 | 0.17 |
| % NEET (start) to education (1 yr) | 11.3 | 6.5 | 4.8 | 3.2 | 6.3 | 0.02 |
| % NEET (start) to NEET (1 yr) | 37.9 | 44.9 | -7.0 | -9.6 | -4.5 | 0.54 |
| % at 1 year in work only | 29.8 | 27.2 | 2.6 | 0.3 | 5.0 | 0.49 |
| % at 2 years in work only | 33.8 | 31.1 | 2.7 | 0.3 | 5.2 | 0.00 |
| % at 1 year in looking for work only | 29.8 | 26.1 | 3.7 | 1.3 | 6.0 | 0.25 |
| % at 2 years in looking for work only | 25.8 | 22.7 | 3.1 | 0.9 | 5.3 | 0.27 |
| % at 1 year in inactive only | 18.4 | 20.2 | -1.7 | -3.8 | 0.3 | 0.87 |
| % at 2 years in inactive only | 18.6 | 21.2 | -2.6 | -4.7 | -0.6 | 0.15 |
| % at 1 year in other | 14.5 | 19.9 | -5.5 | -7.3 | -3.6 | 0.00 |
| % at 2 years in other | 13.7 | 18.1 | -4.4 | -6.2 | -2.6 | 0.00 |
| % at 1 year in looking for work and work | 6.5 | x | 1.1 | -0.2 | 2.4 | 0.01 |
| % at 2 years in looking for work and work | 6.6 | x | 1.3 | 0.1 | 2.6 | 0.93 |
| % at 1 year in inactive and work | x | x | -0.2 | -0.7 | 0.3 | 0.10 |
| % at 2 years in inactive and work | x | x | -0.1 | -0.7 | 0.5 | 0.51 |
| % at 1 year in looking for work & inactive | x | x | 0.0 | -0.1 | 0.1 | 0.66 |
| % at 2 years in looking for work & inactive | x | x | 0.0 | -0.1 | 0.1 | 0.57 |
Note: Some figures which have been suppressed for disclosure control purposes are denoted by an x.
Table 15: showing the full list of generated results for participants classed as SEN.
| Outcome measure | Participant group | Comparison group | Impact central | Impact lower | Impact upper | p-value |
|---|---|---|---|---|---|---|
| no. weeks at 1 year - employed | 12.5 | 13.2 | -0.6 | -1.9 | 0.6 | 0.31 |
| no. weeks at 1 year - looking for work | 26.6 | 22.5 | 4.2 | 2.6 | 5.7 | 0.00 |
| no. weeks at 1 year - inactive | 11.3 | 11.5 | -0.2 | -1.7 | 1.2 | 0.73 |
| no. weeks at 1 year - other | 6.6 | 9.1 | -2.5 | -3.5 | -1.6 | 0.00 |
| no. weeks at 2 years - employed | 29.8 | 31.1 | -1.2 | -3.8 | 1.3 | 0.34 |
| no. weeks at 2 years - looking for work | 47.5 | 39.6 | 8.0 | 5.2 | 10.8 | 0.00 |
| no. weeks at 2 years - inactive | 23.3 | 24.5 | -1.2 | -3.9 | 1.6 | 0.40 |
| no. weeks at 2 years - other | 12.9 | 17.3 | -4.4 | -6.2 | -2.7 | 0.00 |
| % at 1 year - employed | 29.7 | 31.6 | -1.9 | -5.1 | 1.3 | 0.24 |
| % at 2 years -employed | 35.1 | 35.4 | -0.3 | -3.7 | 3.0 | 0.85 |
| % at 1 year - looking for work | 42.4 | 34.8 | 7.6 | 4.2 | 11.1 | 0.00 |
| % at 2 years - looking for work | 38.4 | 32.1 | 6.3 | 2.9 | 9.6 | 0.00 |
| % at 1 year - inactive | 22.6 | 24.2 | -1.6 | -4.6 | 1.4 | 0.28 |
| % at 2 years -inactive | 23.6 | 25.8 | -2.1 | -5.2 | 0.9 | 0.17 |
| % at 1 year - other | 13.7 | 16.9 | -3.2 | -5.6 | -0.8 | 0.01 |
| % at 2 years - other | 12.2 | 15.0 | -2.8 | -5.1 | -0.6 | 0.01 |
| % in education at 3 months | 26.6 | 24.0 | 2.6 | -0.4 | 5.5 | 0.09 |
| % in education at 6 months | 25.9 | 21.3 | 4.7 | 1.7 | 7.6 | 0.00 |
| % in education at 9 months | 22.5 | 18.8 | 3.7 | 0.9 | 6.5 | 0.01 |
| % in education at 12 months | 19.9 | 16.0 | 3.9 | 1.2 | 6.5 | 0.00 |
| % neet at 3 months | 59.2 | 58.9 | 0.4 | -3.0 | 3.8 | 0.83 |
| % neet at 6 months | 55.5 | 58.7 | -3.2 | -6.7 | 0.2 | 0.07 |
| % neet at 9 months | 55.7 | 57.4 | -1.7 | -5.2 | 1.7 | 0.33 |
| % neet at 12 months | 56.5 | 57.3 | -0.9 | -4.3 | 2.6 | 0.63 |
| % work (start) to work (1 yr) | 7.2 | 8.8 | -1.7 | -3.5 | 0.1 | 0.07 |
| % work (start) to education (1 yr) | 3.2 | x | 1.4 | 0.3 | 2.5 | 0.01 |
| % work (start) to NEET (1 yr) | 3.2 | 2.7 | 0.5 | -0.7 | 1.7 | 0.43 |
| % education (start) to work (1 yr) | 8.0 | 8.4 | -0.4 | -2.2 | 1.5 | 0.71 |
| % education (start) to education (1 yr) | 9.6 | 10.1 | -0.5 | -2.5 | 1.5 | 0.62 |
| % education (start) to NEET (1 yr) | 11.9 | 10.3 | 1.5 | -0.6 | 3.7 | 0.17 |
| % NEET (start) to work (1 yr) | 16.1 | 15.8 | 0.3 | -2.3 | 2.9 | 0.81 |
| % NEET (start) to education (1 yr) | 8.8 | 5.2 | 3.6 | 1.7 | 5.4 | 0.00 |
| % NEET (start) to NEET (1 yr) | 42.6 | 44.7 | -2.1 | -5.6 | 1.3 | 0.23 |
| % at 1 year in work only | 21.4 | 24.2 | -2.7 | -5.6 | 0.1 | 0.06 |
| % at 2 years in work only | 26.0 | 27.2 | -1.2 | -4.2 | 1.9 | 0.45 |
| % at 1 year in looking for work only | 34.8 | 28.7 | 6.2 | 2.9 | 9.5 | 0.00 |
| % at 2 years in looking for work only | 30.7 | 25.5 | 5.2 | 2.0 | 8.4 | 0.00 |
| % at 1 year in inactive only | 21.7 | 22.8 | -1.1 | -4.0 | 1.9 | 0.47 |
| % at 2 years in inactive only | 21.9 | 24.0 | -2.1 | -5.0 | 0.9 | 0.18 |
| % at 1 year in other | 13.7 | 16.9 | -3.2 | -5.6 | -0.8 | 0.01 |
| % at 2 years in other | 12.2 | 15.0 | -2.8 | -5.1 | -0.6 | 0.01 |
| % at 1 year in looking for work and work | 7.5 | 6.0 | 1.4 | -0.4 | 3.2 | 0.12 |
| % at 2 years in looking for work and work | 7.5 | 6.5 | 0.9 | -0.9 | 2.8 | 0.30 |
| % at 1 year in inactive and work | x | x | -0.6 | -1.3 | 0.1 | 0.08 |
| % at 2 years in inactive and work | x | x | -0.1 | -1.0 | 0.8 | 0.85 |
| % at 1 year in looking for work and inactive | x | x | 0.0 | -0.2 | 0.3 | 0.74 |
| % at 2 years in looking for work and inactive | x | x | 0.0 | -0.2 | 0.2 | 0.81 |
Note: Some figures which have been suppressed for disclosure control purposes are denoted by an x.
Table 16: showing the full list of generated results for participants not classed as SEN.
| Outcome measure | Participant group | Comparison group | Impact central | Impact lower | Impact upper | p-value |
|---|---|---|---|---|---|---|
| no. weeks at 1 year - employed | 19.0 | 16.2 | 2.8 | 1.5 | 4.0 | 0.00 |
| no. weeks at 1 year - looking for work | 22.9 | 20.5 | 2.5 | 1.1 | 3.8 | 0.00 |
| no. weeks at 1 year - inactive | 8.2 | 9.1 | -0.9 | -2.1 | 0.2 | 0.10 |
| no. weeks at 1 year - other | 7.3 | 10.5 | -3.2 | -4.1 | -2.2 | 0.00 |
| no. weeks at 2 years - employed | 43.8 | 38.0 | 5.8 | 3.3 | 8.4 | 0.00 |
| no. weeks at 2 years - looking for work | 39.0 | 34.6 | 4.4 | 2.0 | 6.8 | 0.00 |
| no. weeks at 2 years - inactive | 16.9 | 19.0 | -2.2 | -4.4 | 0.1 | 0.06 |
| no. weeks at 2 years - other | 14.2 | 20.6 | -6.5 | -8.2 | -4.7 | 0.00 |
| % at 1 year - employed | 44.6 | 37.4 | 7.2 | 4.0 | 10.4 | 0.00 |
| % at 2 years -employed | 49.5 | 43.5 | 5.9 | 2.7 | 9.2 | 0.00 |
| % at 1 year - looking for work | 33.2 | 29.6 | 3.6 | 0.6 | 6.6 | 0.02 |
| % at 2 years - looking for work | 29.3 | 25.7 | 3.6 | 0.7 | 6.5 | 0.01 |
| % at 1 year - inactive | 16.0 | 18.2 | -2.3 | -4.7 | 0.2 | 0.07 |
| % at 2 years -inactive | 16.2 | 19.6 | -3.4 | -5.9 | -1.0 | 0.01 |
| % at 1 year - other | 14.4 | 21.1 | -6.7 | -9.1 | -4.4 | 0.00 |
| % at 2 years - other | 13.6 | 18.7 | -5.0 | -7.3 | -2.8 | 0.00 |
| % in education at 3 months | 27.6 | 25.1 | 2.6 | -0.2 | 5.3 | 0.07 |
| % in education at 6 months | 27.7 | 22.0 | 5.7 | 2.9 | 8.5 | 0.00 |
| % in education at 9 months | 27.1 | 19.7 | 7.4 | 4.7 | 10.2 | 0.00 |
| % in education at 12 months | 25.2 | 18.5 | 6.7 | 4.1 | 9.4 | 0.00 |
| % neet at 3 months | 50.9 | 55.1 | -4.2 | -7.4 | -1.0 | 0.01 |
| % neet at 6 months | 46.2 | 53.2 | -7.0 | -10.2 | -3.8 | 0.00 |
| % neet at 9 months | 42.3 | 52.6 | -10.3 | -13.5 | -7.1 | 0.00 |
| % neet at 12 months | 42.6 | 51.7 | -9.1 | -12.3 | -5.9 | 0.00 |
| % work (start) to work (1 yr) | 10.4 | 10.8 | -0.4 | -2.4 | 1.6 | 0.69 |
| % work (start) to education (1 yr) | 3.9 | 2.8 | 1.1 | -0.1 | 2.3 | 0.06 |
| % work (start) to NEET (1 yr) | 3.1 | 2.8 | 0.3 | -0.8 | 1.4 | 0.54 |
| % education (start) to work (1 yr) | 12.1 | 10.7 | 1.4 | -0.6 | 3.4 | 0.18 |
| % education (start) to education (1 yr) | 10.7 | 10.8 | -0.2 | -2.1 | 1.8 | 0.86 |
| % education (start) to NEET (1 yr) | 7.8 | 8.8 | -1.0 | -2.6 | 0.7 | 0.25 |
| % NEET (start) to work (1 yr) | 24.6 | 19.0 | 5.7 | 2.9 | 8.4 | 0.00 |
| % NEET (start) to education (1 yr) | 11.8 | 6.9 | 5.0 | 3.0 | 6.9 | 0.00 |
| % NEET (start) to NEET (1 yr) | 32.5 | 40.6 | -8.1 | -11.2 | -5.0 | 0.00 |
| % at 1 year in work only | 36.5 | 31.1 | 5.4 | 2.3 | 8.5 | 0.00 |
| % at 2 years in work only | 40.9 | 36.1 | 4.9 | 1.7 | 8.0 | 0.00 |
| % at 1 year in looking for work only | 26.1 | 24.2 | 1.9 | -0.9 | 4.7 | 0.19 |
| % at 2 years in looking for work only | 22.2 | 19.9 | 2.4 | -0.3 | 5.0 | 0.08 |
| % at 1 year in inactive only | 15.0 | 17.3 | -2.3 | -4.7 | 0.1 | 0.06 |
| % at 2 years in inactive only | 14.6 | 17.8 | -3.2 | -5.6 | -0.8 | 0.01 |
| % at 1 year in other | 14.4 | 21.1 | -6.7 | -9.1 | -4.4 | 0.00 |
| % at 2 years in other | 13.6 | 18.7 | -5.0 | -7.3 | -2.8 | 0.00 |
| % at 1 year in looking for work and work | 7.1 | 5.4 | 1.8 | 0.1 | 3.4 | 0.03 |
| % at 2 years in looking for work and work | 6.9 | 5.7 | 1.2 | -0.4 | 2.9 | 0.13 |
| % at 1 year in inactive and work | x | x | 0.1 | -0.6 | 0.7 | 0.84 |
| % at 2 years in inactive and work | x | x | -0.2 | -1.0 | 0.7 | 0.71 |
| % at 1 year in looking for work and inactive | x | x | 0.0 | -0.1 | 0.0 | 0.40 |
| % at 2 years in looking for work and inactive | x | x | -0.1 | -0.2 | 0.0 | 0.20 |
Note: Some figures which have been suppressed for disclosure control purposes are denoted by an x.
Appendix F: SEN subgroup and COVID-19 outcome plots
Figure 5: Plots showing the percentage of participants and comparators in the 4 labour market categories for the COVID sub analysis.
The solid lines show the participant group, and the dotted lines show the comparison group. The dark blue lines show the ‘Employed’ category, the dark orange lines show the ‘Looking for work’ category, the light blue lines show the ‘Inactive’ category, and the light orange lines show the ‘Other’ category.
5(a) – Shows the labour market outcomes of the pre-COVID starters in the participant and comparison groups.
5(b) – Shows the labour market outcomes of the COVID impacted starters in the participant and comparison groups.
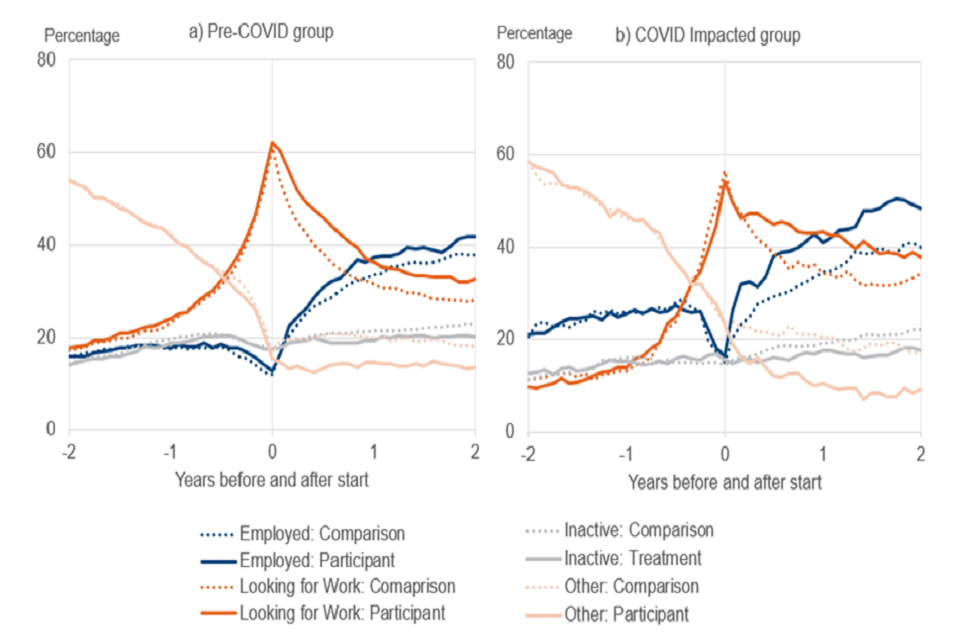
Figure 6: Plot showing the percentage of participants and comparators in the 4 labour market categories for the SEN sub analysis.
The solid lines show the participant group, and the dotted lines show the comparison group. The dark blue lines show the ‘Employed’ category, the dark orange lines show the ‘Looking for work’ category, the light blue lines show the ‘Inactive’ category, and the light orange lines show the ‘Other’ category.
6(a) – Shows the labour market outcomes of the SEN starters in the participant and comparison groups.
6(b) – Shows the labour market outcomes of the non-SEN impacted starters in the participant and comparison groups.
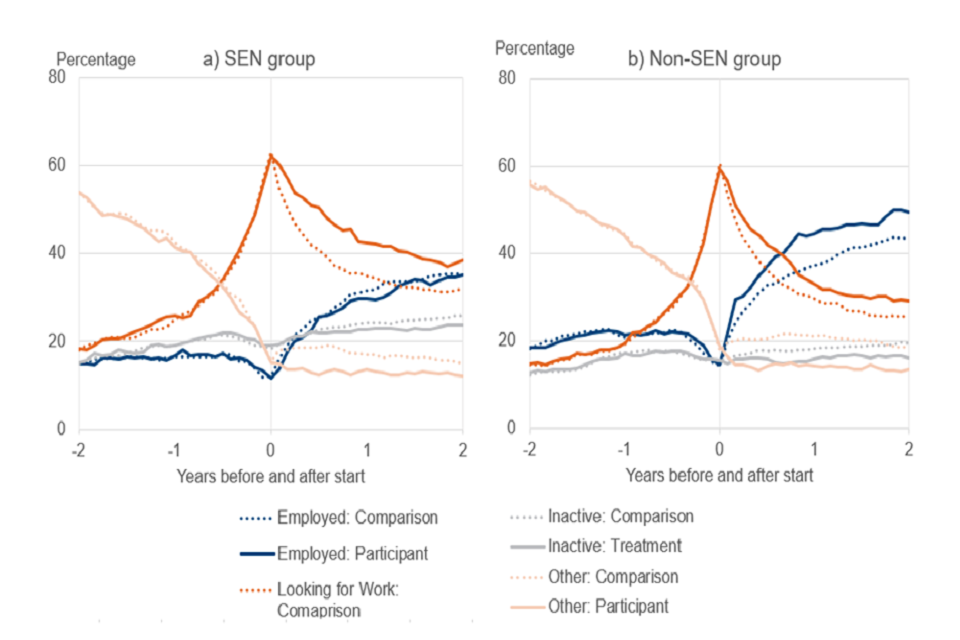
Appendix G: Glossary of Terms
| Term | Definition |
|---|---|
| Common support/ On Support/ Off support | Once propensity scores have been assigned for each observation, the overlap of propensity scores between the participants and comparison group is called ‘common support’. Those who fall in the overlap are referred to as ‘on support’, those who do not fall into the overlap are ‘off support’. |
| Comparison group | Carefully selected subset of the comparison pool, selected to have outcomes as similar as possible, to act as a counterfactual. |
| DfE | Department for Education |
| DLA | Disability Living Allowance |
| DWP | The Department for Work and Pensions |
| ESA | Employment and Support Allowance |
| ESF | European Social Fund |
| FSM | Free School Meals |
| HLC | Humber Learning Consortium |
| JSA | Jobseeker’s Allowance |
| NEET | Not in Employment, Education or Training |
| Participant group | The people who took part in the programme being evaluated. |
| PIP | Personal Independence Payment |
| Programme | The employment support provision under investigation. |
| Pseudo-start date | Dates assigned to the comparison pool in lieu of the real programme start dates of the participant group. |
| PSM | Propensity Score Matching |
| Quasi-Experimental | An experimental technique that looks to establish a cause and effect relationship between 2 variables, where the assignment to the participant or comparison group is not random. |
| RATW | Restricted Ability to Work. |
| Rubin’s B & R | A test used to evaluate the matching in PSM |
| SEN | Special Educational Needs |
| Statistically significant | Describes a result where the likelihood of observing that result by chance, where there is no genuine underlying difference, is less than a set threshold. In the Data Lab reports, this is set at 5 per cent. |
| UC | Universal Credit |
| User Organisation | The organisation using the employment data lab service. |