Employment Allowance take-up statistics: 2021 to 2022 tax year estimate
Published 16 June 2022

© Crown copyright 2022
This publication is licensed under the terms of the Open Government Licence v3.0 except where otherwise stated. To view this licence, visit nationalarchives.gov.uk/doc/open-government-licence/version/3 or write to the Information Policy Team, The National Archives, Kew, London TW9 4DU, or email: psi@nationalarchives.gov.uk.
Where we have identified any third party copyright information you will need to obtain permission from the copyright holders concerned.
This publication is available at https://www.gov.uk/government/statistics/employment-allowance-take-up-2021-to-2022-tax-year-estimate/employment-allowance-take-up-statistics-2021-to-2022-tax-year-estimate
1. Summary
These statistics show Employment Allowance take-up for the 2021 to 2022 tax year, which started on 6 April 2021 and ended on 5 April 2022.
-
Around 1,153,000 employers benefitted from the Employment Allowance in the 2021 to 2022 tax year. Claimants increased by 6% from the previous year.
-
In the 2021 to 2022 tax year, all parliamentary constituencies continued to have employers that benefit from the Employment Allowance.
Of these employers who benefit:
-
The largest three sectors account for 42% of claimants, with “Wholesale and retail trade; repair of motor vehicles and motorcycles” being the largest sector at 17%.
-
The largest three regions account for 42% of claimants, with ‘London’ having the most employers benefitting at 18%.
-
85% of companies claiming the Employment Allowance are ‘Micro’ employers (1-9 employees).
2. Overview
The number of employers benefitting from the Employment Allowance has risen from last year’s figure.
Table 1: Overview
| Year | Employers |
|---|---|
| 2014 to 2015 | 1,117,000 |
| 2015 to 2016 | 1,290,000 |
| 2016 to 2017 | 1,170,000 |
| 2017 to 2018 | 1,178,000 |
| 2018 to 2019 | 1,175,000 |
| 2019 to 2020 | 1,198,000 |
| 2020 to 2021 | 1,086,000 |
| 2021 to 2022 | 1,153,000 |
The total number of employers benefitting from the Employment Allowance has increased by around 67,000 (6%) from 1,086,000 in the 2020 to 2021 tax year to 1,153,000 in the 2021 to 2022 tax year.
In April 2015, eligibility of the relief was extended to domestic employers of care and support workers causing the resulting rise in take-up the following tax year. In April 2016, eligibility of the relief was restricted from sole director only companies causing the resulting decrease in take-up the following tax year.
From April 2020, the relief was restricted to employers with an employer NICs liability below £100,000 in the previous tax year. This has resulted in a decrease in take-up in the 2020 to 2021 tax year when compared to the previous tax years.
3. Sector distribution
The largest three sectors account for 42% of all employers that benefit from the Employment Allowance.
Table 2: Sector
| Sector | Employers |
|---|---|
| Wholesale and retail trade; repair of motor vehicles and motorcycles | 196,000 |
| Construction | 145,000 |
| Professional, scientific and technical activities | 140,000 |
| Accommodation and food service activities | 120,000 |
| Administrative and support service activities | 98,000 |
| Other service activities | 68,000 |
| Manufacturing | 63,000 |
| Human health and social work activities | 60,000 |
| Information and communication | 56,000 |
| Transportation and storage | 42,000 |
| Activities of households as employers… | 40,000 |
| Real estate activities | 30,000 |
| Agriculture, forestry and fishing | 25,000 |
| Arts, entertainment and recreation | 25,000 |
| Education | 21,000 |
| Financial and insurance activities | 18,000 |
| Other | 5,000 |
The largest proportion of employers benefitting from the relief are in the Wholesale and retail trade; repair of motor vehicles and motorcycles sector at 17% (196,000).
4. Region distribution
The largest three regions account for 42% of all employers that benefit from the Employment Allowance.
Table 3: Region
| Region | Employers |
|---|---|
| London | 202,000 |
| South East | 163,000 |
| North West | 120,000 |
| East of England | 113,000 |
| South West | 98,000 |
| West Midlands | 98,000 |
| Yorkshire and The Humber | 87,000 |
| East Midlands | 80,000 |
| Scotland | 79,000 |
| Wales | 47,000 |
| North East | 35,000 |
| Northern Ireland | 31,000 |
The largest proportion of employers benefitting from the relief are based in London at 18% (202,000). This is followed by the South East at 14% (163,000) and the North West at 10% (120,000).
3% of employers benefitting from the relief (31,000) are based in Northern Ireland.
5. Constituency distribution
All parliamentary constituencies have employers that benefit from the Employment Allowance.
Figure 1: Employment Allowance Claims by Constituency
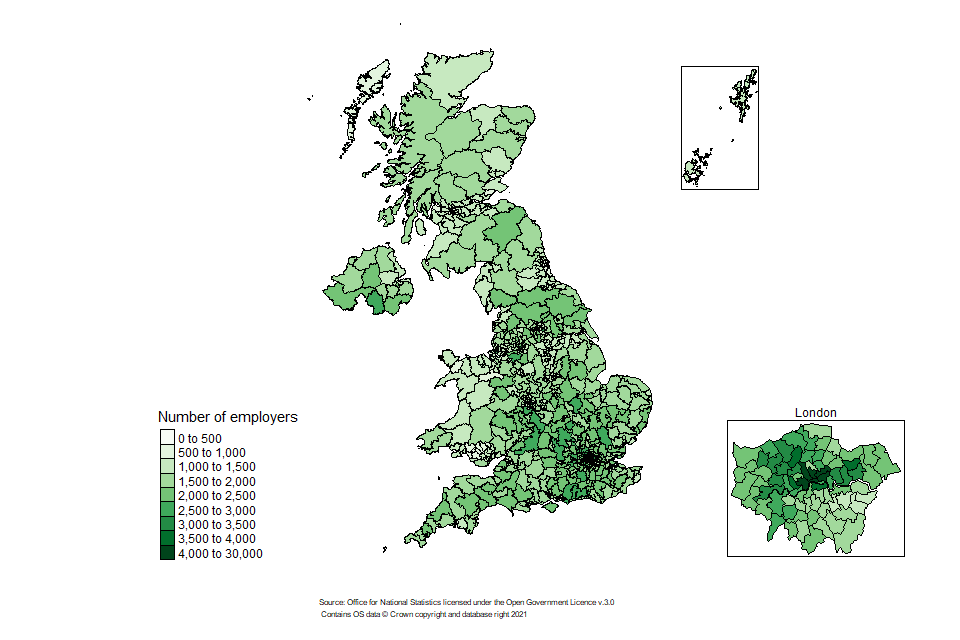
The three constituencies with the highest claimant figures are the Cities of London and Westminster with 19,000 employers benefitting, Holborn and St Pancras with 8,400 employers benefitting and Hackney South and Shoreditch with 5,600 employers benefitting. A full breakdown by constituency can be found in the accompanying Employment Allowance take-up statistics: 2021 to 2022 tax year estimate ODS file.
6. Employer size distribution
The vast majority (85%) of employers that benefit from the Employment Allowance are ‘micro’ employers, who have 1-9 employees.
Table 4: Employer size
| Employer size | Employers |
|---|---|
| 1-9 | 982,000 |
| 10-49 | 163,000 |
| 50-249 | 8,000 |
| 250+ | 0 |
Large employers only account for <1% (<500) of employers benefitting from the relief. This is likely to be driven by the April 2020 policy change, which restricted the Employment Allowance to employers whose employer NIC liability is below £100,000 in the previous tax year.
7. Commentary
7.1 Disclaimer
An Official Statistics Publication
These Official Statistics are produced to high professional standards in accordance with the Statistics and Registration Service Act 2007, signifying compliance with the Code of Practice for Official Statistics. They will undergo regular quality assurance reviews to ensure that they meet customer needs and are produced free from any political interference.
7.2 Further information about the Employment Allowance
These Official Statistics provide users with information on the Employment Allowance for the 2021 to 2022 tax year. In this release, employers are classified as benefitting from the Employment Allowance if they have had an amount of the allowance offset against their Class 1 Secondary National Insurance Contributions (NICs), hereafter referred to as employer NICs, paid to HMRC.
The Employment Allowance came into effect in April 2014 and provided eligible employers with a reduction of up to £2,000 in their employer NICs liabilities. In April 2016, the allowance rose to £3,000. Initially, the allowance was available to business, charities, amateur sports clubs; and as of April 2015, domestic employers of care and support workers are also eligible to claim the allowance. As of April 2016, limited companies where the director is the only employee with paid earnings above the Secondary Threshold for NICs are no longer able to claim the allowance. Other domestic employers and public sector employers where at least 50% of their work is of a public nature are not eligible for the allowance.
As of April 2020, the allowance was targeted to employers with an employer NICs liability below £100,000 in the previous tax year. The value of the allowance was also increased to £4,000 in April 2020 and was further increased to £5,000 in April 2022.
The Employment Allowance can be claimed through an employer’s payroll system which is then processed through HMRC’s Pay As You Earn (PAYE) Real Time Information (RTI) system. An employer can claim their eligibility by submitting an Employer Payment Summary. When an employer then sends through their Full Payment Submissions when submitting their payroll, the allowance is offset against their employer NIC liabilities due on their employee(s).
Further guidance on this can be found at the Employment Allowance guidance page.
8. Methodology
8.1 Number of employers
The number of employers benefitting from the Employment Allowance is taken from HMRC’s Enterprise Tax Management Platform data. An employer is defined as benefitting if they have had an amount of the allowance offset against their employer NICs liabilities.
8.2 Sector and location
Sector and location information is taken from the Business Lookup Table (BLT) by matching across the ETMP data. Sectors are defined using Standard Industry Classification codes and had a match-rate of 93%. Postcode information, used to identify regions and parliamentary constituencies, had a match-rate of 93%. The postcode used corresponds to the enterprise which is claiming the relief. Large enterprises tend to operate from multiple locations, and a single postcode may not necessarily reflect where they carry out their operations.
8.3 Employer size
Employer size information is taken from HMRC’s RTI data. It is a measure of employee count corresponding to the PAYE scheme which is claiming the relief at the end of the tax year, and had a match-rate close to 100%. This may not be entirely representative of actual employer size where businesses have large fluctuations in employment seasonality over the course of the year (such as temporary summer and Christmas positions); employers may also have multiple PAYE schemes.
8.4 Caveats
- Figures are rounded to the nearest 1,000 and the nearest %, apart from the constituency distribution which is rounded to the nearest 100
- Sum of sector/location/employer size may not sum to the total due to rounding and negligible numbers of employers falling into smaller sectors or locations
- Cases without sector/location/employer size information have been apportioned across sector/location/employer size based on the distribution of cases where sector/location/employer size information is known
- Other sector includes: ‘Mining and quarrying’, ‘Electricity, gas, steam and air conditioning supply’, ‘Water supply; sewerage, waste management and remediation activities’, and ‘Public administration and defence; compulsory social security’
- “Activities of households as employers;undifferentiated goods-and services-producing activities of households for own use” has been shortened to “Activities of households as employers…”
9. User engagement
HMRC is committed to providing impartial quality statistics that meet our users’ needs. We encourage our users to engage with us so that we can improve our statistics and identify gaps in the statistics that we produce. Please see HMRC Statistics Continuous User Engagement Strategy.
If you would like to comment on these statistics or have any enquiries on the statistics please use the statistical contacts named below.
-
J Yeo
-
W Ahmad
-
C McKay
For press enquiries, please contact HMRC Press Office: news.desk@hmrc.gov.uk.