Emissions of air pollutants in the UK – Nitrogen oxides (NOx)
Updated 13 March 2025
1. What are nitrogen oxides and why are their emissions estimated?
Nitrogen oxides (NOx) refers to nitric oxide (NO) and nitrogen dioxide (NO2), both of which are mainly formed during the combustion of fossil fuels. The dominant portion of these gases is nitric oxide (NO). NO can react with other gases in the atmosphere to form nitrogen dioxide (NO2) which is harmful to health. These reactions take place very quickly and are reversible, so the two gases are referred to together as NOx.
In the most recent annual air quality assessment (for 2023), the UK was non-compliant with the annual mean concentration limit value for NO2 (as set in the Air Quality Standards Regulations (2010)) at a number of roadside locations in urban areas. It is estimated that, on average in 2023, 68 per cent of the NO2 concentrations at the roadside originated as NOx emissions from road transport.
Short-term exposure to concentrations of NO2 can cause inflammation of the airways and increase susceptibility to respiratory infections and to allergens. NO2 can exacerbate the symptoms of those already suffering from lung or heart conditions. In addition, NOx can have environmental impacts. Deposition of nitrogen to the environment both directly as a gas (dry deposition) and in precipitation (wet deposition) can change soil chemistry and affect biodiversity in sensitive habitats.
NOx can react with other air pollutants (e.g. NMVOCs) to form ground-level ozone. Ozone is a gas which is damaging to human health and can trigger inflammation of the respiratory tract, eyes, nose and throat, as well as asthma attacks. Ozone can also have adverse effects on the environment through oxidative damage to vegetation including crops.
NOx can be emitted both by natural processes, such as wildfires, and as a result of human activities, such as the combustion of fuels. The National Atmospheric Emissions Inventory, and the statistical tables published as part of this release, mostly covers NOx emissions from human activities, but there are a few exceptions included as memo items, such as forest fires. The information presented in this document only covers NOx emissions from human activities within the UK.
The Convention on Long Range Transboundary Air Pollution (CLRTAP)’s amended Gothenburg Protocol and National Emission Ceilings Regulations (NECR) (2018) requires the UK to reduce emissions of NOx by 55 per cent compared to emissions in 2005 by 2020 and in each subsequent year, up to and including 2029. The NECR also requires the UK to reduce emissions of NOx by 73 per cent compared to emissions in 2005 by 2030.
2. Trends in total annual emissions of nitrogen oxides in the UK, 1990 to 2023
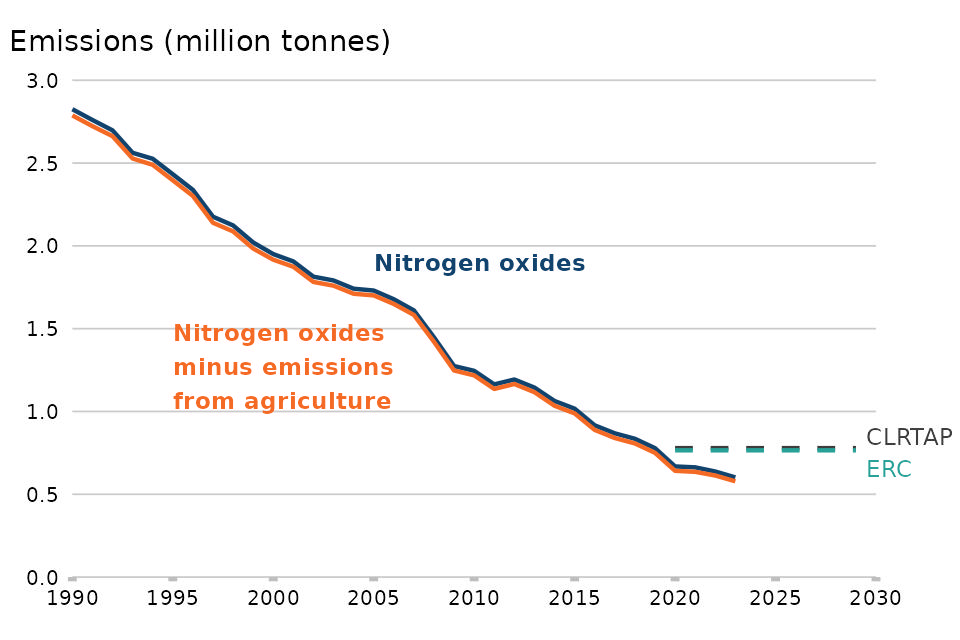
Figure 6: Annual emissions of nitrogen oxides in the UK: 1990 – 2023

Notes:
-
‘ERC’ refers to the emission reduction commitment applicable between 2020 and 2029, as set out in the National Emission Ceilings Regulations (2018). This applies to the series ‘Nitrogen oxides minus emissions from agriculture’, which excludes emissions from agricultural soils and manure management.
-
‘CLRTAP’ refers to the emission reduction commitment applicable from 2020 onwards, as set out in the Convention on Long Range Transboundary Air Pollution. This applies to the series ‘Nitrogen oxides’.
View the data for this chart (years available: 1970-2023)
Download the data for this chart in CSV format (years available: 1970-2023)
Emissions of NOx have decreased by 79 per cent since 1990, to 602 thousand tonnes in 2023. This trend was driven by a decline in coal use in power stations and industrial sites and by the modernisation of the road transport fleet. Emissions of NOx decreased by 6 per cent between 2022 and 2023. This continues the long-term decline since 1990 as total emissions have decreased on average by 5 per cent per year between 1990 and 2023.
The data for 2023 show that the UK met the 55 per cent emission reduction commitment from 2005 emission levels. Excluding agricultural sources (which are not required for the NECR assessment of reductions, see section 4 of the Background), there were 578 thousand tonnes of emissions of NOx in 2023, having fallen by 1123 thousand tonnes since 2005 (i.e. emissions decreased by 66 per cent).
3. Major emission sources for nitrogen oxides in the UK
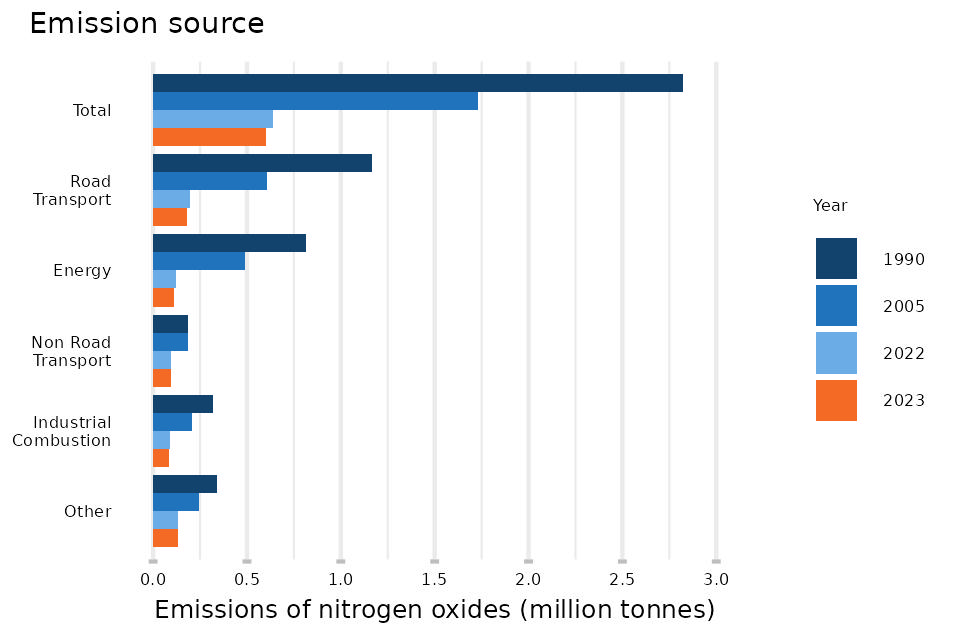
Figure 7: Annual emissions of nitrogen oxides in the UK by major emission source: 1990, 2005, 2022 and 2023

Note:
-
‘Industrial combustion’ refers to the burning of fuels on manufacturing and construction sites, to generate energy for industrial use, for example to drive mobile machinery or to create heat or electricity for industrial processes. This does not include emissions for public electricity and heat production, for the production of fuels, or from fuel combustion in the public sector, the commercial sector, or the agricultural, forestry and fishing sectors.
-
‘Energy’ refers to fuel combustion in energy industries. This includes combustion in public electricity and heat production, petroleum refining and the production of other fuels.
Download the data for this chart in CSV format
Road transport contributed 30 per cent of emissions of NOx in 2023. The introduction of catalytic converters and stricter emissions regulations resulted in a downward trend in emissions after 1990. This is due to the replacement of older vehicles in the vehicle fleet with newer vehicles that meet stricter emissions standards, and more recently, the uptake of electric vehicles. Annual emissions from road transport decreased by 70 per cent between 2005 and 2023.
Emissions of NOx from non-road transport (aviation, rail, and shipping) decreased by 49 per cent between 2005 and 2023 and contributed 16 per cent of total NOx emissions in 2023. Most emissions from this source derive from shipping (which alone contributed 11 per cent towards total NOx emissions in 2023). Emissions from shipping have been on a downward trend since 1999, falling by 62 per cent from 1999 to 2023, partly due to a reduction in vessels serving the offshore oil and gas industry and more stringent engine standards. Emissions from aviation and railways both fell from 2019 to 2020, in part due to falling economic activity during the COVID-19 pandemic. Emissions from aviation rose as economic activity recovered, although emissions in 2023 were 6 per cent lower than 2019 levels.
In 2023, fuel combustion in energy industries contributed 19 per cent of total NOx emissions, whilst industrial combustion contributed 14 per cent. Emissions from power stations (part of the energy sector) and industrial combustion plants have reduced substantially, reflecting a long-term trend away from the use of coal and oil in favour of natural gas and renewable energy sources. Annual emissions of NOx from fuel combustion in energy industries have decreased by 77 per cent between 2005 and 2023, while emissions from industrial combustion decreased by 59 per cent over the same period.
Levels and trends in emissions from specific sources are available for the period 1990 to 2023 through the statistical tables that accompany this release.
Sections in this release
Emissions of particulate matter (PM10 and PM2.5)
Emissions of non-methane volatile organic compounds
Methods and quality processes for UK air pollutant emissions statistics (PDF)
