Emissions of air pollutants in the UK – Non-methane volatile organic compounds (NMVOCs)
Updated 13 March 2025
This data was revised on March 13th 2025 to apply the latest, improved domestic combustion methodology across all sources. This correction has impacted domestic combustion emissions across the time series causing a substantial reduction to sulphur dioxide emissions and a minor increase to NMVOC emissions.
1. What are NMVOCs and why are their emissions estimated?
Non-methane volatile organic compounds (NMVOCs) are a large group of organic compounds which differ widely in their chemical composition but can display similar behaviour in the atmosphere. NMVOCs are emitted to the air from a range of sources, including combustion, petrol vapour, solvents, air fresheners, cleaning products, and perfumes.
NMVOCs can have negative impacts on health and the environment. Firstly, NMVOCs can react with other air pollutants outdoors in the presence of sunlight (via ultraviolet radiation) to produce ground-level ozone. Ozone poses risks to health by triggering inflammation and asthma, but also causes damage to vegetation, including crops.
NMVOCs also pose a threat to health indoors. Although ozone is not typically formed indoors since most ultraviolet radiation is absorbed by glass, reactions between different NMVOCs and chemicals from combustion processes such as smoking, heating, cooking or candle burning can produce dangerous chemicals like formaldehyde. Formaldehyde is a human carcinogen but is also known to cause irritation to the eyes and upper airways at low concentrations. The NMVOC formaldehyde can also be emitted directly from furniture, finishes and building materials such as laminate flooring, kitchen cabinets and wood panels.
Finally, NMVOCs can also contribute to concentrations of airborne particulate matter which also has serious health implications (see the particulate matter section of this release for more information). Due to the adverse effects NMVOCs can cause, alongside the wide geographical spread and large variety of sources, the UK aims to identify and reduce NMVOC emissions where possible.
NMVOCs can be emitted both by natural processes (such as vegetation, soils, and lightning) and as a result of human activities (such as food and drink production and the use of solvents). The National Atmospheric Emissions Inventory (NAEI), and the statistical tables published as part of this release, mostly covers NMVOC emissions from human activities. However, there are a few exceptions included as memo items, such as forest fires. The information presented in this document only covers NMVOC emissions from human activities in the UK.
The revised Convention on Long Range Transboundary Air Pollution (CLRTAP) and National Emission Ceilings Regulations (2018) (NECR) requires the UK to reduce emissions of NMVOCs by 32 per cent compared to 2005 emissions by 2020 and in each subsequent year up to and including 2029 (and by 39 per cent compared to 2005 emissions by 2030).
2. Trends in total annual emissions of NMVOCs in the UK, 1990 to 2023
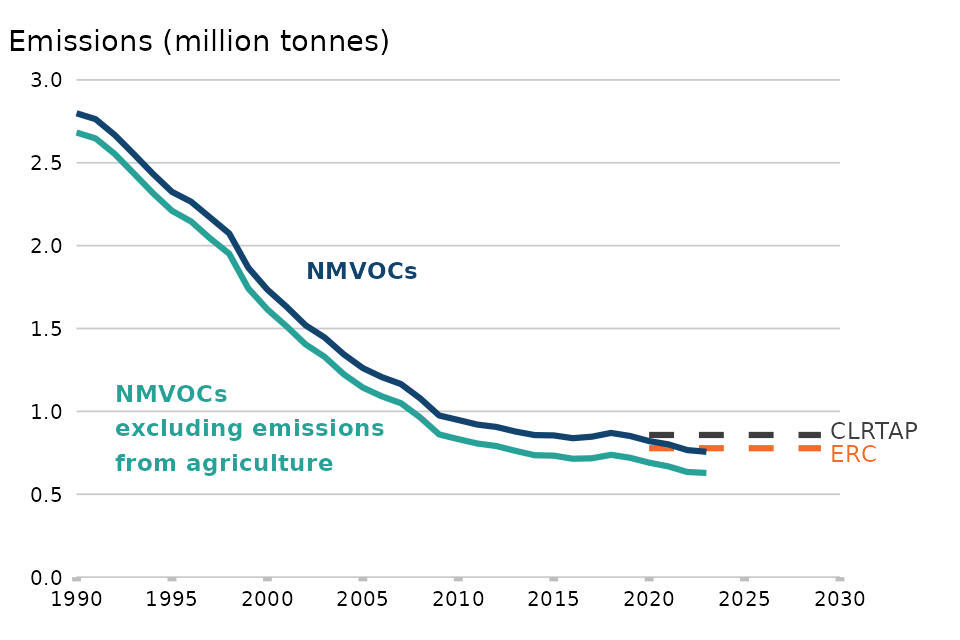
Figure 10: Annual emissions of NMVOCs in the UK: 1990 - 2023

Notes:
-
‘ERC’ refers to our emission reduction commitment applicable between 2020 and 2029, as set out in the National Emission Ceilings Regulations (2018). This is applicable to the series ‘NMVOCs excluding emissions from agriculture’, i.e. which excludes agricultural soils and manure management.
-
‘CLRTAP’ refers to our emission reduction commitment applicable from 2020 onwards, as set out in the Convention on Long Range Transboundary Air Pollution. This is applicable to the series ‘NMVOCs’.
View the data for this chart (years available: 1970-2023)
Download the data for this chart in CSV format (years available: 1970-2023)
Emissions of NMVOCs decreased by 73 per cent since 1990, to 756 thousand tonnes in 2023. Emissions decreased by 1 per cent between 2022 and 2023.
NMVOC emissions decreased on average by 5 per cent per year between 1990 and 2009. This was largely due to improvements to emissions standards for road transport and stricter limits applied to industrial processes. However, more recently annual changes have been much smaller, emissions decreased on average by 2 per cent per year since 2009.
The NECR sets out our emission reduction commitments to maintain emissions below 778 thousand tonnes throughout 2020 to 2029 (excluding agricultural sources). The UK did meet the 32 per cent emission reduction commitment in 2023.
3. Major emission sources for NMVOCs in the UK
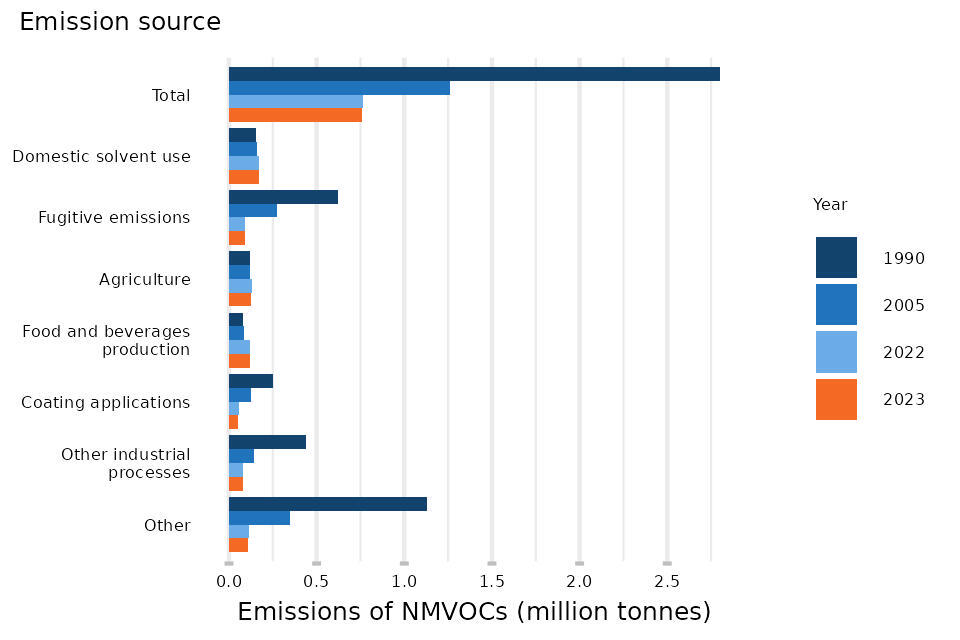
Figure 11: Annual emissions of non-methane volatile organic compounds (NMVOCs) in the UK by major emission source: 1990, 2005, 2022 and 2023

Notes:
-
‘Domestic solvents’ refers to the solvents in consumer products such as aerosols, detergents and fragrances. This includes the usage of fungicides and other agricultural chemicals.
-
‘Coating Applications’ refers to the use of solvents in industrial coatings (such as specialist finishes applied to vehicles, wood, metal and plastic products) and decorative paints.
-
‘Other Industrial processes’ refers to the ‘industrial processes and product use’ sources that are not captured within the other sources within this figure, i.e. excluding coating applications, domestic solvents and food and beverages production.
Download the data for this chart in CSV format
Domestic solvents were the largest source of NMVOC emissions in 2023, which have grown as a source over time along with population growth (this source contributed 23 per cent of total emissions in 2023 and has increased by 12 per cent since 1990). Emissions from this source peaked in 2020, largely due to increased hand sanitiser use throughout the COVID-19 pandemic. Most emissions from this source come from aerosols in household products, cosmetics and toiletries, followed by emissions from vehicle screen wash.
Fugitive emissions (that is losses, leaks and other releases of gases) are associated with the extraction, refining and distribution of fossil fuels like oil and gas. Such emissions have reduced substantially (decreased by 85 per cent from 1990 to 2023), although in 2023 they still contributed 12 per cent of NMVOC emissions. The decline in coal mining and the production of oil, coupled with better emissions control, is responsible for the long-term decline in emissions from this source. Major contributors towards fugitive emissions of NMVOC’s in 2023 include gas leakage from natural gas supply, and fugitive emissions released during the transfer of crude oil or refined petroleum products from storage facilities to transport vessels such as tankers, pipelines and trucks. Fugitive emissions of NMVOCs are also released as vehicles refuel at petrol stations.
Emissions from agriculture have increased by 7 per cent from 1990 to 2023 and contributed 17 per cent of NMVOC emissions in 2023. This has largely been driven by an increased use of manure-based fertilisers and growth in the rearing of chickens and dairy cows over this time period.
Emissions from food and beverages production contributed 16 per cent towards total NMVOC emissions in 2023. Emissions from this source have increased over the long-term (increased by 48 per cent between 1990 and 2023). The largest contributor towards emissions of NMVOCs in this source is Scotch whisky production (which contributed 11 per cent of total NMVOC emissions in 2023) followed by the manufacture of animal feed (which contributed 2 per cent of total NMVOC emissions in 2023). Other sources include malting, which contributed 1 per cent towards total NMVOC emissions in 2023, and bread baking, which contributed 1 per cent of total NMVOC emissions in 2023. There has been consistent growth in emissions of NMVOCs from Scotch whisky production since 1990 (they have increased by 106 per cent over this period).
Emissions from industrial coating applications represent 7 per cent of total NMVOC emissions in 2023. Emissions from this source are declining, having fallen by 79 per cent from 1990 to 2023. Most emissions from this source derive from decorative paints used in industry, followed by metal and plastic coatings.
Emissions from other industrial processes and product use have fallen by 82 per cent from 1990 to 2023. This was largely driven by a decline in emissions from the chemical industry. Another factor that contributed towards this trend was a decline in emissions from the use of solvents for degreasing and dry cleaning, in part due to technological improvements in the equipment used to carry out the cleaning and due to a phase out the most emitting solvents. Emissions from inks used in printing have also fallen.
Other sources of NMVOC emissions include road transport, which was a major source of NMVOCs in the early 1990s. In 1990 road transport contributed 33 per cent of total NMVOC emissions. More stringent emission standards mean that emissions from road transport have fallen to only contribute 4 per cent of total emissions in 2023.
Levels and trends in emissions from specific sources are available for the period 1990 to 2023 through the statistical tables that accompany this release.
Sections in this release
Emissions of particulate matter (PM10 and PM2.5)
Methods and quality processes for UK air pollutant emissions statistics (PDF)
