Electric vehicle charging device statistics: April 2021
Published 11 May 2021

© Crown copyright 2021
This publication is licensed under the terms of the Open Government Licence v3.0 except where otherwise stated. To view this licence, visit nationalarchives.gov.uk/doc/open-government-licence/version/3 or write to the Information Policy Team, The National Archives, Kew, London TW9 4DU, or email: psi@nationalarchives.gov.uk.
Where we have identified any third party copyright information you will need to obtain permission from the copyright holders concerned.
This publication is available at https://www.gov.uk/government/statistics/electric-vehicle-charging-device-statistics-april-2021/electric-vehicle-charging-device-statistics-april-2021
About this release
This release presents experimental statistics on the number of publicly available electric vehicle charging devices in the UK, broken down by Local Authority. Data is provided by the electric vehicle and charging point platform Zap-Map.
The coronavirus pandemic is likely to have had a small impact on figures where data coincides with various restrictions.
The next quarterly report is scheduled for release in July 2021.
Key findings
As of 1 April 2021:
- there were 22,790 public electric vehicle charging devices available in the UK
- of the total devices available, 4,259 are rapid chargers
In the first quarter of 2021 (January to March):
- available devices increased by 2,015, up nearly 10% on the previous quarter (October to December 2020)
- rapid devices increased by 379, corresponding to a quarterly growth of almost 10%
- this is the largest absolute quarterly growth in both total and rapid devices since 2015
UK growth in public charging devices
Since 2015, the number of public devices has grown by 43% per year, on average. Rapid devices have increased at a much higher rate, with an average annual increase of almost 61%. The coronavirus pandemic may have had an effect on device growth, with the increase in total and rapid devices over the last 12 months being 27% and 37% respectively. This is a noticeable decrease in the annual growth in the preceding 12 months, with increases of 54% and 53%.
Table EVCD_01a and Table EVCD_01b provide a breakdown of public charging devices in each local authority in the UK whilst Table EVCD_02 shows the change in the number of devices since 2015. These tables are published alongside this report.
Chart 1 Growth in UK public charging devices since 2015 Table EVCD_02
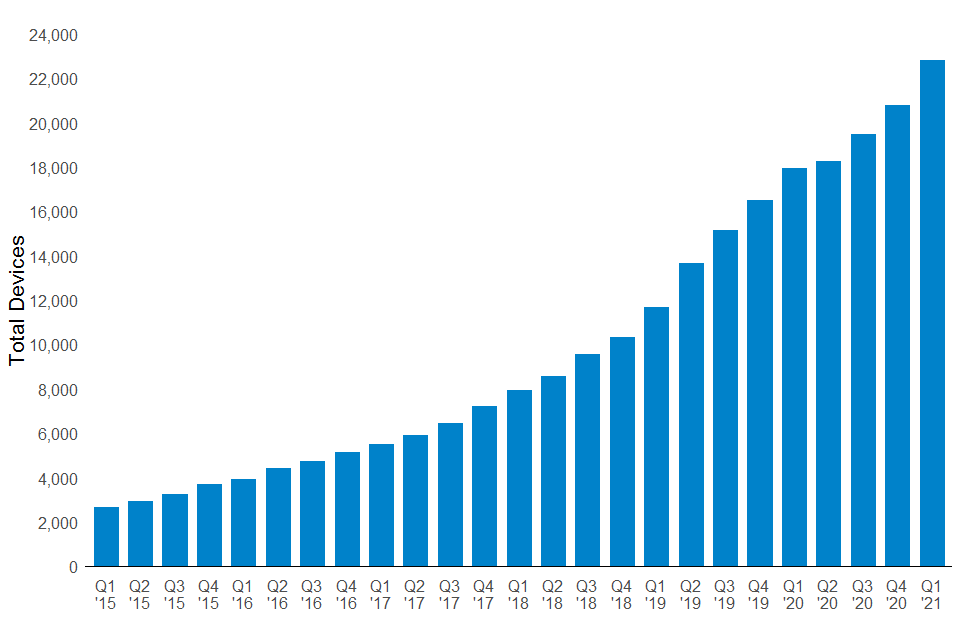
This chart shows the increase in public charging devices from 2015 to present. Device numbers have increase from 2664 in 2015, to 22790 for the most recent quarter.
Chart 2 Growth in UK public rapid charging devices since 2015 Table EVCD_02
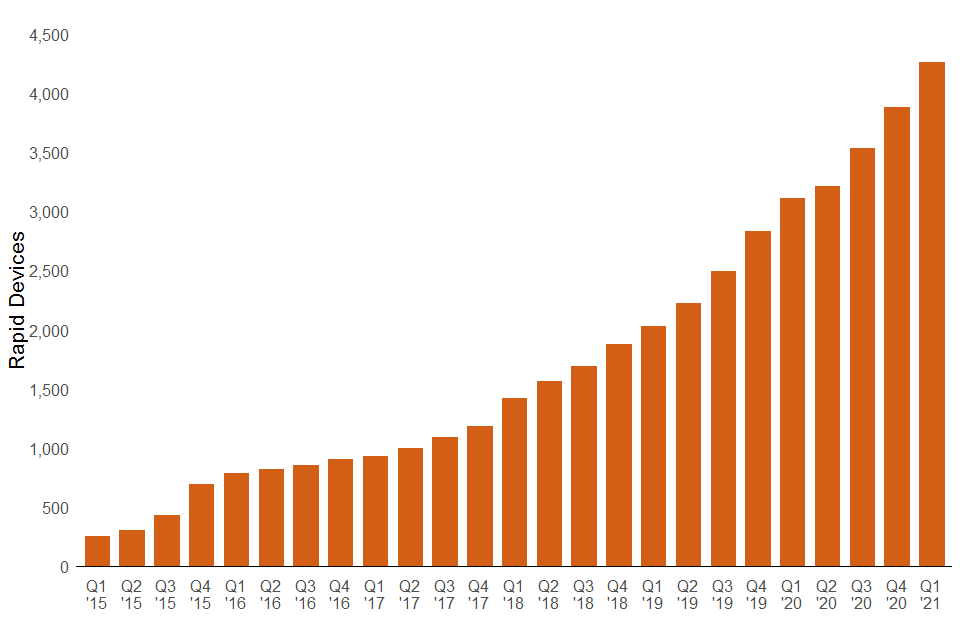
This chart shows the increase in rapid public charging devices from 2015 to present. Devices numbers have increased from 249 in 2015, to 4,259 for the most recent quarter.
Regional distribution of charging devices
There is uneven geographical distribution of charging devices within the UK. Some UK local authorities have bid for UK Government funding for charging devices, and others have not. Most of the provision of this infrastructure has been market-led, with individual charging networks and other businesses (such as hotels) choosing where to install devices.
Charts 3 and 4 show that London and Scotland have the highest level of charging provision per 100,000 of population, with 80 and 43 devices per 100,000 respectively. Chart 4 also indicates that Scotland has the highest rate of rapid device provision of 11 rapid devices per 100,000, whilst the average provision in the UK is 6.4 per 100,000.
Chart 3 Public charging devices per 100,000 of population by UK country and region Table ECVD_01a
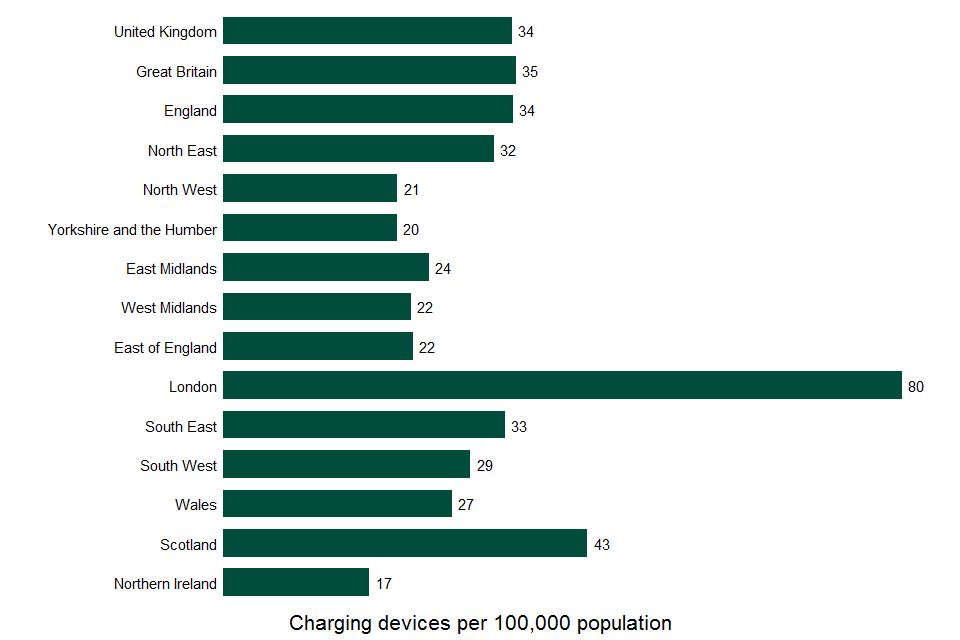
This chart shows public charging devices per 100000 population by UK country and region. The UK has 34 devices per 100000. London has the highest number, with 80 devices per 100000. Northern Ireland has the least, with 17 devices.
Chart 4 Public rapid charging devices per 100,000 of population by UK country and region Table ECVD_01b
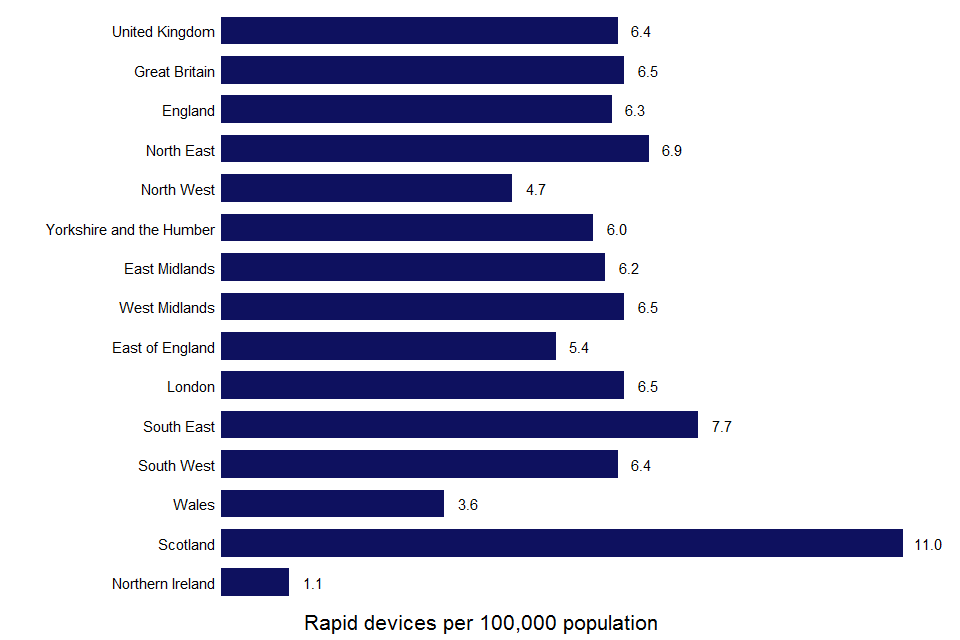
This chart shows public rapid charging devices per 100000 population by UK country and region. UK has 6.4 rapid devices per 100000. Scotland has the highest number, 11.0 devices per 100000. Northern Ireland has the least, with 1.1 devices.
Maps 1 and 2 - Total and rapid public charging devices per 100,000 of population by UK region
Map 1 shows the UK regions, with devices per 100000 population. Map 2 shows UK regions, with rapid devices per 100000.
Charging devices have largely been funded by private sector investment, however a number of the devices have been Government funded via a number of grant schemes operated by the Office for Zero Emission Vehicles (OZEV). The Office for Zero Emission Vehicles also provides grant funding for private domestic charging and workplace charging devices, however these types of devices are not included within these statistics as they are not necessarily available to the general public.
An interactive map of this data is available.
Quarterly change in public charging devices
Maps 3 and 4 - Quarterly change in total and rapid public charging devices per region
Map 3 shows UK regions, quarterly growth in percentages for all devices. Map 4 shows UK regions, quarterly growth in percentages for rapid devices.
As Maps 3 and 4 show, all regions of the UK have seen an increase in charging devices in the most recent quarter, whilst all but Northern Ireland have had an increase in rapid devices. The number of available devices can fluctuate for a range of reasons. Increases likely reflect installation of new devices, whilst owners and operators can choose to temporarily or permanently decommission or replace devices, or they can be unavailable due to faults, maintenance or other restrictions in the area where they are located.
London has seen the greatest total growth in device numbers, increasing 16.7% from last quarter, corresponding to an additional 1,025 devices. This accounted for more than 50% of new available devices in the last quarter, further inflating geographical disparities in UK charging provision. Conversely device growth in Northern Ireland has been lowest, with public devices increasing by 2.2%, followed by the North East with a growth of 4.1%.
Available rapid devices numbers have increased across all of Great Britain, with East Midlands having the largest growth of 14.9%, whilst the South West had a growth of 4.4%. Meanwhile, there has been no change in rapid devices for Northern Ireland.
Background notes and limitations of data
This is a quarterly statistical release on electric vehicle charging devices. We would welcome feedback from users of the statistics. This can be provided via environment statistics.
A charging device is a unit capable of charging the batteries of plug-in electric vehicles. Devices are classified by their power output, and each device may offer one or more connecting points. The term ‘chargepoint’ is also sometimes used, including in previous statistical publications from the Department for Transport. This may refer to either a single device or a number of connectors on a device which can be used simultaneously.
Charging device location data is sourced from the electric vehicle charging platform Zap-Map and represents devices reported as operational at midnight, 1 April 2021. Zap-Map reports that they cover 95% of publicly accessible devices. True counts are therefore likely to be higher and we have no way of assessing whether data coverage is better in some geographical areas than others.
There are no other sources with such comprehensive coverage against which we could verify the Zap-Map devices. As of 30 April 2021, the National Chargepoint Registry (NCR) covers 14,649 devices so cannot be used to verify the Zap-Map counts. The National Chargepoint Registry, whilst covering fewer devices, does contain more detailed information on each charging device including the exact location and number of connectors.
‘Total devices’ represent publicly available charging devices at all speeds, including: slow, fast, rapid and ultra-rapid devices.
‘Rapid devices’ are those whose fastest connector is rated at 43kW and above.
A device can have several connectors of varying types and speeds. Some devices can charge only one vehicle at once, whilst others can charge multiple simultaneously. The Zap-Map data does not indicate how many cars can be charged by a single device, therefore the statistics count the device itself. There is often more than one device at a location. Charging capability in any given location (the number of cars able to be charged at the same time) will be higher than the number of devices.
Population figures by local authority are sourced from the Office for National Statistics Population Mid Year Estimates for 2019. The local authority administrative geographies are from April 2020, available from the ONS Geography Portal.
Data after July to September 2019 reflects charging devices which were available at the end of each quarter. Data previous to this uses charging devices which were available at July to September 2019, but were installed in previous quarters before this. Subsequently, these figures do not include any devices installed before July to September 2019 that were decommissioned or unavailable at the time.
This quarterly statistical series complements 3 earlier releases presenting statistics on observed usage and charging patterns for electric vehicle charging devices funded under various OZEV schemes:
Experimental Statistics
These quarterly statistics are badged as Experimental Statistics. Users should be aware of the status and cautions of these series, which will vary for each statistic and will be explained within each publication. The statistics are new but still subject to testing in terms of their volatility and ability to meet customer needs. They do not meet the rigorous quality standards of National Statistics, for example with respect to partial coverage. Further details on the limitations of Experimental Statistics can be found at the Office for National Statistics.
We are trialling this compact HTML format for our quarterly publication, and we would like to hear your comments. If you have any feedback on our use of this format, please email Environment Statistics.
Twitter. To hear more about DfT statistical publications as they are released, please follow us on Twitter via @DfTstats.