Electric vehicle charging device grant scheme statistics: July 2022
Published 18 August 2022

© Crown copyright 2022
This publication is licensed under the terms of the Open Government Licence v3.0 except where otherwise stated. To view this licence, visit nationalarchives.gov.uk/doc/open-government-licence/version/3 or write to the Information Policy Team, The National Archives, Kew, London TW9 4DU, or email: psi@nationalarchives.gov.uk.
Where we have identified any third party copyright information you will need to obtain permission from the copyright holders concerned.
This publication is available at https://www.gov.uk/government/statistics/electric-vehicle-charging-device-grant-scheme-statistics-july-2022/electric-vehicle-charging-device-grant-scheme-statistics-july-2022
We are providing this compact HTML format for our quarterly publication and we would like to hear your comments. If you have any feedback on our use of this format, please email Environment Statistics.
About this release
This summary presents experimental statistics on the number of grants awarded for the installation of electric vehicle charging devices in the United Kingdom as of 1 July 2022.
The Office for Zero Emission Vehicles (OZEV) provides grants to support the use of electric vehicles, including the installation of charging devices in the UK. This summary covers statistics on selected grant schemes currently running, including the Electric Vehicle Homecharge Scheme (EVHS), Workplace Charging Scheme (WCS) and the On-Street Residential Chargepoint Scheme (ORCS). This publication also covers the Domestic Recharging Scheme (DRS), the predecessor to the EVHS.
Headline figures
Domestic Charging Devices
As of 1 July 2022:
-
OZEV funded grant schemes (EVHS and DRS) have delivered 368,990 domestic charging devices since 2013
-
the EVHS has funded the installation of 328,657 domestic charging devices
-
the EVHS funded 132,955 device installations since 1 July 2021, this is an increase of 62% compared to the previous 12-month period
Workplace Charging Devices
As of 1 July 2022:
-
the WCS has funded the installation of 31,239 sockets in workplace carparks since the scheme started in 2016
-
the WCS funded 12,881 sockets installations since 1 July 2021, an increase of almost 52% compared to the previous 12-month period
On-Street Residential Devices
As of 1 July 2022:
-
the ORCS has funded 2,869 public charging devices which have been installed across local authorities in the UK
-
228 on-street charging devices were installed after being claimed for by the local authorities in the previous 3 months
-
funding has also been awarded for 9,543 additional ORCS charging devices to be installed in the future
Electric Vehicle Homecharge Scheme (EVHS)
The EVHS provides grant funding for up to 75% of the cost of installing electric vehicle charging devices at domestic properties across the UK. More information on the grant scheme is available. From 1 April 2022, the EVHS is no longer open to new applicants and has been replaced with the EV chargepoint grant. This new grant scheme will be included in the November 2022 publication.
Chart 1 - Cumulative growth of EVHS funded charging devices, October 2014 onwards, UK (Table EVG_01)
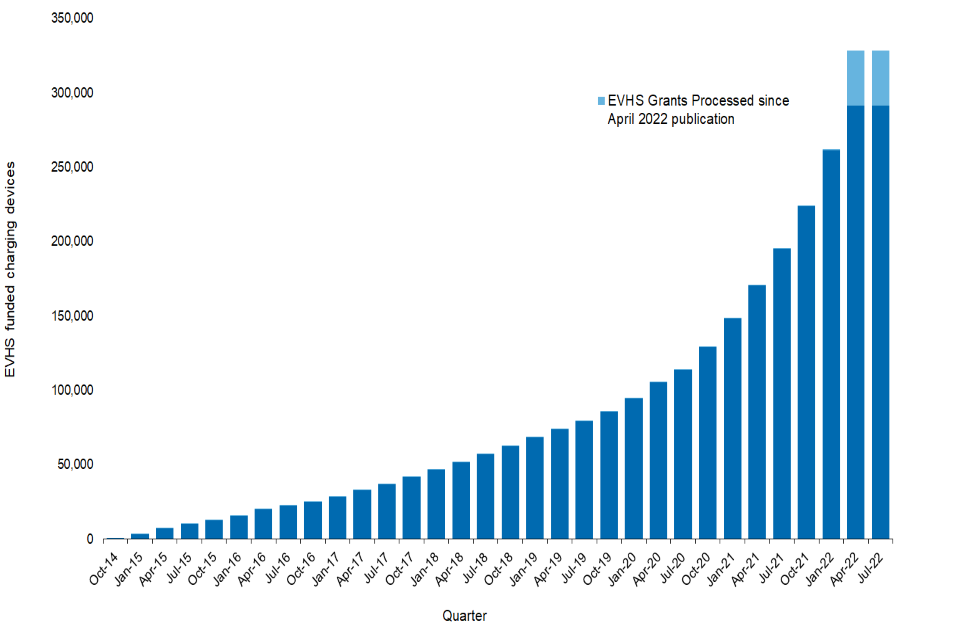
This chart shows the cumulative increase in the number of Electric Vehicle Homecharge Scheme funded charging devices from 2014 to present. As of 1 July 2022, a total of 328,657 domestic charging devices have been installed.
Since September 2014, a total of 328,657 domestic charging devices have been installed under the scheme, with a total grant value of £136.7 million. In the last 12 months the number of EVHS funded charging devices has increased by 132,955, corresponding to an additional £49.72 million in grant value.
These statistics are taken from a database held by DVLA which records grant applications for administrative purposes. Grants can take several months to process and the most recent quarters are likely to be undercounted, especially the second quarter of 2022. The statistics should therefore be treated as provisional.
For example, the number of EVHS installations from January to March 2022 has increased by 37,068 since the last publication, as more applications for that period have been processed.
In addition to the EVHS, the Domestic Recharge Scheme (DRS) has also helped private plug-in vehicle owners offset the upfront cost of the purchase and installation of a dedicated recharging unit. This funded an additional 40,333 domestic charging device installations between 2013 and 2014, before it was replaced by the EVHS. A quarterly breakdown of DRS installations can be found in Table EVG_12.
Together, the EVHS and DRS have contributed to the installation of 368,990 domestic electric vehicle charging devices across the UK as of 1 July 2022.
There is an uneven geographical distribution of EVHS charging devices within the UK. Grant uptake by consumers is likely to be dependent on a variety of factors, including:
-
access to an electric vehicle
-
access to off-street parking
-
leasehold/tenancy properties
-
car ownership
-
rurality
-
income
Maps 1 and 2 - Regional distribution of the total number of EVHS installations and EVHS installations per 100,000 households

Map 1 shows the number of Electric Vehicle Homecharge Scheme funded charging devices in each UK region. Map 2 shows funded devices per 100,000 households in each UK region. Please refer to Annex A: Table 1 for further information.
As Map 1 shows, the South East had the highest number of charging device installations under the EVHS (61,321), accounting for 19% of total devices installed under the scheme. Meanwhile, Northern Ireland had the lowest number of installations with 5,679 EVHS funded charging devices, accounting for just 1.7% of total EVHS funded devices.
As Map 2 shows, the South East also had the highest number (1,663) of EVHS devices per 100,000 households whilst Northern Ireland and London had the lowest with less than 800 devices per 100,000 households.
Further detail on the regional breakdown of EVHS device numbers displayed in Maps 1 and 2 can be found in Annex A.
Table EVG_02 and Table EVG_04 also provides a breakdown of EVHS charging devices and their grant value in each local authority in the UK whilst Table EVG_03 provides a breakdown of charging devices installed in each postcode district.
Workplace Charging Scheme (WCS)
The WCS is a voucher-based scheme designed to provide eligible organisations with support towards the upfront costs of the purchase and installation of electric vehicle charging devices. If an application is successful, applicants are issued with a unique identification voucher, which can then be used to install multiple charging devices. In these statistics, the number of sockets installed is counted as sometimes there is one grant for up to four charging devices in the same workplace carpark. More information on the grant scheme is available.
Chart 2 - Cumulative growth of WCS funded sockets (Table EVG_05)
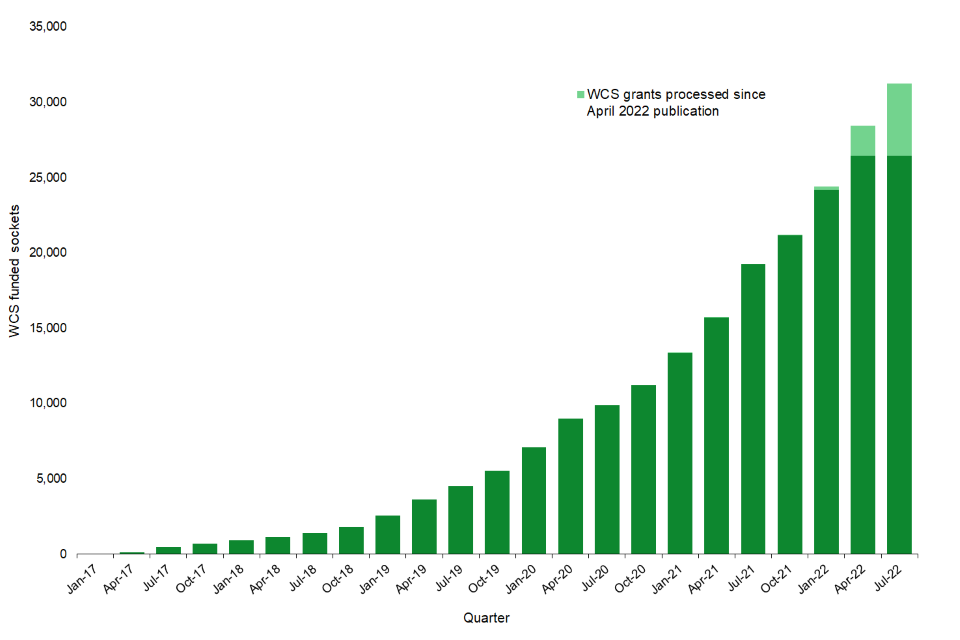
This chart shows the cumulative increase in the number of Workplace Charging Scheme funded sockets from 2016 to present. At the 1 July 2022, a total of 31,239 sockets have been installed.
Since the scheme started in late 2016, a total of 11,561 vouchers have been redeemed accounting for 31,239 sockets installed under the WCS grant. This equated to a total grant value of £12 million.
In the last 12 months, 4,910 vouchers were redeemed, corresponding to the installation of 12,881 sockets. This had a grant value of £4.35 million.
These statistics are taken from a database which records grant applications for administrative purposes. Grants can take several months to process and the most recent quarters are likely to be undercounted. The statistics should therefore be treated as provisional.
Maps 3 and 4 - Regional distribution of total number of WCS socket installations and per 100,000 of population

Map 3 shows the number of Workplace Charging Scheme funded sockets in each UK region. Map 4 shows Workplace Charging Scheme funded sockets per 100,000 of the population in each UK region. Please refer to Annex A: Table 2 for further information.
As Map 3 shows, in terms of regional distribution of WCS sockets, the South East had the highest uptake with 4,558 sockets installed whilst Wales and Northern Ireland had the lowest, 1,134 and 607 respectively. Together, Wales and Northern Ireland accounted for 5.5% of total sockets installed under the WCS in the UK.
When comparing the regional distribution per 100,000 of the population as seen in Map 4, London had the smallest number of WCS installations in the UK with 22 WCS installations per 100,000. Scotland, Wales, and Northern Ireland also had fewer WCS installations than any English region except London.
Further detail on the regional breakdown of WCS socket numbers displayed in Maps 3 and 4 can be found in Annex A.
Table EVG_06 and Table EVG_07 also provides a further breakdown of WCS sockets installed and their grant value in each local authority in the UK.
On-Street Residential Chargepoint Scheme (ORCS)
This scheme is available to all UK local authorities to fund up to 60% of the capital costs of installing on-street residential charging devices to ensure that those without private off-street parking are able to access reliable and affordable charging infrastructure. Until the 1st April 2022, the scheme covered up to 75% of the capital costs of installing on-street residential charging devices. More information on the scheme is available.
Maps 5 and 6 - Distribution of local authorities which have been awarded ORCS funding for the UK and London

Map 5 shows the distribution of councils that have installed and/or applied for charging devices funded by the On-Street Residential Chargepoint Scheme for the whole of the UK. Map 6 shows the same but for London councils.
As of 1 July 2022, the ORCS has funded the installation of 2,869 public charging devices since the scheme was established in 2017. This represents £10.2 million of grant funding across 95 councils. The details of which can be found in Table EVG_08 and Table EVG_09. An additional 228 on-street devices were recorded as installed in the previous 3 months.
Of the councils that have already completed installations, 27 have had further funding awarded to install a further 2,201 charging devices with a grant value of £9.8 million.
A further 80 local authorities have also been awarded grant funding, providing 7,342 on-street public charging devices with their installations yet to be completed. This represents a grant value of £23.4 million.
A table of councils which have applied for this funding can be found in Table EVG_10 and Table EVG_11 and shown for the UK and London in Maps 5 and 6.
As announced in the UK EV Infrastructure Strategy, the scheme would continue into the 2022 to 2023 financial year with a £20 million budget.
Current levels of public charging provision by local authority area can be found in the public electric vehicle charging devices statistics which are published quarterly. These will include the ORCS funded charging devices.
Background notes and limitations of data
This is a quarterly statistical release on electric vehicle infrastructure grant data. We welcome feedback from users of the statistics. This can be provided by emailing environment statistics.
These statistics are taken from databases which record grant applications for administrative purposes. In some cases, grants can take several months to process with the most recent quarter likely to be undercounted both for the EVHS and WCS. These statistics should therefore be treated as provisional. For example, the number of EVHS installations from January to March 2022 has increased by 37,068 since the last publication, as more applications for that period have been processed.
The ORCS grants are offered to successful applicants, but funds are only released upon final completion of information. Charging devices are only counted as installed when they have been installed and claimed for by the local authority.
The total number of domestic and workplace charging devices installed in the UK is likely to be different to the figures provided in this report as there is no requirement to register a privately funded charging device with the Government. We are also unable to confirm if the charging devices installed under the schemes are still operational. In addition, chargepoint manufacturers have to be approved by OZEV with some choosing not to be part of the grant schemes:
In addition, these statistics present data on selected OZEV schemes which are currently running. OZEV offers a range of other support for the take-up of plug in vehicles, including further targeted schemes providing funding to support chargepoint infrastructure across the UK. More information can be found on the OZEV website.
Population figures by local authority are sourced from the Office for National Statistics Population Mid-Year Estimates for 2020. Household figures by local authority are sourced from the Office for National Statistics Estimated Number of Households in the UK in 2018. The local authority administrative geographies are from April 2021, available from the ONS Geography Portal.
The quarterly statistical series complements 3 earlier releases presenting statistics on observed usage and charging patterns for electric vehicle charging devices:
The Department for Transport also publishes statistics on publicly available electric vehicle charging devices.
Experimental Statistics
These quarterly statistics are badged as Experimental Statistics. Users should be aware of the status and cautions of these series, which will vary for each statistic and will be explained in each publication. The statistics are new but still subject to testing in terms of their volatility and ability to meet customer needs.
They do not necessarily meet the rigorous quality standards of National Statistics, for example with administrative data. Further details on the limitations of Experimental Statistics can be found at the Office for Statistics Regulation.
Twitter. To hear more about DfT statistical publications as they are released, please follow us on Twitter via DfTstats.
Annex A: EVHS and WCS Regional Table
Table 1 - EVHS Total Devices and Devices per 100,000 Households per Region (Maps 1 and 2)
As of 1 July 2022:
| Region | EVHS Total Devices | EVHS Devices per 100,000 Households |
|---|---|---|
| United Kingdom | 328,657 | 1,212 |
| North East | 12,828 | 1,115 |
| North West | 35,315 | 1,151 |
| Yorkshire and the Humber | 26,363 | 1,152 |
| East Midlands | 26,780 | 1,612 |
| West Midlands | 29,169 | 1,228 |
| East of England | 36,638 | 1,437 |
| London | 25,247 | 737 |
| South East | 61,321 | 1,663 |
| South West | 29,014 | 1,242 |
| Wales | 12,253 | 909 |
| Scotland | 24,705 | 999 |
| Northern Ireland | 5,679 | 756 |
| Unknown | 3,345 | - |
Table 2 - WCS Total Sockets and Devices per 100,000 Population per Region (Maps 3 and 4)
As of 1 July 2022:
| Region | WCS Total Sockets | WCS Sockets per 100,000 Population |
|---|---|---|
| United Kingdom | 31,239 | 47 |
| North East | 1,394 | 52 |
| North West | 3,585 | 49 |
| Yorkshire and the Humber | 3,293 | 60 |
| East Midlands | 2,900 | 60 |
| West Midlands | 3,181 | 53 |
| East of England | 3,954 | 63 |
| London | 1,956 | 22 |
| South East | 4,558 | 49 |
| South West | 2,769 | 49 |
| Wales | 1,134 | 36 |
| Scotland | 1,908 | 35 |
| Northern Ireland | 607 | 32 |
Next Update
Quarterly electric vehicle charging device grant scheme statistics will be released in November 2022.
Instructions for printing and saving
Depending on which browser you use and the type of device you use (such as a mobile or laptop) these instructions may vary.
Tablets and mobile devices normally have the option to “find in text” and “print or save” in their sharing or quick options menu of their browser, but this will vary by device model.
How to search
Select Ctrl and F on a Windows laptop or Command and F on a Mac
This will open a search box in the top right-hand corner of the page. Type the word you are looking for in the search bar and press enter.
Your browser will highlight the word, usually in yellow, wherever it appears on the page. Press enter to move to the next place it appears.
Contact details
Transport energy and environment statistics
Email environment.stats@dft.gov.uk
Media enquiries 0300 7777 878