Economic labour market status of individuals aged 50 and over, trends over time: September 2020
Updated 19 November 2020

© Crown copyright 2020
This publication is licensed under the terms of the Open Government Licence v3.0 except where otherwise stated. To view this licence, visit nationalarchives.gov.uk/doc/open-government-licence/version/3 or write to the Information Policy Team, The National Archives, Kew, London TW9 4DU, or email: psi@nationalarchives.gov.uk.
Where we have identified any third party copyright information you will need to obtain permission from the copyright holders concerned.
This publication is available at https://www.gov.uk/government/statistics/economic-labour-market-status-of-individuals-aged-50-and-over-trends-over-time-september-2020/economic-labour-market-status-of-individuals-aged-50-and-over-trends-over-time-september-2020
The latest release of these statistics can be found in the collection of economic labour market status of individuals aged 50 and over statistics.
Impact of changes made to the Labour Force Survey
A revised version of these statistics was published on 19 November 2020.
As a result of the coronavirus (COVID-19) pandemic, the source behind these official statistics (the Labour Force Survey) was forced to switch from face-to-face to telephone interviewing methods. Subsequently, the Office for National Statistics (ONS) has found that the data collected in this period is not fully representative of all households. To rectify this, the data has been re-weighted and revised statistics have been published.
Read further details about coronavirus and its impact on the Labour Force Survey on the ONS website.
This publication details the trends over time in the economic labour market status of individuals aged 50 and over. Analysis is provided on the 3 headline measures announced in the Fuller Working Lives (FWL) Strategy 2017 that the government use to monitor progress on FWL:
- Employment rate of 50 year olds and over, by 5-year age bands and gender.
- Average age of exit from the labour market, by gender.
- Employment rate gap between 50 to 64 year olds and 35 to 49 year olds, broken down by 5-year age band and gender.
This is an annual release and the next release will be in September 2021.
1. Introduction
The UK has an ageing population and workforce. It is therefore of growing importance to understand the economic labour market status of individuals approaching, at and above State Pension age (SPa) and how trends are changing over time.
The coronavirus (COVID-19) pandemic continues to impact the UK labour market, and the statistics in this release should be interpreted in the context of COVID-19. Please see the What you need to know section for more details.
2. Main stories
The main stories are:
- the average age of labour market exit has increased over the past 2 decades. In 2000 the average age of exit for men was 63.3 years old, increasing to 65.2 years old in 2020, an increase of 1.9 years. Over the same time period, in 2000 the average age of exit for women was 61.2 years old, increasing to 64.3 years old in 2020, an increase of 3.1 years
- 50+ employment rates have increased over time. The working age 50 to 64, employment rate increased from 55.8% in 1984 to 72% in 2020. For those aged 65 and over, the employment rate increased from 4.9% in 1984 to 10.4% in 2020
- the employment rate gap between 50 to 64 and 35 to 49 year olds is closing. In 1984 the employment rate gap between 50 to 64 and 35 to 49 years olds was 20.9 percentage points, this has gradually narrowed to 13.2 percentage points in 2020
3. What you need to know
This is the fifth annual publication on the economic labour market status of individuals aged 50 and over. It provides more detailed breakdowns of the labour market outcomes of older workers over time than those routinely published by the Office for National Statistics (ONS) in their monthly Labour Market Statistics. Previous versions of this publication can be found in the collection of Economic labour market status of individuals aged 50 and over statistics.
This release also includes additional analysis and breakdowns, to provide a fuller picture of the economic status of people aged 50 and over.
When interpreting results, particularly comparing time periods, users should be aware of the potential effect of the coronavirus (COVID-19) pandemic.
This release covers April to June 2020 – the impact of COVID-19 on the main labour market measure of economic status is currently limited. To assist users in interpreting the statistics in this release, additional time points for the periods January to March 2019 and January to March 2020 have been added to the time series tables.
Main coronavirus (COVID-19) dates and the Labour Force Survey count dates, UK

Source: ONS Labour Market Overview, UK: August 2020
HM Revenue and Customs (HMRC) Official Statistics showed that, at end of June 2020, 9.4 million jobs had been furloughed through Coronavirus Job Retention Scheme (JRS), representing 31% of eligible employments. Amongst 50 to 64 year olds, 2.2 million jobs had been furloughed, representing 27% of eligible employments.
Also to end of June 2020, Self-Employment Income Support Scheme (SEISS) Official Statistics, show that 2.6 million claims had been made, with 0.5 million of these amongst 55 to 64 year olds.
Additional analysis does indicate an emerging impact of COVID-19 in the April to June 2020 period.
The Office for National Statistics (ONS) have published analysis on homeworking – this showed that, as at April 2020, 46.6% of people in employment were doing some work at home; specifically for 50 to 64 year olds, this was 42%
Further analysis published by the ONS gives an indication of people temporarily away from work. It showed that 2.1 million 50 to 64 year olds reported that they were temporarily away from work in the April to June 2020 period. This compares to 0.7 million in the same period one year earlier. Within 5 year age bands, people aged 55 to 59 (23.2%) and 60 to 64 (28.7%) were more likely to be temporarily away from work than all other ‘working age’ age bands apart from 16 to 19 (38.7%) and 20 to 24 year olds (26.6%).
The Labour Market Overview published by ONS shows that between January to March 2020 and April to June 2020, total actual weekly hours worked in the UK decreased by a record 191.3 million, or 18.4%, to 849.3 million hours. This was the largest quarterly decrease since estimates began in 1971, with total hours dropping to its lowest level since September to November 1994.
Recent trends in employment should also be considered in the context of changes to State Pension age (SPa). Since 2010, female SPa gradually increased from 60 years, rising to 65 years old by November 2018, at which point it equalled male SPa. By October 2020, SPa for both males and females will increase to 66 years, then to 67 years by 2028. The 2017 SPa Review outlined a planned increase in SPa to 68 years by the period 2037 to 2039.
Detailed statistics used in this release are in the data tables published with this release.
4. Average age of exit from the labour market
The average age of exit from the labour market is broken down for men and women due to the historic difference of state pension age for men and women. See What you need to know for further details.
Average age of men exiting from the labour market, 1950 to 2020, UK
In 1950, the average age of exit of men was 67.2 years old. The average age of exit for men fell until 1980, in which year there was a change to the data source, details to the change can be found in the background information and methodology.
In 2020, the male average age of exit from the labour market was 65.2 years old, compared to 65.3 years in 2019.
The male average age of exit has increased by 2.2 years since 1996 when it reached its lowest point at 63 years old.
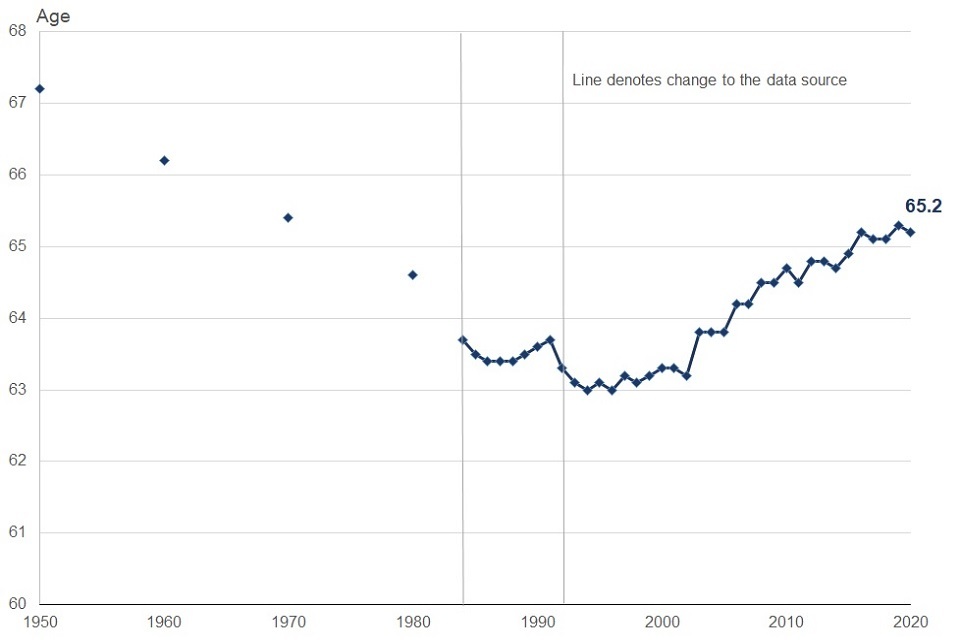
Source: Table 1 Economic Labour Market Status of individuals aged 50 and over statistics.
Average age of women exiting from the labour market, 1950 to 2020, UK
The average age of exit for women in 1950 was 63.9 years old. It fell and reached its lowest point in 1986 at 60.3 years old. Since then, the average age of exit for women has increased by 3.9 years to 64.3 years old in 2020, with no change from 2019.
Between 2009 (before the change to female SPa) and 2014, when female SPa increased to 62, the average age of exit increased by 0.7 years to 63.1 years. It has increased by a further 1.2 years to 64.3 years old in 2020, during which time female SPa increased to 65 years old in November 2018.
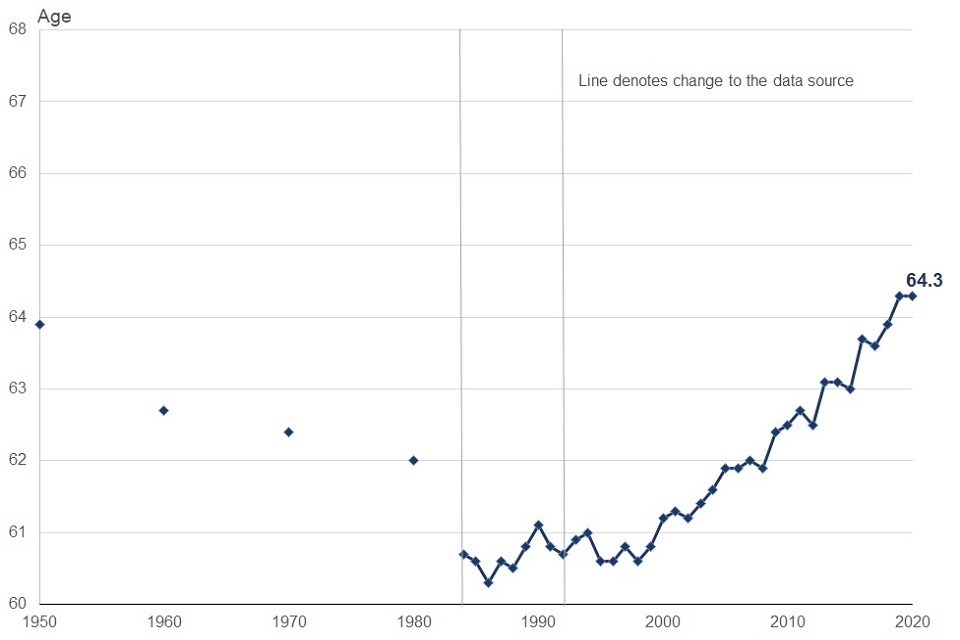
Source: Table 1 Economic Labour Market Status of Individuals aged 50 and over statistics.
5. Employment rate and level
The employment rate for 50 to 64 year olds was 72% in the April to June 2020 period. This rate has been increasing steadily since the mid-1990s, when it stood at 57.2% in 1995. There has been no significant change in the employment rate over the past year.
The gap between the employment rate of 50 to 64 year olds and 35 to 49 year olds was 13.2 percentage points in the April to June 2020 period – the gap was 12.8 percentage points in April to June 2019 period. This slight widening of the gap is driven by a widening of the gap for women – up by 1.6 percentage points over the past year.
Employment rates of 35 to 49 and 50 to 64 year olds, UK
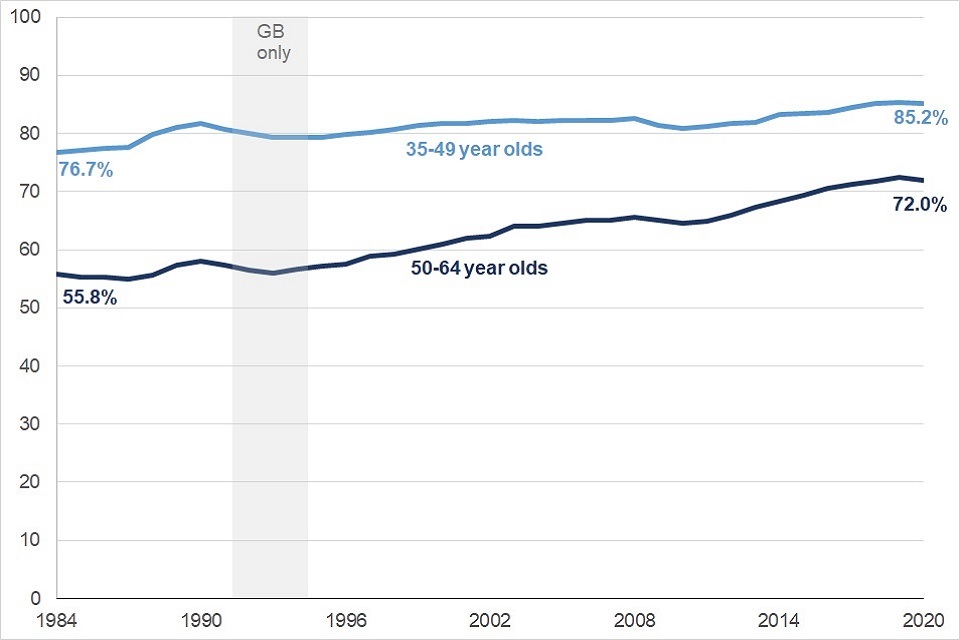
Source: Table 2 Economic Labour Market Status of individuals aged 50 and over statistics.
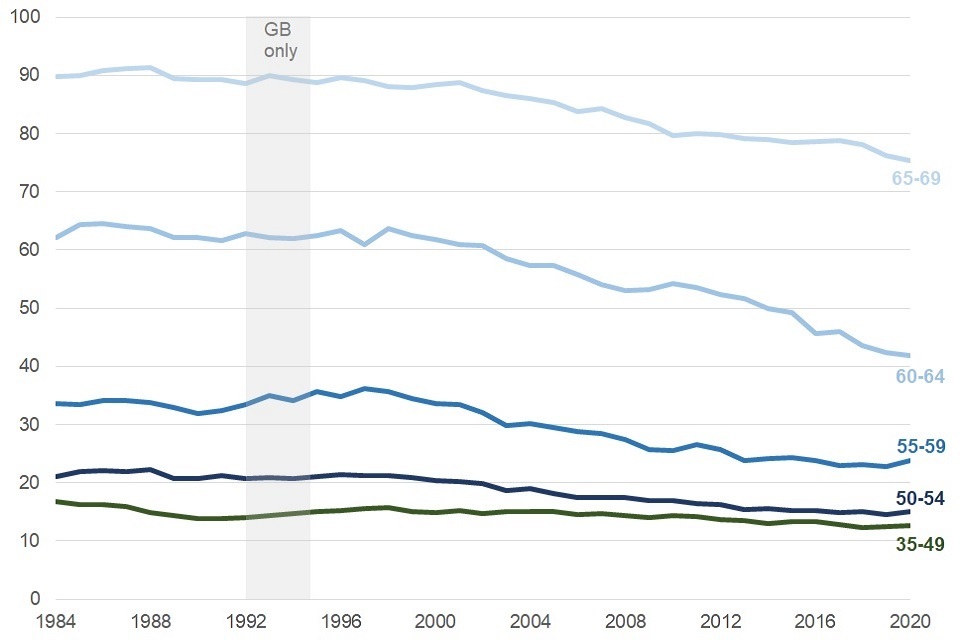
Over the past 10 years, the employment rates for each of 5-year age bands 50 to 54, 55 to 59, and 65 to 69 have shown very gradual upward trends. For 60 to 64 year olds the increase has been much more marked, both amongst males and females.
Older workers, aged 50 to 64, are more likely to be working part time than workers aged 35 to 49. Whereas, the proportion of 35 to 49 year olds working part time has remained broadly steady, the proportion of 50 to 64 year olds working part time has increased since 1995.
Full-time and part-time employment rates, UK
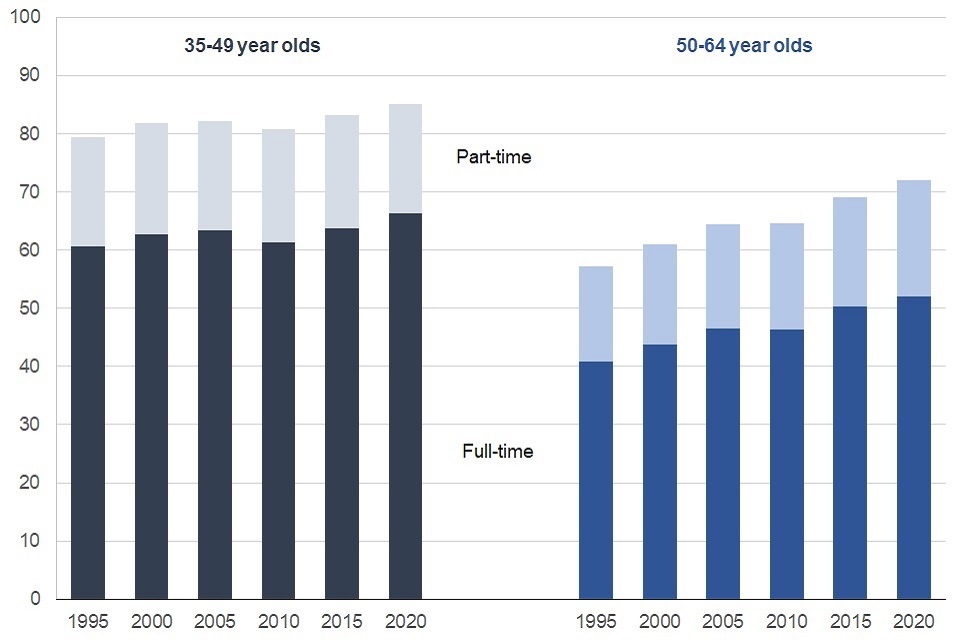
Source: Table 4 Economic Labour Market Status of individuals aged 50 and over statistics.
The proportion of 60 to 64 year olds in full-time employment has risen by 4.5 percentage points compared to the same period in 2015, with one in three 60 to 64 year olds now in full-time employment (34.5%).
Women aged 50 and over are considerably more likely to be in part-time employment compared to men of the same age. Between 50 and 54, women are 5 times as likely to be employed part-time but by the time they reach the age of 60 to 64, this reduces to twice as likely as higher proportions of men move into part-time work.
Full-time and part-time employment for those aged 65 and over has increased at a steady, constant rate since 1995. The biggest increases are females in part-time employment (3.4 percentage points) and males in full-time employment (3.3 percentage points).
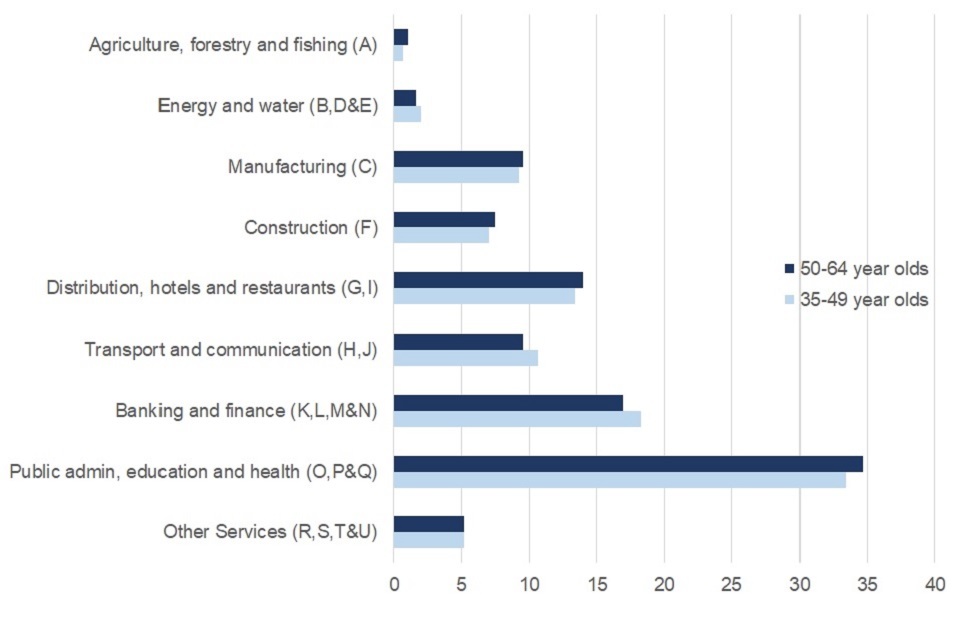
Employment rates of 35 to 49 and 50 to 64 year olds by industry sector, April to June 2020
Workers aged 50 to 64 have a broadly similar distribution amongst industry sectors to those aged 35 to 49. Older workers are most prevalent in the public admin, education and health sectors with over one in three older workers employed in this sector. The same is true for the 35 to 49 age group.
The sector with the lowest proportion of both age groups is the agriculture, forestry and fishing sector, though this is the only sector where older workers have a higher employment level than 35 to 49 year olds.
More than half (51.4%) of female workers aged 50 to 64 are employed in the public admin, education and health sectors, with another 30.3% of older female workers in the distribution, hotels and restaurants industries, or banking and finance.
In comparison, older males have a more even distribution across all industry sectors, with public admin, education and health again the most prevalent but at 19.2%, or just under one in five older men.
Men aged 50 to 64 are twice as likely as women to be employed in agriculture, forestry and fishing, are almost three times as likely as women to be employed in manufacturing, and are more than 4 times as likely as women to be employed in the construction, transport and communication sectors.
Source: Table 13 Economic Labour Market Status of Individuals aged 50 and over statistics.
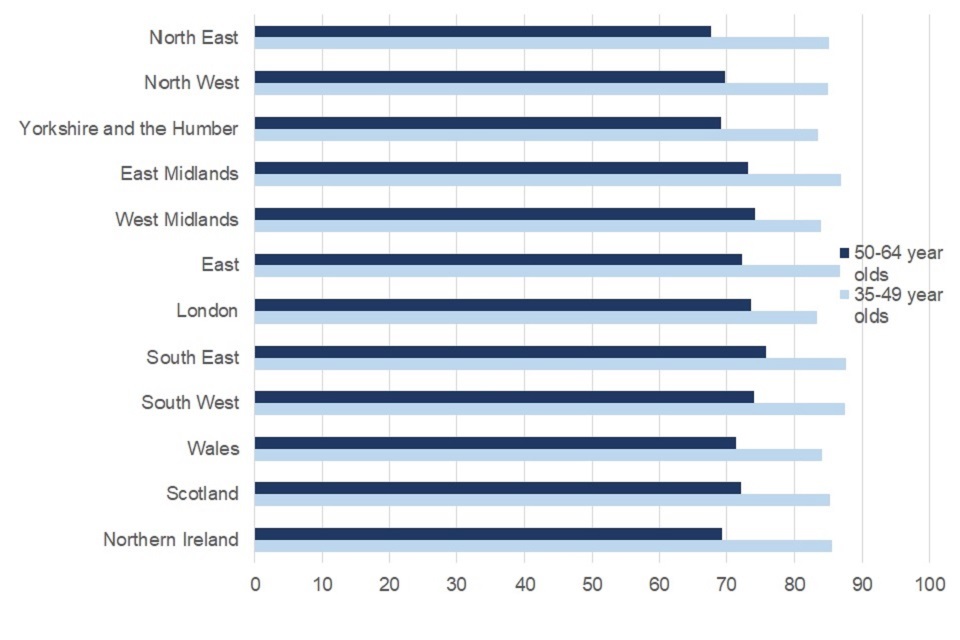
Employment rates of 35 to 49 and 50 to 64 year olds by region, April to June 2020, UK
Northern Ireland has the lowest employment rate for 50 and 64 year olds at 69.3%, compared to 73.6% for England. However, the employment rate for 50 to 64 year olds in Northern Ireland is not significantly different to that in Wales and Scotland.
Amongst the English regions, the South East has the highest employment rate for 50 to 64 year olds at 75.8%, while the North East has the lowest at 67.7%.
Although all regions have seen changes in the employment rate between 2019 and 2020, these changes are not statistically significant with the exception of the East of England, which saw a fall in the employment rate amongst 50 to 64 year olds of 3.8 percentage points.
There is variation in the employment rate gap between 35 to 49 year olds and 50 to 64 year olds across regions and countries. The lowest gaps are in London and the West Midlands (9.5 percentage points), whilst the North East has the largest gap (17.3 percentage points).
Source: Table 14 - Economic Labour Market Status of individuals aged 50 and over statistics.
6. Economic inactivity rate and level
The economic activity rate for the overall 50 to 64 year old age group was 26% between April to June 2020. This rate has generally been falling steadily since 1986, when it stood at 40.3%.
Economic inactivity of older people, UK
Source: Table 6 Economic Labour Market Status of individuals aged 50 and over statistics.
Since 2000, the largest percentage point decrease in economic inactivity rates, for the 5-year age bands, has occurred for females aged 60 to 64 (down by 26.7 percentage points); this corresponds with the increases in employment rates over this time period.
In the period April to June 2020, there were 571,000 people aged 50 to 64 who were economically inactive but were willing or would like to work:
- 274,000 were male
- 297,000 were female
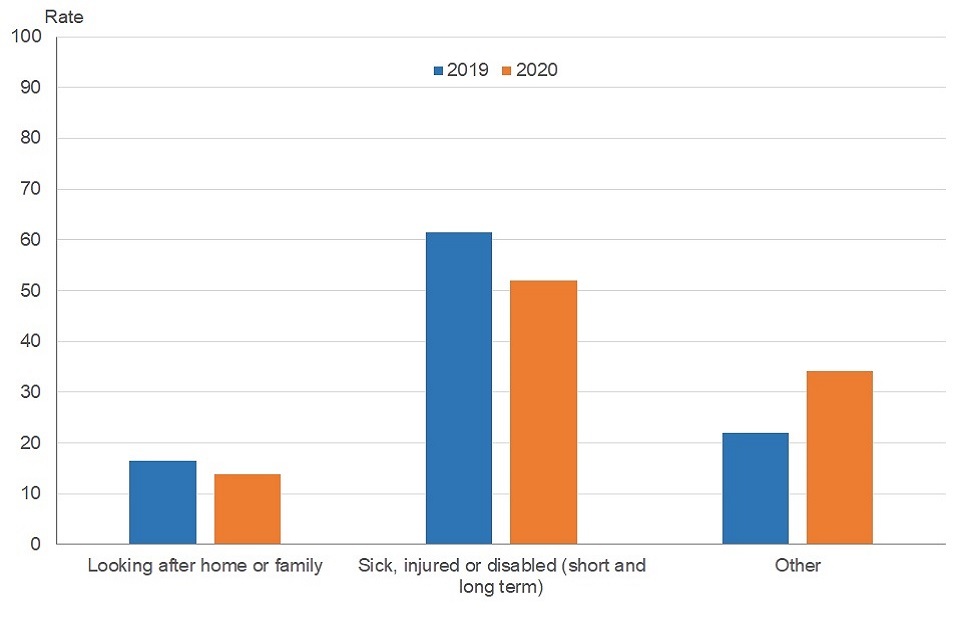
Reasons for not looking for work, individuals aged 50-64 who are inactive but are willing or would like to work, UK
About half of the 571,000 people who were economically inactive but willing or would like to work gave the reason for not looking for work as ‘being sick, injured or disabled’ (52%).
‘Looking after home or family’ was given as a reason by 13.8%, and over a third (34.1%) gave a reason of ‘Other’ – this has increased from 22% in comparison to the same period in 2019. It is possible that the impact of the COVID-19 pandemic has driven this increase.
Source: Table 12 Economic Labour Market Status of individuals aged 50 and over statistics.
7. Unemployment rate and level
The unemployment rate for 50 to 64 year olds follows a similar overall trend to the rate for 35 to 49 year olds, with both rates tracking very closely since 2014.
The latest unemployment rate of 2.6% for 50 to 64 year olds has remained the same over the latest year.
Unemployment rate for 35 to 49 and 50 to 64 year olds, 1984 to 2020, UK
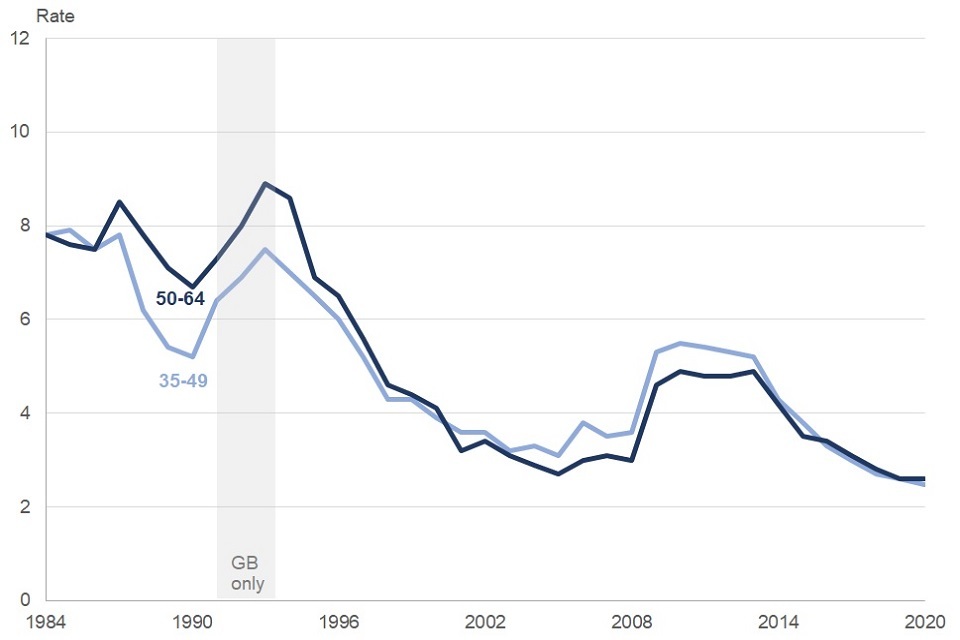
Source: Table 8 Economic Labour Market Status of individuals aged 50 and over statistics.
In the early 1990s, the unemployment rate for men aged 50 to 64 was about 6 percentage points higher than the rate for women aged 50 to 64. This difference started to narrow, but fluctuate, from mid 1990s. For the latest period, April to June 2020, the unemployment rate for men aged 50 to 64 was 0.8 percentage points higher than the rate for women aged 50 to 64.
Reason for leaving last job, people aged 50 to 64 who are not in work, UK
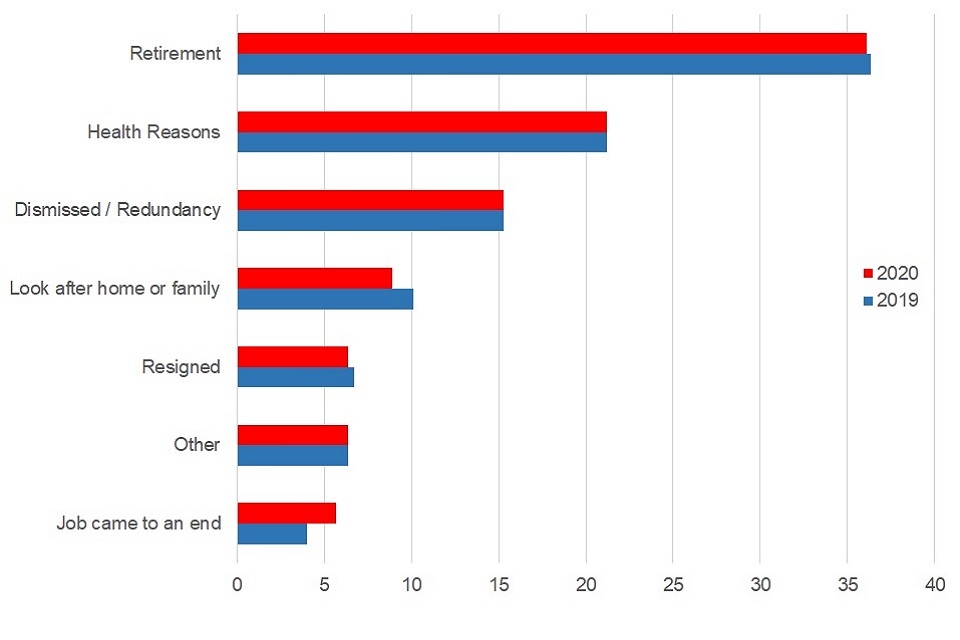
Source: Table 15 Economic Labour Market Status of individuals aged 50 and over statistics.
Of the 2.1 million 50 to 64 year olds who were not in work in the period April to June 2020 and who had left their last job at some point in the last eight years, over one third (36.1%) gave a reason for leaving their last job as ‘retirement’. ‘Health’ is the second largest reason given at 21.2 per cent, the same as in 2019. Since 2019 there has been a slight fall in ‘looking after home or family’ (from 10.1 per cent to 8.9 per cent) as a reason.
8. About these statistics
These Official Statistics have been compiled using data from the Labour Force Survey (LFS) which is produced by the Office for National Statistics (ONS), and they follow the same definitions used in their Labour Market Statistics bulletin. They have been developed using guidelines set out by the UK Statistics Authority. They continue to be badged as Experimental Official Statistics and include average age of exit from the labour market and in depth statistics on the employment rate gap between 50 to 64 year olds and 35 to 49 year olds. These align with the 3 headline FWL measures announced in the FWL Strategy 2017. The methodology of using static average age of exit will be considered for future iterations of this release. Users are invited to comment on the development and relevance of these statistics at this stage.
Statistical significance
Statistical significance is a technical concept that states whether or not an estimated value is likely to have arisen only from random variations in the sampling. It is most often used when talking about a change or a difference: a significant change or difference is one that is not likely to be due only to the sampling, and therefore is likely to be a real change or difference. Plotting estimates and their confidence intervals (a measure of the uncertainty of an estimate) gives an indication of whether or not a difference is significant. If the confidence intervals of two estimates do not overlap, the estimates are significantly different.
Changes in levels or rates that have been highlighted in the text of this release are statistically significant at the 95% level, unless stated.
Where to find out more
For more information on the LFS see the background information and methodology document released alongside these statistics.
Read more information on the LFS on the ONS website.
Contact information and feedback
The Department for Work and Pensions (DWP) would like to hear your views on these statistics. We would be interested in hearing what you use them for and how well they meet your requirements as well as interest in extending the analyses to fuller working lives. Feedback and queries about the statistics by e-mailing fwl.analysisteam@dwp.gov.uk
Press enquiries should be directed to the DWP Press Office: 020 3267 5144
Lead Statistician: Michael Payne