DCMS Sector Economic Estimates: Employment, January 2025 to December 2025
Published 16 July 2026

© Crown copyright 2026
This publication is licensed under the terms of the Open Government Licence v3.0 except where otherwise stated. To view this licence, visit nationalarchives.gov.uk/doc/open-government-licence/version/3 or write to the Information Policy Team, The National Archives, Kew, London TW9 4DU, or email: psi@nationalarchives.gov.uk.
Where we have identified any third party copyright information you will need to obtain permission from the copyright holders concerned.
This publication is available at https://www.gov.uk/government/statistics/economic-estimates-employment-january-2025-to-december-2025-for-dcms-sectors/dcms-sector-economic-estimates-employment-january-2025-to-december-2025
1. Background:
- Release date: 16 July 2026
- Next release: Summer 2027
- Geographic coverage: United Kingdom and ITL1 regions
- Time coverage: 2011 to 2025
- Responsible analyst: Nicholas Hamilton Wu
This publication provides an update on the DCMS workforce based on the latest 2025 data provided by the Office for National Statistics (ONS) Annual Population Survey (APS). This release includes new estimates of employment (number of filled jobs) in the included DCMS sectors for the 2025 calendar year (January to December), as well as new 2024 estimates and revised 2022 and 2023 estimates for tourism and DCMS sectors overall. A full time series from 2011 to 2025 is available in the accompanying data tables.
Due to ongoing challenges with response rates, response levels and weighting, the accreditation of ONS statistics based on Annual Population Survey (APS) was temporarily suspended on 9 October 2024. On 4 August 2025, the Office for Statistics Regulation (OSR) temporarily suspended the accreditation from this employment series, at our request, following ONS reporting concerns with the quality of estimates for smaller segments of the APS population, which the DCMS Sector Economic Estimates: Employment series depends on. For further information on the data quality challenges, see the associated technical report.
We are classifying these estimates as official statistics in development until further review. In addition to this, in the data tables we have included data on:
- coefficients of variation to indicate the level of statistical robustness for each employment estimate for 2024 and 2025.
- confidence intervals to indicate the amount of uncertainty around each employment estimate for 2024 and 2025.
- confidence intervals for total number of filled jobs in DCMS sectors (excluding tourism) for each year from 2011 to 2025 to enable users to compare whether changes over time are statistically significant.
We advise users to use this accompanying data when interpreting DCMS sector employment estimates, particularly for more granular breakdowns such as subsector estimates and demographic breakdowns.
The APS enables us to estimate multiple demographic breakdowns of employment for the DCMS sectors. The demographics reported here focus on breakdowns by region, sex (male and female), disability (reported as disabled people and non-disabled people, as defined under the 2010 Equality Act) and ethnicity. The published tables contain more information, including breakdowns by age, nationality, highest level of education and working pattern (full-time or part-time).
As part of this release, we are publishing an updated list of creative occupations, based on the latest Standard Occupational Classification (SOC) framework (SOC 2020). This was completed following recommendations from an independent expert panel. This updates the creative occupations list to the latest SOC framework SOC 2020 from the previous SOC 2010 list. Further information about the process to update the creative occupations list is available in the Creative Occupations Update Note, published alongside this release.
Using this list, we are also publishing updated estimates for the number of creative occupations both within and outside the creative industries. The total filled jobs estimate for the creative industries plus the estimate of creative occupations outside the creative industries produces the estimate for the creative economy. These estimates were previously published as part of the DCMS Sectors Economic Estimates: Employment series using the list of creative occupations defined using the previous iteration of the classification, SOC 2010.
2. Sectors
The estimates reported here cover employment in sectors for which DCMS is responsible:
- Civil society
- Creative industries
- Cultural sector
- Gambling
- Sport
- Tourism (data available up to 2024)
For details of each sector’s definition, see the associated technical report.
Please note data for the Tourism sector is available up to 2024 only because 2025 estimates from the ONS’s Tourism Satellite Account are yet to be published.
The data tables also include estimates for the audio visual sector, computer games subsector, and arts and antiques market, which we have published alongside this report.All figures in the data tables for the number of filled jobs are rounded to the nearest thousand (with exception of those less than 1,000).
3. DCMS sectors (excluding Tourism):
As of the 2025 calendar year, there were a total of 4.2 million filled jobs in the included DCMS sectors, representing 12.1% of total filled jobs. This is an increase of 555,000 filled jobs compared to pre-pandemic 2019 (up 15.4%). For context, in the UK economy as a whole, filled jobs have increased by 2.7% since 2019.
Tourism data is available up to 2024 and provisional estimates show that there were 4.9 million filled jobs in DCMS sectors overall (incl tourism) in 2024, 14.3% of UK total filled jobs.
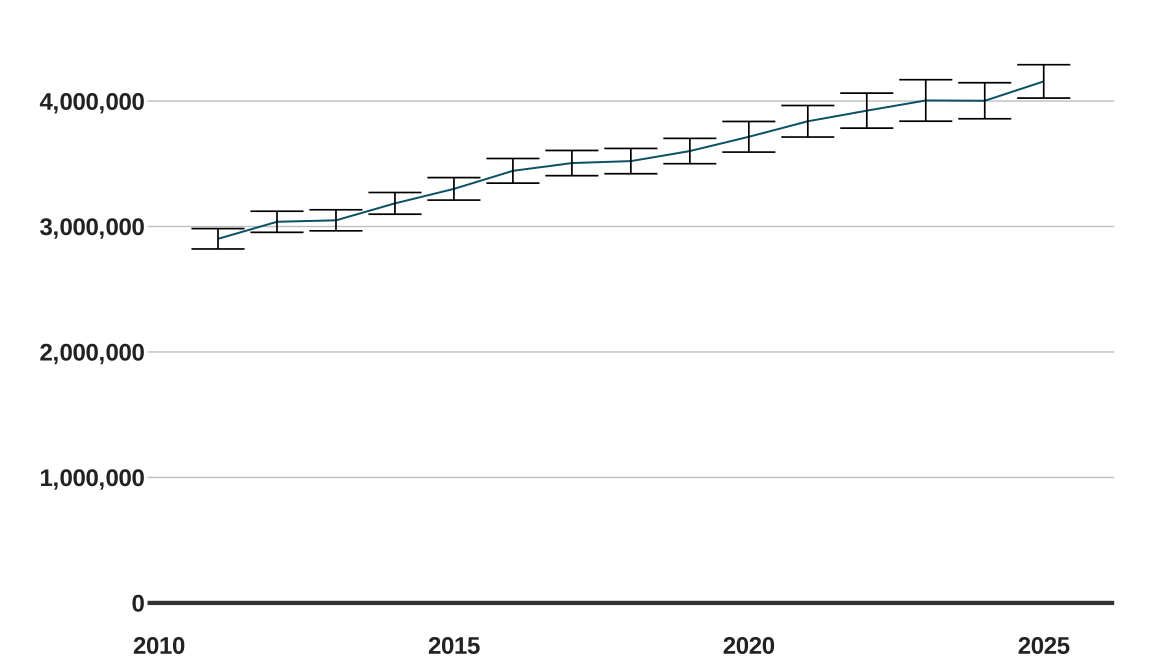
Figure 1: Employment (filled jobs) in the included DCMS sectors with confidence intervals, UK, 2011 to 2025.
Figure 1 shows that the number of filled jobs in the included DCMS sectors has increased since 2011. In 2025, the number of filled jobs in included DCMS sectors was 43.2% higher than in 2011 and 15.4% higher than in 2019. Figure 1 also shows an increase in the size of confidence intervals, particularly since 2019, indicating a decrease in the certainty of employment estimates for DCMS sectors. This is linked to the falling sample size of the underlying ONS APS data source.
Table 1 shows the number of filled jobs in each included DCMS sector in 2025, and the change since 2024, 2019 and 2011, where these changes are statistically significant. Compared to 2019, there were more filled jobs in the creative industries, cultural sector, and civil society sectors in 2025. The creative industries, the largest included DCMS sector, had the largest absolute growth (363,000), driving the overall increase for included DCMS sectors. Changes in the number of filled jobs in the sport sector and gambling between 2019 and 2025 were not statistically significant.
Compared to 2024, there were no statistically significant changes in the included DCMS sectors overall or individually in 2025.
Table 1: Filled jobs in the included DCMS sectors 2025, with statistically significant changes from 2024, 2019, and 2011.
| # Statistically Significant Changes |
| Sector (Due to overlaps, sectors do not sum to DCMS total) | Filled jobs: 2025 (Latest estimate) | Change since 2024 (previous calendar year estimate) | Change since 2019 (pre-pandemic) | Change since 2011 (earliest available data) |
|---|---|---|---|---|
| All UK Sectors | 34,457,000 | - | +2.7% | +14.4% |
| Incl. DCMS Sectors | 4,157,000 | - | +15.4% | +43.2% |
| Creative Industries | 2,464,000 | - | +17.3% | +57.8% |
| Civil Society | 1,083,000 | - | +20.7% | +40.6% |
| Cultural Sector | 762,000 | - | +12.7% | +39.8% |
| Sport | 584,000 | - | - | +18.8% |
| Gambling | 75,000 | - | - | - |
Key: “ - “ indicates that a change is not statistically significant.
3.1 Regional Breakdowns
Overall, filled jobs in the included DCMS sectors are more concentrated in London compared to the UK economy as a whole, with 24.4% of filled jobs in the included DCMS sectors in London in 2024, compared to 15.9% for the UK economy overall. However, this varies by sector - the overlapping cultural sector and creative industries are most concentrated in London, with 32.3% and 30.3% of filled jobs in London respectively.
By individual DCMS sector:
- Civil society: filled jobs in the civil society sector are spread slightly more evenly than the included DCMS sectors overall, with the three largest shares of filled jobs found in London (17.2%), the South East (15.5%), and Scotland (10.8%).
- Creative industries: filled jobs in the creative industries are more concentrated in London than the UK economy overall. In 2025, the largest share of creative industries filled jobs were in London (30.3%), followed by the South East (16.0%).
- Cultural sector: filled jobs in the cultural sector are more concentrated in London than the UK economy overall. In 2025, the largest share of cultural sector filled jobs were in London (32.3%), followed by the South East (13.2%).
- Sport: filled jobs in the sports sector are more evenly distributed across regions than DCMS sectors overall. In 2025, the largest share of sports sector filled jobs were in the South East (17.4%), followed by London (14.9%) and the North West (11.1%).
- Gambling: estimates of filled jobs by region for gambling are not reported here individually as these estimates are affected by small sample sizes, meaning there is a high level of uncertainty around the estimates.
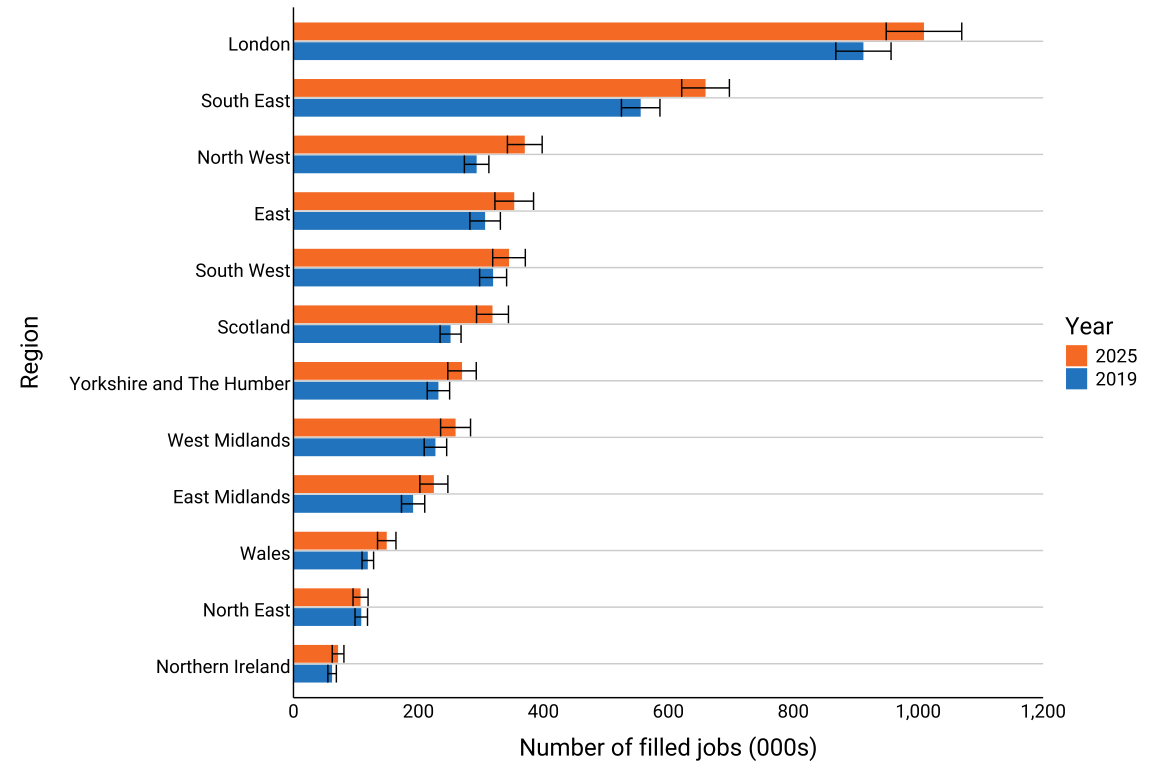
Figure 2: Employment (filled jobs, 000s) in the included DCMS sectors by region, with confidence intervals, for January to December 2025.
Compared to 2019, the regions to see a statistically significant growth in filled jobs in the included DCMS sectors in 2025 were Wales (+25.5%), the North West (+26.3%), Scotland (+26.7%), and South East (+18.7%). There were no significant changes in other regions.
Table 2. Confidence intervals for employment (filled jobs) in the included DCMS sectors by region, January to December, 2019 and 2025.
| Year | Interval Bounds | East (TLH) | East Midlands (TLF) | London (TLI) | North East (TLC) | Yorkshire and The Humber (TLE) | North West (TLD) | Northern Ireland (TLN) | Scotland (TLM) | South East (TLJ) | South West (TLK) | Wales (TLL) | West Midlands (TLG) |
| 2019 | Lower Bound | 282.4 | 172.9 | 868.1 | 98.5 | 214.1 | 273.6 | 55.0 | 234.7 | 525.0 | 297.9 | 109.7 | 209.3 |
| 2019 | Upper Bound | 331.2 | 210.1 | 956.5 | 118.5 | 250.0 | 312.8 | 68.6 | 268.3 | 586.6 | 341.2 | 128.3 | 245.2 |
| 2025 | Lower Bound | 322.4 | 202.4 | 948.8 | 95.3 | 247.1 | 342.5 | 62.1 | 293.0 | 621.4 | 318.9 | 134.6 | 235.5 |
| 2025 | Upper Bound | 384.3 | 247.2 | 1069.7 | 119.4 | 292.6 | 398.1 | 80.8 | 344.1 | 697.8 | 371.1 | 164.1 | 283.4 |
3.2 Demographic breakdowns
Any demographic comparisons made in this section between the included DCMS sectors and the UK overall have not been tested for statistical significance.
As of 2025, within the included DCMS Sectors there were 46.5% of filled jobs held by female workers, compared to 48.3% for the UK workforce overall. In the included DCMS sectors, 17.5% of filled jobs were held by disabled people in 2025, compared to 17.8% in the UK workforce overall.
These vary by individual DCMS sector:
- Creative industries: As of 2025, the creative industries had an estimated share of filled jobs held by disabled people at 14.7% and by female workers at 38.1% .
- Civil society: As of 2025, the civil society sector had an estimated share of filled jobs by disabled people at 24.7% and by female workers at 68.6%.
- Cultural sector: As of 2025, the cultural sector had an estimated share of filled jobs held by disabled people at 17.7% and by female workers at 46.4%.
- Sport: As of 2025, the sport sector had an estimated share of filled jobs held by disabled people at 15.6% and female workers at 44.8%.
- Gambling: As of 2025, the gambling sector had an estimated share of filled jobs held by disabled people at 20.9% and by female workers at 39.7%.
Within the included DCMS sectors, the share of filled jobs held by people from the White ethnic group was 83.9% (vs 82.8% UK workforce overall), 7.6% from the Asian or Asian British ethnic group (vs 8.6% UK workforce overall), 3.7% from the Black, African, Caribbean or Black British ethnic group (vs 4.8% UK workforce overall), 2.4% from the Mixed or Multiple ethnic group (vs 1.8% UK workforce overall), and 2.4% from Any other ethnic group (vs 1.9% UK workforce overall).
These vary by individual DCMS sector:
- Civil society: As of 2025, the share of filled jobs held by people from the White ethnic group was 87.4%, 4.6% from the Asian or Asian British ethnic group, 4.3% from the Black, African, Caribbean or Black British ethnic group, 1.7% from the Mixed or Multiple ethnic group and 2.0% from Any other ethnic group.
- Creative industries: As of 2025, the share of filled jobs held by people from the White ethnic group was 80.9%, 10.0% from the Asian or Asian British ethnic group, 3.7% from the Black, African, Caribbean or Black British ethnic group, 2.6% from the Mixed or Multiple ethnic group, and 2.7% from Any other ethnic group.
- Cultural sector: As of 2025, the share of filled jobs held by people from the White ethnic group was 85.6%, 5.1% from the Asian or Asian British ethnic group, 4.5% from the Black, African, Caribbean or Black British ethnic group, 3.1% from the Mixed or Multiple ethnic group, and 1.8% from Any other ethnic group.
- Sport: As of 2025, the share of filled jobs held by people from the White ethnic group was 90.0%, 3.4% from the Asian and Asian British ethnic group, 2.7% from the Black, African, Caribbean or Black British ethnic group, 2.7% from the Mixed or Multiple ethnic group and 1.3% from Any other ethnic group.
- Gambling: Estimates of filled jobs by ethnicity for gambling are not reported here as these estimates are affected by small sample sizes, meaning there is a high level of uncertainty around the estimates.
Further demographic information can be found in the published tables, including breakdowns by age, nationality, highest level of education and working pattern (full-time or part-time).
4. Creative Economy
We are publishing an update to the creative occupations list based on the latest Standard Occupational Classification (SOC) framework (SOC 2020), which is used to classify jobs by their skill level and content. This was completed following recommendations from an independent expert panel. Further information on this process is available in the Creative Occupations Update Note published alongside this report.
Using this updated list, we estimate:
- There were 3.1 million filled jobs in the creative occupations
- There were 4.3 million filled jobs in the creative economy, which includes all filled jobs in the creative industries (2.5 million) and filled jobs in creative occupations outside of creative industries (avoiding double counting)
The updated list of creative occupations using SOC 2020 is published in the data tables alongside this release.
5. DCMS Sector Overlap
In order to measure the size of the economy it is important to define it. DCMS uses a range of definitions based on internal or UK agreed definitions. Definitions are predominantly based on the Standard Industrial Classification 2007 (SIC) codes. This means nationally consistent sources of data can be used and enables international comparisons. There is an overlap between DCMS sectors, and some industries (as defined by 4-digit Standard Industrial Classification, or SIC, codes) are part of more than one DCMS sector. In particular, the cultural sector is defined using SIC codes that are nearly all within the creative industries. When we produce estimates for DCMS sectors as a whole, we remove these overlaps and count each industry once.
The exact size of the overlap between sectors varies by measure. For the figures in this release, the overlap between the sectors is illustrated in Figure 3.
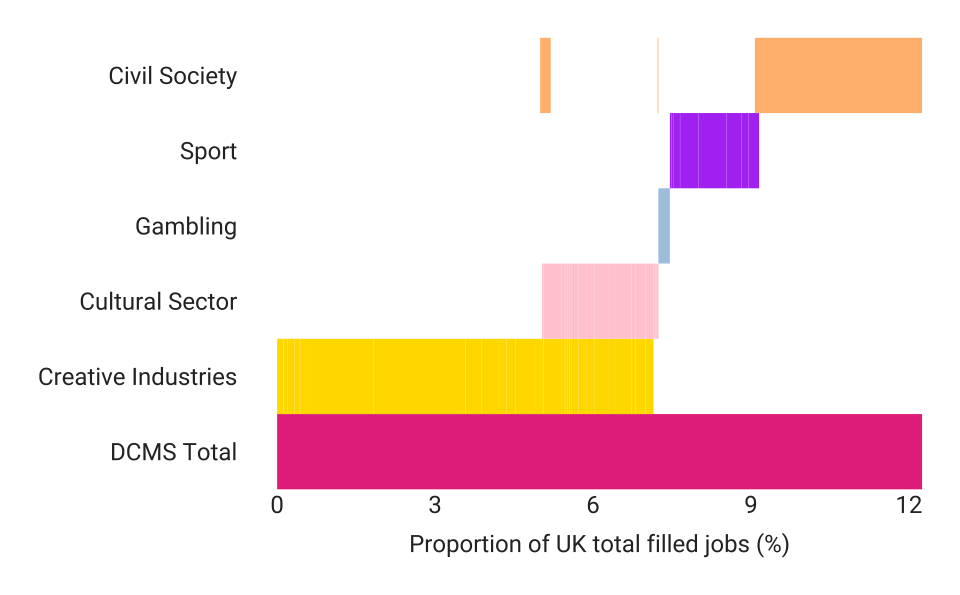
Figure 3: Size of the overlap between DCMS sectors, Employment, January 2025 to December 2025.
6. Further Information
Office for Statistics Regulation
Our statistical practice is regulated by the Office for Statistics Regulation (OSR). OSR sets the standards of trustworthiness, quality and value in the Code of Practice for Statistics that all producers of official statistics should adhere to. You are welcome to contact us directly with any comments about how we meet these standards. Alternatively, you can contact OSR by emailing regulation@statistics.gov.uk or via the OSR website.
Methodological information on the sector definitions, data sources, derivation of GVA and limitations of the approach can now be found in the accompanying technical report, along with. a summary of alternative economic measures of these sectors that are published elsewhere.
The responsible statistician for this release is Nicholas Hamilton Wu. For enquiries on this release, please email evidence@dcms.gov.uk.
For general enquiries, please see this guidance on how to contact the department.
For media enquiries contact: 020 8080 3054