Economic Estimates: Employment in the Digital Sector, January 2025 to December 2025 – Technical and quality assurance report
Published 1 October 2026

© Crown copyright 2026
This publication is licensed under the terms of the Open Government Licence v3.0 except where otherwise stated. To view this licence, visit nationalarchives.gov.uk/doc/open-government-licence/version/3 or write to the Information Policy Team, The National Archives, Kew, London TW9 4DU, or email: psi@nationalarchives.gov.uk.
Where we have identified any third party copyright information you will need to obtain permission from the copyright holders concerned.
This publication is available at https://www.gov.uk/government/statistics/economic-estimates-employment-in-the-digital-sector-january-2025-to-december-2025/economic-estimates-employment-in-the-digital-sector-january-2025-to-december-2025-technical-and-quality-assurance-report
1. Overview of release
This technical report covers the ‘Economic Estimates: Employment in the Digital Sector, January 2025 to December 2025’ release. The release provides estimates of employment in the Digital Sector and the United Kingdom (UK) overall based on the latest 2025 data from the Annual Population Survey (APS) run by the Office for National Statistics (ONS).
This series is classified as Official Statistics in Development as it is based on APS data which were classified as Official Statistics in Development at publication. See Section 2 for further information.
The Digital Sector Economic Estimates: Employment Calendar Year release series was previously produced by the former-Department for Culture, Media and Sport and, subsequently, the former-Department for Science, Innovation and Technology (DSIT). Responsibility for Digital and Telecommunications policy now sits with the new Department for Digital, Culture, Media and Sport (DCMS). The previous release in this series can be found on the former-DSIT Digital Sector Economic Estimates: Employment webpage. Releases prior to this can be found on the DCMS webpage.
This ‘Economic Estimates: Employment in the Digital Sector, January 2025 to December 2025’ release provides estimates of the number of filled jobs (including both employed and self-employed, and both full-time and part-time jobs) in the Digital Sector measuring the calendar year 12-month period between January 2025 and December 2025. A list of the subsectors included in the Digital Sector is included in Section 4: Sector definitions.
These estimates are derived from the ONS Annual Population Survey (APS) and contain demographic breakdowns including, but not limited to, employment type (i.e. employed or self-employed), International Territorial Level 1 (ITL1) region of work, nationality, sex, and ethnicity. Employment estimates are based on APS data collected over the 12-month period from January 2025 to December 2025.
The ONS is the provider of the underlying APS data used for the analysis presented within this release. As such, the same data sources are used for the Digital Sector as those used for national estimates, enabling comparisons to be made on a consistent basis.
2. Code of Practice for Statistics
The statistics in this series (including this release) are classified as Official Statistics in Development. Previous releases in the Digital Sector Economic Estimates: Employment series have been classed as Accredited Official Statistics. The Office for Statistics Regulation (OSR) has now removed accreditation at DSIT’s request, following ONS reporting concerns with the quality of estimates for smaller segments of the APS population, which the Digital Sector Economic Estimates: Employment series depends upon.
Our approach in moving the Digital Sector Economic Estimates: Employment series to Official Statistics in Development is in line with ONS’s decision to consider their APS based labour market statistics as Official Statistics in Development. Although ONS has since reviewed this decision and will publish future APS based outputs as Official Statistics, this publication will remain Official Statistics in Development. This is because this publication is based on APS data which were classified as Official Statistics in Development at publication.
Reduced APS coverage of Digital Sector SIC codes reduces the reliability of our employment estimates. Survey responses relating to the Digital Sector form a small proportion of the APS. Decreases in APS response rates means that employment estimates are based on a smaller number of responses which have been weighted to represent a larger proportion of the UK population. Relying on a small number of responses to make estimates of a large proportion of the population results in high levels of volatility as small changes in the number of responses have larger effects on employment estimates. This increased volatility affects the certainty about any observed changes in Digital Sector employment estimates, as these observed changes are potentially attributable to random fluctuations. The ONS provide further information on APS quality issues in their APS quality update article.
In addition to reclassifying Economic Estimates: Employment in the Digital Sector estimates as Official Statistics in Development, we have included data on the coefficient of variation (CV) to provide an indication of the statistical robustness of each estimate. We have also removed breakdowns to the individual SIC code level due to low sample sizes.
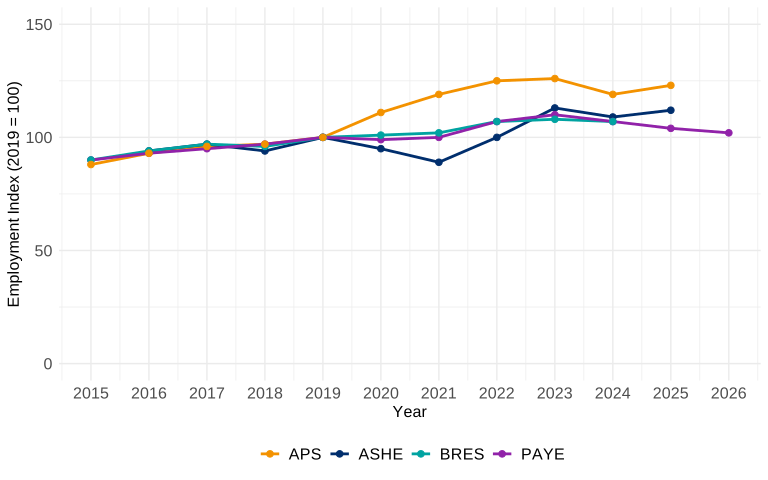
In Figure 1 of Section 8, we have compared APS based employment estimates with employment estimates derived from other data sources in order to review the statistical robustness of employment estimates in previous releases. This comparison showed APS based employment estimates diverged from alternative data sources from 2019 onwards, suggesting further potential data quality issues with underlying APS data. Although the precise cause of this divergence is not yet known, Section 8 contains discussion on potential explanations. Users may also find additional data sources covered in Section 8 helpful to support employment estimates reported here.
We will continue to monitor the reliability of underlying data, review the designation and provide caveats for the Digital Sector Economic Estimates: Employment series, where appropriate, in line with the Code of Practice for Statistics. You are welcome to contact us directly with any queries about how we meet these standards by emailing economicestimates@dsit.gov.uk.
Alternatively, you can contact OSR by emailing regulation@statistics.gov.uk or via the OSR website.
The economic estimates produced by former-DSIT follow the same methodology as those produced by DCMS. This methodology will be continuously reviewed and developed to make improvements to the series where relevant. The methodology will be clearly stated in associated documentation. Engagement from users is encouraged to facilitate the continuous improvement of these statistics.
3. Users
The users of these statistics fall into five broad categories:
- Ministers and other political figures.
- Policy and other professionals in government departments.
- Industries and their representative bodies.
- Charitable organisations.
- Academics.
The primary use of these statistics is to monitor the performance of the industries in the Digital Sector, helping to understand how current and future policy interventions can be most effective.
4. Sector definitions
In order to produce these economic estimates, it is necessary to define the make-up of the economy and the sectors comprising it. The Digital Sector definition is based on Standard Industrial Classification 2007 (SIC) codes. This allows data sources to be nationally consistent and enables international comparisons.
4.1 Digital Sector
The definition of the Digital Sector is based on the Organisation for Economic Cooperation and Development (OECD) definition of the ‘information society’. This is a combination of the OECD definition for the ‘ICT Sector’ and ‘Content and Media Sector’. An overview of the SIC codes included in each of these sectors is available in the OECD Guide to Measuring the Information Society (see Box 7.A1.2 on page 159 and Box 7.A1.3 on page 164).
Table 1: SIC codes included in the Digital Sector by Digital Subsector (adapted from OECD, 2011)
| Digital subsector | SIC codes included |
|---|---|
| Manufacturing of electronics and computers | 26.11, 26.12, 26.2, 26.3, 26.4, 26.8 |
| Wholesale of computers and electronics | 46.51, 46.52 |
| Publishing (excluding translation and interpretation activities) | 58.11, 58.12, 58.13, 58.14, 58.19 |
| Software publishing | 58.21, 58.29 |
| Film, TV, video, radio and music | 59.11, 59.12, 59.13, 59.14, 59.2, 60.1, 60.2 |
| Telecommunications | 61.1, 61.2, 61.3, 61.9 |
| Computer programming, consultancy and related activities | 62.01, 62.02, 62.03, 62.09 |
| Information service activities | 63.11, 63.12, 63.91, 63.99 |
| Repair of computers and communication equipment | 95.11, 95.12 |
4.2 Details and limitations of sector definitions
The definition used in this release for the Digital Sector, using SIC codes, does not consider the value added from ‘digital’ services to the wider economy e.g. digital work that takes place in diversified businesses in other industries such as health care or construction. It therefore does not include the value added to the economy from businesses which carry out digital services as part of their output in other areas of the economy.
There are also substantial limitations to the underlying Standard Industrial Classifications. Although SIC codes were recently updated through the UK SIC 2026 revision process, the earliest planned use for the SIC 2026 framework in ONS publications is in 2031. This publication is therefore based on the SIC 2007 framework. Changes to the balance and make-up of the UK economy over the last 19 years, have made SIC 2007 relevance for important elements of the economy less robust. This is particularly relevant for the Digital Sector, in which, there are likely to be several emerging sectors that are not accurately identified by SIC codes, such as cyber-security and artificial intelligence. The SIC codes used to produce these estimates are a ‘best fit’, subject to these limitations.
5. Methodology
5.1 Data sources
In this release employment estimates are calculated using the Office for National Statistics (ONS) Annual Population Survey (APS). The majority of the data processing is done by the ONS, with DSIT receiving cleaned and weighted respondent-level data. We then process and aggregate the data to give employment estimates.
5.2 Annual Population Survey
The APS is a household survey that combines two waves of the Labour Force Survey (LFS) with an additional sample boost. Information collected includes the details of employment (e.g. location, industry, seniority, occupation, and income), circumstances (e.g. housing tenure and health) and demography (e.g. nationality, age, and ethnicity). Responses are weighted to population totals.
As covered in Section 2, the APS has experienced a decline in response rate which reduces the reliability of our employment estimates. In response to ONS reporting concerns about underlying APS data, we have requested that the Accredited Official Statistics status be removed from this series and have included coefficient of variation data to provide an indication of the statistical robustness of each employment estimate.
5.3 Employment estimates
To produce our employment estimates we only include respondents that are ‘in work’ from the APS dataset for analysis. The APS provides data on an individual level for both a respondent’s first job, and if applicable, a respondent’s second job as separate variables. Therefore, in the dataset across these two variables, we define ‘in work’ as those with a first or second job who are categorised as an employee or self-employed. The data presented in this report, and the accompanying employment data tables, therefore includes both employed and self-employed workers.
As ‘employment’ in this release is estimated as the number of filled jobs, we restructure the data to be on a per job basis, rather than a per respondent basis. We then select entries that are relevant for a particular grouping (e.g. all entries with a SIC code of 26.11 for total employment in the ‘Manufacture of electronic components’ subsector) and aggregate over the associated population weights to generate an estimate of the total number of filled jobs. This means that some respondents may be included in the employment data tables twice if they have both a first and second job.
Data tables relating to the employment estimates provide demographic breakdowns across the Digital Sector, UK overall, and the Digital subsectors for employment status (employed/self-employed), ITL1 region of work, nationality, sex, ethnicity, age, highest level of education, working pattern (full time/part time), managerial status, socio-economic group (National Statistics Socio-economic Classification), and Equality Act disability status. There are additional breakdowns combining these selected specified variables with employment status. It is important to note that employment estimates for many of these demographic breakdowns are based on small sample sizes and so are considered unreliable. Users can review associated coefficient of variation data in the data tables of this release as an indication of the level of statistical robustness of employment estimates for each demographic breakdown. We have also removed breakdowns to the individual SIC code level due to the low sample sizes for these groups.
5.4 Disclosure control
As part of the production process, we apply disclosure control and quality assurance measures to prevent the identification of any respondents. We suppress values where the number of respondents for a particular demographic breakdown is below a set threshold (below or equal to 3 responses). Where appropriate, we also apply secondary suppression to prevent disclosure via differencing (i.e. being able to calculate the disclosed value from the other values presented). These values are instead replaced with a ‘c’. Additionally, any demographic breakdowns for which there are no respondents or there is missing data are replaced with a ‘w’. Further information is available in the ‘Respondent sample sizes’ sheet in the data release, which also highlights where the number of respondents comprising a value is deemed to be of a small sample size (below 30 responses).
5.5 Measures of variability
In order to provide an indication of the statistical robustness of employment estimates, we have carried out variability analysis. This analysis is presented as coefficient of variation (CV) data alongside the standard data tables and as confidence intervals in time series graphs in the main report. CV is the standard deviation divided by the estimate value and expressed as a percentage. Similar to the standard error, the closer the coefficient of variation is to zero, the more precise the estimate is. In this context, confidence intervals represent a range within which there is a 95% chance of the population value falling based on sample data collected. This variability analysis was performed according to ONS guidance and assumptions on statistical robustness based on CV levels which were taken from ONS Annual Survey of Hours and Earnings publications.
CV and confidence interval calculations were performed whilst accounting for APS survey design using the R “survey” package. During these calculations the “strata variable” was set to local authority district (LAD), the “cluster variable” was set to a household variable derived from the unique person identifier (CASENO) and the “weight variable” was set to APS person weight (PWTA22). The “domain variable” and “variable of interest” were set depending upon the data being analysed.
6. Changes in this release
We have carried through the changes made to the ‘Economic Estimates: Employment in the Digital Sector’ series reported in the previous release when former-DSIT became responsible for publishing estimates for the Digital sector. These include coverage of additional demographic breaks in the main report and additional methodology documentation in the technical report.
As covered in Section 2: Code of Practice for Statistics, these statistics have been reclassified as Official Statistics in Development from Accredited Official Statistics. We have removed breakdowns to the individual SIC code level due to low sample sizes. Additionally, we have included coefficient of variation and confidence interval measures of variability to provide further information on the statistical robustness of employment estimates.
7. Quality assurance processes
This section summarises the quality assurance processes applied during the production of these statistics by our data providers, the Office for National Statistics (ONS), as well as those applied by former-DSIT.
7.1 Quality assurance processes at ONS
Quality assurance at ONS is carried out during multiple data production stages. Methodological and quality assurance information in regard to the APS can be found in the Annual Population Survey QMI.
7.2 Validation and quality assurance at DSIT
Disclosure control is also applied as part of this process. Published data tables are thoroughly checked to ensure disclosive values are not included (breakdowns equal to 3 or fewer responses), and that it is not possible to derive these disclosive values via differencing from the data published. In the respondent sample sizes sheets of each release, breakdowns with no responses (0 responses), those with disclosive values (3 or fewer responses) and those with small sample sizes (fewer than 30 responses) have been highlighted.
8. External data sources
It is recognised that there are always different ways to define sectors, but their relevance depends on what they are needed for. Government generally favours classification systems which are:
- Rigorously measured.
- Internationally comparable.
- Nationally consistent.
- Ideally applicable to specific policy interventions.
These are the main reasons for constructing sector classifications in this series from SIC codes. However, we acknowledge that there are limitations with this approach and alternative definitions and methodologies can be useful where a policy-relevant grouping of businesses crosses the existing SIC codes.
The ONS uses the quarterly Labour Force Survey (LFS) for its estimates of UK-wide employment rates. Our APS employment estimates of the number of filled jobs in the Digital Sector takes a similar approach. However, as the APS uses two waves of the LFS, the datasets are not directly comparable and result in the ONS published figures for employment in the UK overall differing from our estimates of employment for the UK overall.
For employment estimates more broadly, the main alternative data source is the Business Register and Employment Survey (BRES). This has the advantage of asking businesses directly about their employees and is, therefore, more likely to capture employment more accurately than a household survey. However, the BRES does not contain the range of demographic breakdowns and the self-employed data which the APS provides. Use of the APS, therefore, enables us to build a fuller picture of employment in the Digital Sector, using a relatively robust data source.
The Annual Survey of Hours and Earnings (ASHE) and Pay As You Earn (PAYE) Real Time Information (RTI) are further alternative data sources which can provide employment estimates. ASHE is a survey of employers which uses HMRC PAYE records as a sampling frame, providing a large sample of employee jobs. However, ASHE is designed primarily to measure earnings and working patterns rather than employment. PAYE RTI is based on administrative records collected by HMRC, providing near complete coverage of employees paid through PAYE and avoiding many of the sampling issues associated with survey data. However, PAYE RTI excludes most self-employed workers, while both ASHE and PAYE RTI contain more limited demographic information than the APS.
The Information and Communication sector (Section J) is an ONS defined sector of the economy that is a rough proxy for the Digital Sector. As shown in the annex, Section J contains many of the same SIC codes as the Digital Sector. Figure 1 shows that trends in employment for the Information and Communication sector reported in BRES, PAYE and ASHE differ substantially from changes in employment reported in this series since the COVID-19 pandemic. Revised BRES data for 2025 will be released later this year and may show a different trend to these results – APS, BRES, PAYE and ASHE data contribute to the evidence base around Digital Sector employment. APS is currently used in this series as it provides demographic data not available in BRES.
Figure 1: Index of Section J employment when measured using ASHE, PAYE, BRES or APS from 2015 to 2025, 2019 = 100, UK
It is recognised that there will be other sources of evidence from industry bodies, for example, which have not been included above. We encourage statistics producers within the Digital Sector who have not been referenced to contact the economic estimates team at economicestimates@dsit.gov.uk.
The cause of the divergence between data sources for Section J employment estimates is not yet known but is likely to relate to interactions between the APS and the Digital Sector. For example, estimates of the number of people working in a sector are based on the proportion of people who said they are working in a sector at interview. The respondent’s perception of their employer may not align with the employer’s own classification, as would be recorded in business-based surveys such as BRES. Respondent’s perceptions of their employer’s classification may have changed within an increasingly digital economic environment.
Since the onset of the COVID-19 pandemic response rates for the APS have been declining, with much smaller sample sizes achieved from the survey and a resultant increase in uncertainty associated with the survey results. In response to this, ONS have made several changes to boost response rates. This has resulted in a change in mix of survey modes, with more telephone interviews for example, and a change in characteristics of responder. These changes may have impacted some sectors, such as the Digital Sector, more substantially than others.
An additional impact of the COVID-19 pandemic has been on APS weighting methodology. There have been reports from academics and think tanks highlighting potential issues with the APS weighting methodology as a result of unexpected changes in migration. Population estimates for London may have been particularly affected by these weighting issues which, given that the Digital Sector contains a high proportion of employees in London, could have a disproportionate effect of Digital Sector employment estimates. The APS data underlying this publication is expected to be re-weighted prior to the next release in this series, which may help to correct this issue.
9. Further information
For further details about the estimates or for enquiries on this release, please email: economicestimates@dsit.gov.uk.
For general queries relating to DSIT Official Statistics, please contact: statistics@dsit.gov.uk.
The ‘Economic Estimates: Employment in the Digital Sector’ release is now classified as Official Statistics in Development.
For more information on the Code of Practice for Statistics see https://code.statisticsauthority.gov.uk/.
10. Annex: Section J and the Digital Sector
Table 1: Comparison of the Digital Sector and Section J SIC Codes
| SIC Code | Description | In Section J? | In Digital Sector? |
|---|---|---|---|
| 26.11 | Manufacture of electronic components | No | Yes |
| 26.12 | Manufacture of loaded electronic boards | No | Yes |
| 26.20 | Manufacture of computers and peripheral equipment | No | Yes |
| 26.30 | Manufacture of communication equipment | No | Yes |
| 26.40 | Manufacture of consumer electronics | No | Yes |
| 26.80 | Manufacture of magnetic and optical media | No | Yes |
| 46.51 | Wholesale of computers, computer peripheral equipment and software | No | Yes |
| 46.52 | Wholesale of electronic and telecommunications equipment and parts | No | Yes |
| 58.11 | Book publishing | Yes | Yes |
| 58.12 | Publishing of directories and mailing lists | Yes | Yes |
| 58.13 | Publishing of newspapers | Yes | Yes |
| 58.14 | Publishing of journals and periodicals | Yes | Yes |
| 58.19 | Other publishing activities | Yes | Yes |
| 58.21 | Publishing of computer games | Yes | Yes |
| 58.29 | Other software publishing | Yes | Yes |
| 59.11 | Motion picture, video and television production activities | Yes | Yes |
| 59.12 | Motion picture, video and television programme post-production activities | Yes | Yes |
| 59.13 | Motion picture, video and television programme distribution activities | Yes | Yes |
| 59.14 | Motion picture projection activities | Yes | Yes |
| 59.20 | Sound recording and music publishing activities | Yes | Yes |
| 60.10 | Radio broadcasting | Yes | Yes |
| 60.20 | Television programming and broadcasting activities | Yes | Yes |
| 61.10 | Wired telecommunications activities | Yes | Yes |
| 61.20 | Wireless telecommunications activities | Yes | Yes |
| 61.30 | Satellite telecommunications activities | Yes | Yes |
| 61.90 | Other telecommunications activities | Yes | Yes |
| 62.01 | Computer programming activities | Yes | Yes |
| 62.02 | Computer consultancy activities | Yes | Yes |
| 62.03 | Computer facilities management activities | Yes | Yes |
| 62.09 | Other information technology and computer service activities | Yes | Yes |
| 63.11 | Data processing, hosting and related activities | Yes | Yes |
| 63.12 | Web portals | Yes | Yes |
| 63.91 | News agency activities | Yes | Yes |
| 63.99 | Other information service activities n.e.c. | Yes | Yes |
| 95.11 | Repair of computers and peripheral equipment | No | Yes |
| 95.12 | Repair of communication equipment | No | Yes |