DWP CFO European Social Fund 2014 to 2020 statistics to March 2023
Published 3 May 2023
Applies to Northern Ireland, Scotland and Wales

© Crown copyright 2023
This publication is licensed under the terms of the Open Government Licence v3.0 except where otherwise stated. To view this licence, visit nationalarchives.gov.uk/doc/open-government-licence/version/3 or write to the Information Policy Team, The National Archives, Kew, London TW9 4DU, or email: psi@nationalarchives.gov.uk.
Where we have identified any third party copyright information you will need to obtain permission from the copyright holders concerned.
This publication is available at https://www.gov.uk/government/statistics/dwp-cfo-european-social-fund-2014-to-2020-statistics-to-march-2023/dwp-cfo-european-social-fund-2014-to-2020-statistics-to-march-2023
This is the last bi-annual release of experimental statistics on the Department for Work and Pensions (DWP) Co-Financing Organisation (CFO) employment programme for the European Social Fund (ESF) 2014 to 2020 and includes data up to March 2023.
Statistics reported in this bulletin include the period of the coronavirus (COVID-19) pandemic. During this period, government measures have been taken to control the spread of the COVID-19 with restrictions enforced in England, through either national lockdowns or regional tier system. These measures have had an impact on the delivery of the programme and on its performance, especially on the number of participants joining the provision in 2020 and the number of job outcomes achieved in the months that followed.
DWP had made interim arrangements to allow the delivery of the DWP CFO ESF 2014 to 2020 provision in line with the government measures (details can be found in the provider guidance), but the unprecedented circumstances created by the pandemic had prevented some customers being signposted to provision and reduced for others the opportunity to achieve job outcomes at the levels seen previously.
This is the final release of this statistical series. The statistics have always been scheduled to finish alongside the end of the DWP CFO programme. The overall ESF programme continues to take new starters until the end of 2023. This saw the last starts in October 2021 with Local Enterprise Partnerships (LEPs) working with their remaining customer caseloads across the following 12 months up to October 2022. Beyond this, job outcomes can still be claimed 64 weeks after provision duration ends, so there may be a small number of future job outcomes not captured by this final release, but volumes are expected to be negligible relative to the job outcomes achieved so far.
1. Introduction
The DWP CFO employment programme for the European Social Fund (ESF) 2014 to 2020 is an EU funded programme across England aimed at unemployed or inactive individuals. Participants will either be long term unemployed or inactive (26 weeks or longer), or have a barrier to work, such as a basic skills need, a health condition, or caring responsibilities.
Since September 2016, the provision spread across 25 of the 38 Local Enterprise Partnerships (LEPs) across England, with up to 33 contracts delivering the provision. After October 2022, there were no longer any contracts still taking new referrals and the final contracts have finished working with their caseloads. This statistical publication refers only to the element of ESF 2014 to 2020 operated by DWP as a CFO.
2. Main Stories
Statistics reported in this bulletin include the period of the coronavirus (COVID-19) pandemic. During this period, government measures have been taken to control the spread of the COVID-19 with restrictions enforced in England, through either national lockdowns or regional tier system. These measures have had an impact on the delivery of the programme and reduced the opportunity for participants to achieve job outcomes at the levels seen in 2019; the impact on the performance can be seen from April 2020 to September 2020 as well as December 2020 to January 2021 before a return to levels like those seen pre-pandemic.
April and May then saw a reduction in starts as London contracts ended new referrals before 10 contracts finished in June 2021 with the final two contracts ending in October 2021.
Since the DWP CFO ESF 2014 to 2020 began:
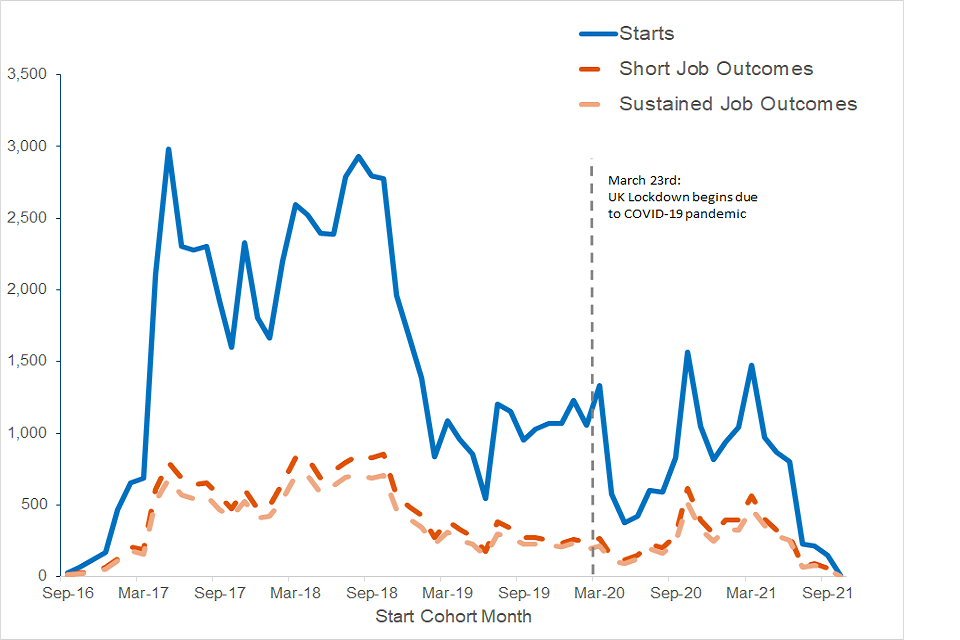
- 79,820 participants have started the employment programme up to November 2021
- Significant drops in starts between April and September 2020 as well as December 2020 to January 2021 due to COVID-19 restrictions were followed by gradual increases in the months following
- Starts have decreased since March 2021 as firstly London LEPs ended new referrals followed by all remaining LEPs by October 2021
- 24,220 (30%) of starts up to October 2021 have achieved a Short Job Outcome
- 20,360 (26%) of starts up to October 2021 have achieved a Sustained Job Outcome
Figure 1: Monthly number of starts and job outcomes, September 2016 to October 2021
Source: DWP CFO ESF 2014 to 2020 data tables.
3. What you need to know
What is DWP CFO ESF 2014 to 2020
The ESF programme from 2014 to 2020 is a 7-year round of funding from the EU as part of the European Structural and Investment Funds Growth Programme (ESIF). The ESIF is predominantly made up of the following three arms:
- European Regional Development Fund (ERDF)
- European Social Fund (ESF)
- European Agricultural Fund for Rural Development (EAFRD)
DWP CFO ESF 2014 to 2020 aims to improve employment opportunities, promote social inclusion and invest in skills by providing the help people need to meet their potential.
The programme is split geographically by Category of Region:
- More Developed (Gross Domestic Product (GDP) per capita above 90% of EU average) – this covers most of England
- Transitional (GDP per capita 75% to 90% of EU average) – there are 9 transitional areas in England
- Less Developed (GDP per capita below 75% of EU average) – Cornwall and the Isles of Scilly is the only region in England in this category
For the period covered by this publication, the providers delivering DWP CFO ESF 2014 to 2020 receive:
- a fixed monthly delivery fee
- payments for Short Job Outcomes, where an individual has 13 cumulative weeks in employment over a period of 26 weeks
- payments for Sustained Job Outcomes, where an individual has 26 cumulative weeks in employment over 52 weeks
Where applicable, contracts delivering DWP CFO ESF 2014 to 2020 had been temporarily moved to a ‘cost’ payment model between April 2020 and March 2021 to allow for continued support for those customers most in need. Under this system the providers’ costs for delivering the contracted service were met, rather than paying a service fee and outcome-related payments. Those Providers under the cost payment model reverted back to a Payment by Results system in April 2021.
DWP CFO ESF 2014 to 2020 provision was developed in consultation with LEPs to allow the provision to meet local needs. Depending on local circumstances and priorities, most LEPs identified particular categories of eligible participants on which it wanted its provision to focus (see provider guidance for more details).
Some LEPs also asked for particular activities to be included within the provision. At the start of the programme, some contracts had stricter eligibility criteria than the rest, however, this resulted in a low level of referrals and eligibility has now been widened to increase participant volumes. The London contracts have their own unique eligibility requirements, for example a focus on people aged 50 years and above.
What do these statistics show?
This publication includes figures on starts and job outcomes for the DWP CFO ESF 2014 to 2020 from September 2016. The data has been taken from the DWP Provider Referrals and Payments (PRaP) dataset. The March 2023 PRaP dataset has been used to report data on job outcomes from starts up to the final starts in October 2021.
4. Starts to DWP CFO ESF 2014 to 2020
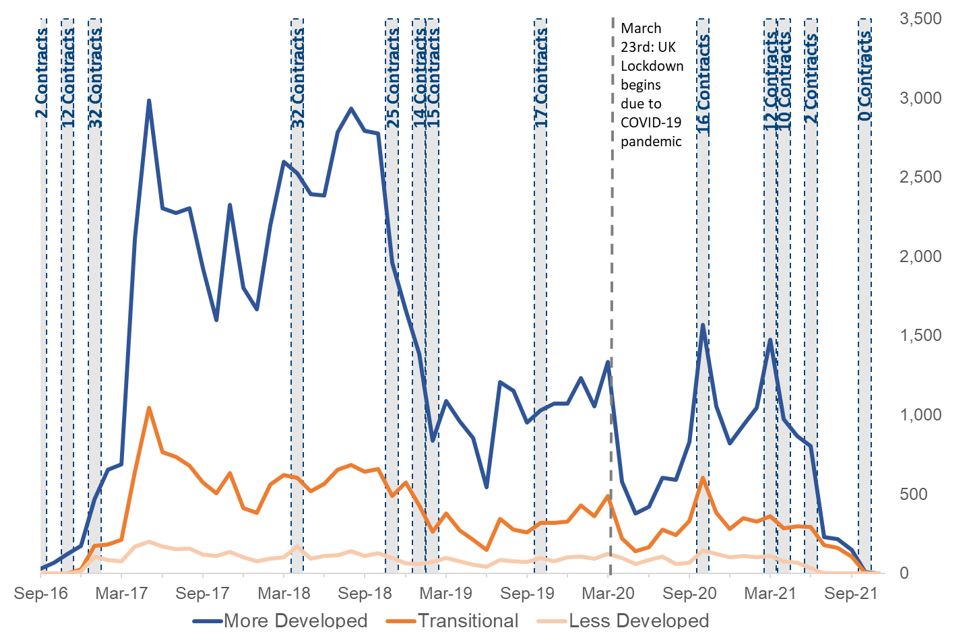
There have been 79,820 starts to the DWP CFO ESF 2014 to 2020 provision up to October 2021.
Figure 2: Monthly number of starts by Category of Region with the timeline of roll out of the programme, September 2016 to October 2021
Source: DWP CFO ESF 2014 to 2020 data tables.
Thirty-one contracts started taking referrals in three phases between September 2016 and February 2017. By February 2019, 15 of the original contracts were extended and continued taking referrals. In October 2019, two contracts were launched in two LEPs previously not part of DWP CFO ESF 2014 to 2020. These changes are clearly reflected in the number of starts per month, which rose significantly between September 2016 and March 2017 (32 contracts live) and decreased from November 2018.
All contracts which were not extended finished taking new referrals, however, they were contractually required to provide support to existing participants for the time they were on the programme.
As part of the Departments response to COVID-19, the referral period for ESF participants was extended to support additional claimants who became unemployed between March 2020 and May 2021. This helped to address some lost performance from the earlier part of the pandemic, however, it has not met the original forecast. Eight of the 17 extended contracts (from the 2019 activity) were expanded to take new referrals up to 30 June 2021; the two London Older Workers contracts were expanded to take up new referrals up to 30 April 2021 and the four London Troubled Families contracts were expanded to take up new referrals up to 31 March 2021. In June 2021, eight of the remaining 10 contracts still taking referrals finished doing so, with the final two (The Marches and Enterprise M3) ending in October 2021.
Since the beginning of the COVID-19 pandemic, the number of starts decreased significantly. The period between April and September 2020 recorded an average number of starts per month of 570 participants. In the following six months to March 2021 this increased to an average of 1150. April, May and June 2021 volumes fell slightly to an average of 880 as London contracts ended new referrals. They fell even further to an average of 200 between July and September 2021 after eight further contracts ended new referrals. The final two contracts then finished in October 2021.
See Table 1 of the data tables accompanying this release for full data.
5. Job Outcomes for DWP CFO ESF 2014 to 2020
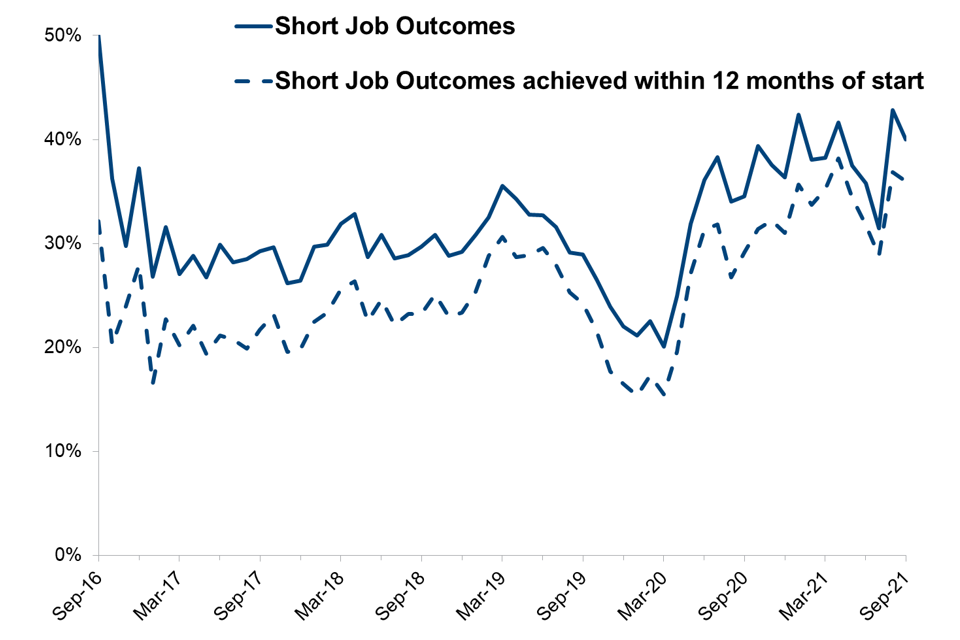
30% of starts between September 2016 and October 2021 have achieved a Short Job Outcome by March 2023.
Figure 3: Percentage of starts achieving a Short Job Outcome by month of start, September 2016 to October 2021
Source: DWP CFO ESF 2014 to 2020 data tables.
For starts up to October 2021, 30% achieved a Short Job Outcome, spending at least 13 weeks cumulatively in employment during a 26-week period.
Participants achieving a Short Job Outcome within 12 months of their start date represent 24% of starts up to October 2021; 80% of all the Short Job Outcomes achieved by the programme up to this point.
The proportion of starts achieving a Short Job Outcome has been stable since the beginning of the programme, although there was a significant reduction in the percentage of job outcomes achieved, likely due to the measures taken to control the COVID-19 pandemic. This increased in the following months to higher than pre-pandemic levels.
See Table 2 of the data tables accompanying this release for full data.
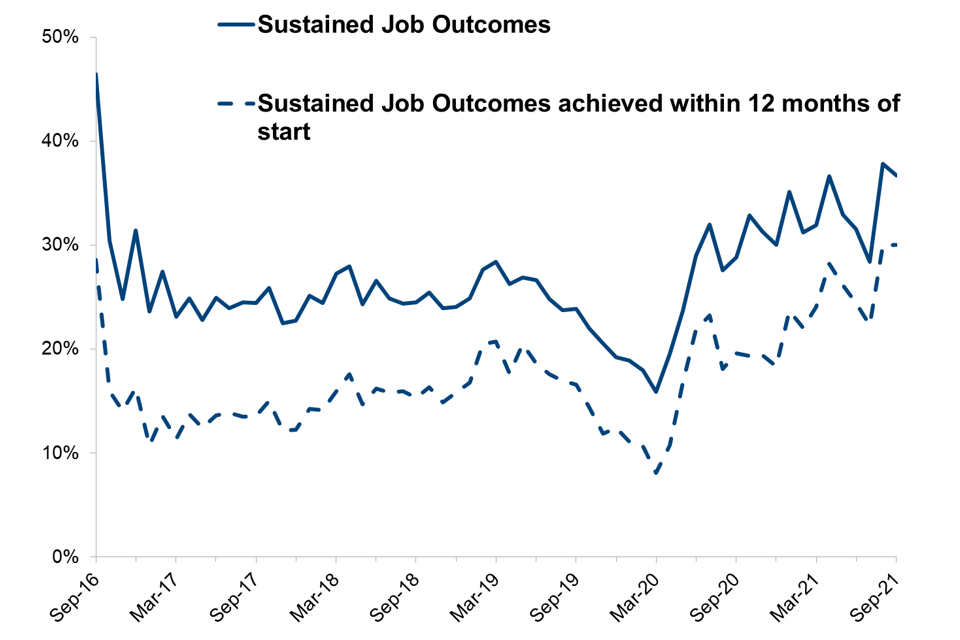
26% of starts between September 2016 and October 2021 achieved a Sustained Job Outcome by March 2023.
Figure 4: Percentage of starts achieving a Sustained Job Outcome by month of start, September 2016 to October 2021
Source: DWP CFO ESF 2014 to 2020 data tables.
For starts up to October 2021, 26% achieved a Sustained Job Outcome by being in employment for 26 weeks cumulatively in a 52-week period.
Participants achieving a Sustained Job Outcome within 12 months of their start date represent 15% of starts up to October 2021, 63% of all the Sustained Job Outcomes achieved by the programme up to this point.
As observed with the Short Job Outcomes, there was a reduction in the Sustained Job Outcomes achieved due to COVID-19’s impact on the programme before an improvement in the months since.
See Table 3 of the data tables accompanying this release for full data.
The proportion of job outcomes achieved by those that started in September 2016 is larger than any other cohort, but the number of starts at the beginning of the programme was substantially lower (Only 30 starts in September 2016) than the following months (average of over 1400 starts per month from April 2017 to October 2021). Similarly, volumes are also small in the final few months, averaging 150 starts per month in final 4 months of starts to October 2021.
6. Characteristics of people who started DWP CFO ESF 2014 to 2020
A higher proportion of people starting DWP CFO ESF 14-20 are male (56%).
Figure 5: Percentage of starts by gender, September 2016 to October 2021
| Gender | Total | Percentage |
|---|---|---|
| Male | 44,890 | 56% |
| Female | 34,710 | 44% |
See Table 4.1 of the data tables accompanying this release for full data.
Around half of participants are aged between 25 and 49 years.
Figure 6: Percentage of age groups by LEPs, September 2016 to October 2021
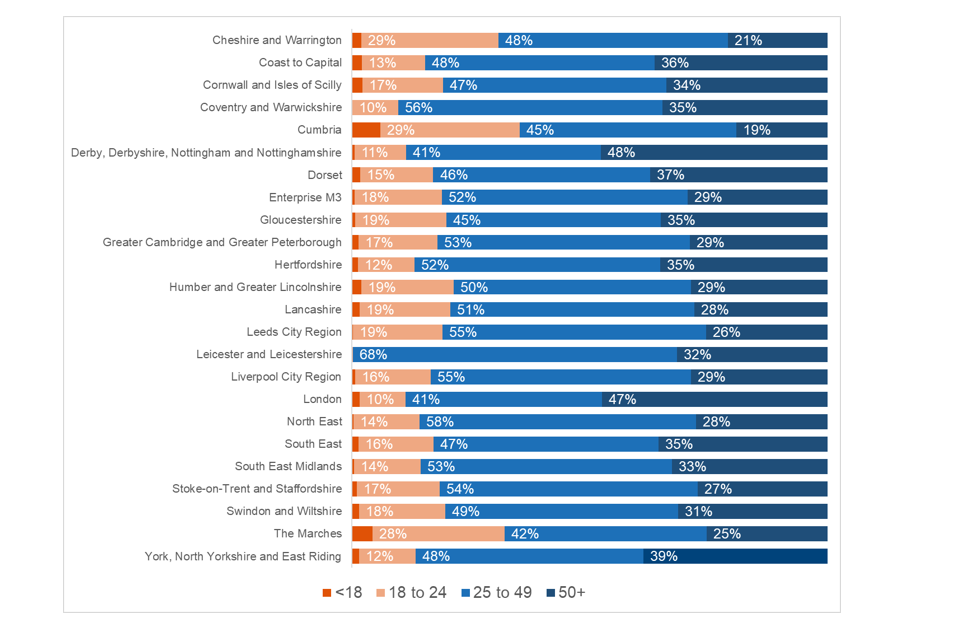
Source: DWP CFO ESF 2014 to 2020 data tables.
Almost half (49%) of all people starting the programme come from the 25 to 49 age group, whereas 35% are over 50 years old.
The distribution of age varies by LEPs, as different LEPs have chosen to focus on different output indicators within the programme.
The highest proportion of 18- to 24-year-olds starting the programme (29%) is recorded in both Cheshire & Warrington and Cumbria. Leicester and Leicestershire have the highest proportion of 25- to 49-year-olds starting the programme (68%) and Derby, Derbyshire, Nottingham and Nottinghamshire had the highest proportion of those 50 years and above starting the programme (48%). The over 50-year-olds also represent 47% of starts in London, as four of the eight contracts delivered in this LEP are aimed at older workers.
See Table 4.1 and Table 4.2 of the data tables accompanying this release for full data.
More than one in four of those starting DWP CFO ESF 2014 to 2020 come from Black, Asian and Minority Ethnic groups.
Figure 7: Percentage of starts by ethnicity, only for participants where this information is available, September 2016 to November 2021
| Ethnicity | Total | Percentage |
|---|---|---|
| White British or White Other | 31,920 | 65% |
| Black British or Black Other | 6,380 | 13% |
| Asian British or Asian Other | 4,840 | 10% |
| Prefer not to say | 3,120 | 6% |
| Chinese or Other | 1,750 | 4% |
| Mixed | 1,110 | 2% |
Most people on DWP CFO ESF 2014 to 2020 (65%) identified themselves as White. A further 29% identified themselves as Black, Asian or an Ethnic Minority; whereas 6% preferred not to specify their ethnicity.
See Table 4.1 of the data tables accompanying this release for full data.
Less than half (41%) of participants reported a self-declared disability and 62% of participants have an ethnicity recorded. However, disability data is not included for those claiming Universal Credit, as this data is not available for these participants.
Figure 8: Percentage of starts by self-declared disability, only for participants where this information is available September 2016 to November 2021
| Self-declared disability | Total | Percentage |
|---|---|---|
| Yes | 20,430 | 41% |
| No | 28,810 | 59% |
See Table 4.1 of the data tables accompanying this release for full data.
Note: Percentages reported in all figures are computed on all starts except records for which the information is unknown.
7. Main benefit of DWP CFO ESF 2014 to 2020 participants
More than one in three (38%) of people starting DWP CFO ESF 2014 to 2020 are claiming Universal Credit.
Figure 9: Percentage of starts by benefit type, September 2016 to October 2021
| Benefit Type at start | Total | Percentage |
|---|---|---|
| Jobseeker’s Allowance (JSA) | 26,860 | 34% |
| Universal Credit (UC) | 30,370 | 38% |
| Not on Work Benefit (No Ben) | 15,370 | 19% |
| Employment Support Allowance (ESA) | 4,750 | 6% |
| Income Support (IS) | 2,470 | 3% |
As the roll-out of UC has progressed across England, the number of participants claiming UC when they joined the programme increased.
In the first four years of the programme, the proportion of those not claiming any out of work benefit when they joined the programme has gradually increased, up to 23% of all the starts for both 2019-2020 and 2020-2021. This is up further to 60% for the first eight months of starts for 2021-2022.
See Table 5 of the data tables accompanying this release for full data.
8. Contractual Performance
The providers delivering DWP CFO ESF 2014 to 2020 have a performance level for the number of Short and Sustained Job Outcomes they are expected to achieve each month. Actual performance is measured against this expected performance level which is agreed at the beginning of each contract. The performance shown here is actual performance as a percentage of expected performance over a 12-month period (November 2021 to October 2022). This follows from the previous publication’s 12-month performance period. (December 2020 to November 2021)
Between November 2021 and October 2022, four out of 11 LEPs and 5 out of 16 contracts met or exceeded their expected number of Short Job Outcomes, getting people in work for at least 13 out of 26 weeks.
Figure 10: Short Job Outcomes as a percentage of expected performance (November 2021 to October 2022) by LEP
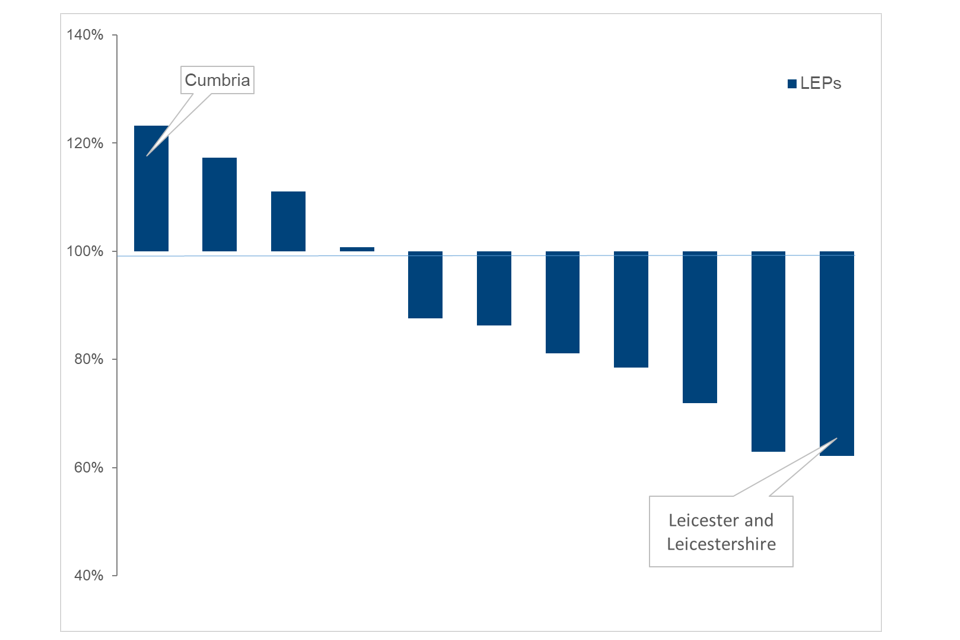
Source: DWP CFO ESF 2014 to 2020 data tables.
Between December 2020 and November 2021, five of the 11 LEPs and six of the 16 contracts met or exceeded their expected number of Sustained Job Outcomes, getting people in work for at least 26 weeks cumulatively in a 52-week period.
Figure 11: Sustained Job Outcomes as a percentage of expected performance (November 2021 to October 2022) by LEP
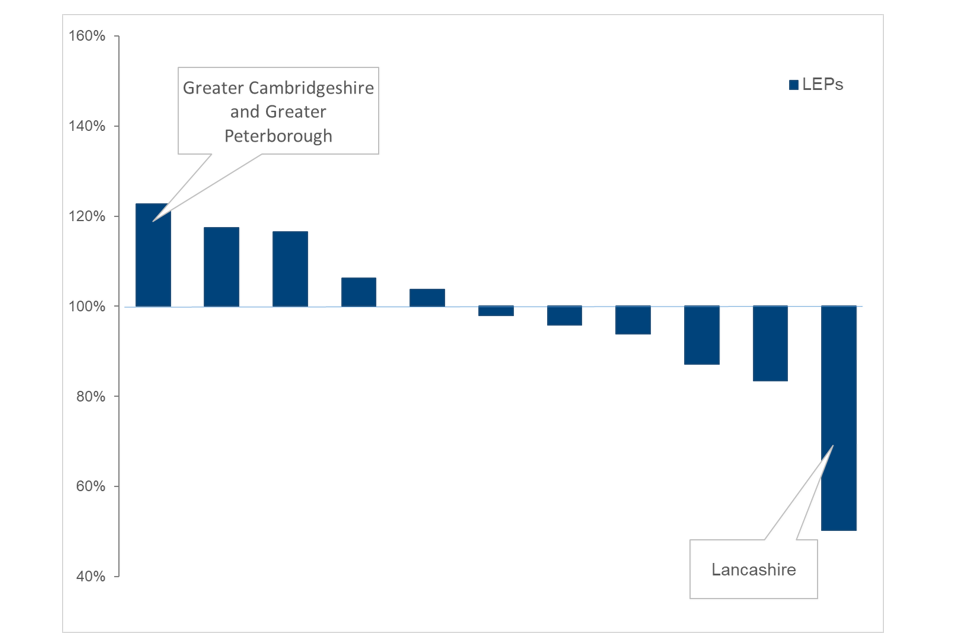
Source: DWP CFO ESF 2014 to 2020 data tables.
See Table 6 for full data on performance information for each contract and background information for more details about contractual information.
9. About these statistics
This statistical summary gives an overview of the DWP CFO employment programme for the European Social Fund 2014 to 2020. Key points and trends are presented using charts and commentary. The information underlying the charts is available in the data tables.
Data for these statistics is derived from the:
- DWP Provider Referrals and Payments System (PRaP)
- Labour Market Systems Opportunities Dataset
- National Benefit Database
- Universal Credit Official Statistics Dataset
- Client Extract Data
Some data within this publication may be subject to revisions. For more information on the revisions policy see the DWP CFO European Social Fund 2014 to 2020 experimental statistics: background information.
Experimental Statistics
Experimental statistics are Official Statistics which are published in order to involve users and stakeholders in their development and as a mean to build in quality at an early stage. All Official Statistics should comply with the UK Statistics Authority’s Code of Practice for Statistics which promotes the production and dissemination of Official Statistics that inform decision making.
Where to find out more
The background information and the DWP CFO ESF 2014 to 2020 provider guidance provide further information on DWP CFO European Social Fund 2014 to 2020 employment programme and statistics.
Read information about how DWP operates as one of the co-financing organisations for the DWP CFO ESF 2014 to 2020 programme.
DWP publishes statistics for a wide range of employment support schemes, including:
- Access to Work
- New Enterprise Allowance
- Work and Health Programme
View the full collection of DWP statistical releases.
Contact information and feedback
For more information on DWP CFO European Social Fund 2014 to 2020 statistics, please contact thomas.evans2@dwp.gov.uk.
DWP would like to hear your views on our statistical publications. If you use any of our statistics publications, we would be interested in hearing what you use them for and how well they meet your requirements. Please contact stats-consultation@dwp.gov.uk.