Driver and rider testing and instructor statistics: April 2020 to March 2021
Published 17 June 2021

© Crown copyright 2021
This publication is licensed under the terms of the Open Government Licence v3.0 except where otherwise stated. To view this licence, visit nationalarchives.gov.uk/doc/open-government-licence/version/3 or write to the Information Policy Team, The National Archives, Kew, London TW9 4DU, or email: psi@nationalarchives.gov.uk.
Where we have identified any third party copyright information you will need to obtain permission from the copyright holders concerned.
This publication is available at https://www.gov.uk/government/statistics/driver-and-rider-testing-and-instructor-statistics-april-2020-to-march-2021/driver-and-rider-testing-and-instructor-statistics-april-2020-to-march-2021
This release presents Driver and Vehicle Standards Agency (DVSA) statistics on the numbers and pass rates for driving and riding theory and practical tests conducted in Great Britain in the year from 1 April 2020 to 31 March 2021, in addition to Approved Driver Instructor (ADI) register statistics as at 31 March 2021.
For further details please refer to the background information section below and the separate technical guidance. For information about dates and definitions please refer to the key terms table in the background information.
Impact of the coronavirus (COVID-19)
Measures by the UK government to limit the impact and transmission of the coronavirus (COVID-19) pandemic have affected trends in these figures since March 2020 with a reduction of the number of car practical and vocational driving tests conducted. During national lockdowns tests were suspended except for critical workers.
Headlines
The headlines for driver and rider tests in Great Britain for the year-ending March 2021 are:
Across all test types, there were large percentage decreases in the number of tests conducted, combined generally with increases in pass rates. Practical tests saw a greater drop in tests conducted, whilst theory tests had a greater rise in pass rates (DRT0101), (DRT0102).
There was a fall of 52.2% in the number of car theory tests conducted compared with the year-ending March 2020 to 891,279. The car theory pass rate was 55.7%, a rise of 8.6 percentage points from the year-ending March 2020 and the highest annual pass rate since the year-ending March 2014 (DRT0102).
For car practical tests, there has been a decline of 72.7% during the year-ending March 2021 in the number of tests conducted to 437,352. The car practical pass rate was the highest ever seen for this series (which began in the year-ending March 2008) at 49.8%, an increase of 3.9 percentage points from the year-ending March 2020 (DRT0101).
Car theory and practical tests
In the year-ending March 2021, 891,279 car theory tests (Figure 1) and 437,352 car practical tests (Figure 2) were conducted in Great Britain. Compared to year-ending March 2020, this was a 52.2% decrease for car theory tests, and a reduction of 72.7% for car practical tests.
In the year-ending March 2021, annual figures for car theory and car practical tests were both affected by the very small number of tests conducted in Quarter 1 and Quarter 4 during the UK-wide national lockdowns in these periods, with most tests in the year-ending March 2021 taking place in Quarter 2 and Quarter 3 (Figure 1, Figure 2).
Notably, and despite the impact of the coronavirus (COVID-19), the number of car theory tests conducted in Quarter 2 and Quarter 3 were of a similar size to test numbers seen across the last 10 years (Figure 2).
Figure 1: Car theory tests conducted and pass rates, Great Britain, quarterly, year-ending March 2011 (Quarter 4) to year-ending March 2021 (Quarter 4) (DRT0102)
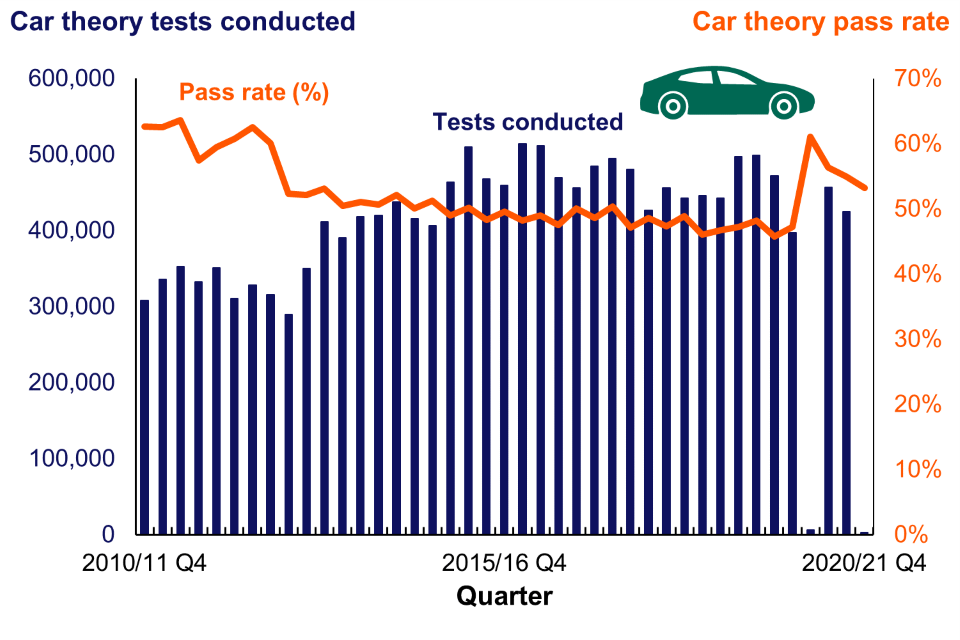
This chart shows the number of car theory tests conducted and the pass rate by quarter from 2010/11 quarter 4 to 2020/21 quarter 4.
Figure 2: Car practical tests conducted and pass rates, Great Britain, quarterly, year-ending March 2011 (Quarter 4) to year-ending March 2021 (Quarter 4) (DRT0101)
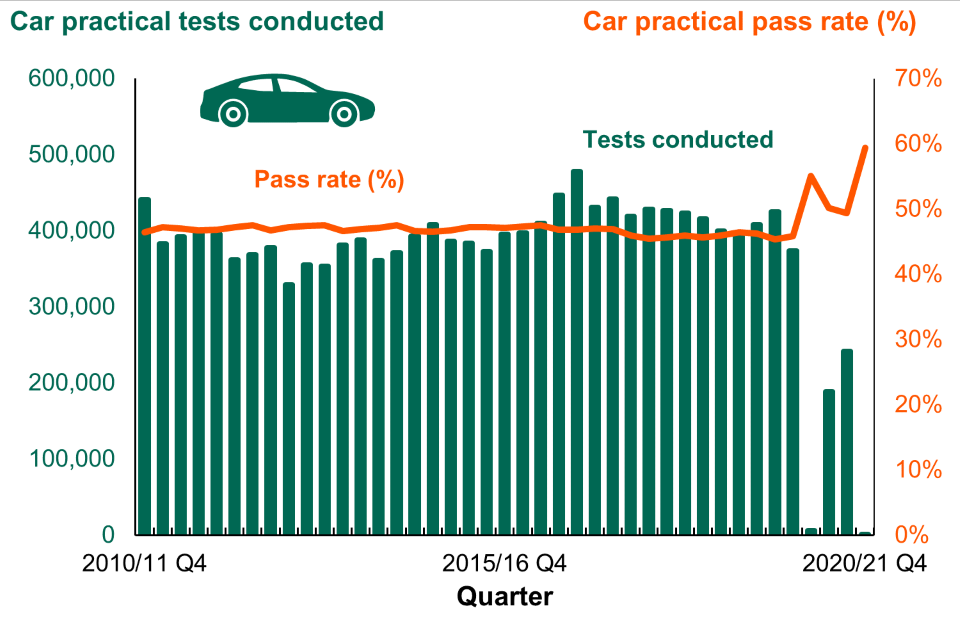
This chart shows the number of car practical tests conducted and the pass rate by quarter from year-ending March 2011 quarter 4 to year-ending March 2021 quarter 4.
Pass rate levels for car theory and practical tests in the year-ending March 2021 were notable, with both showing considerable variation from the generally stable levels seen over recent years.
The pass rate for car theory tests in the year-ending March 2021 was 55.7%, which was an increase of 8.6 percentage points from the year-ending March 2020 and the highest seen since the year-ending March 2013 (Table 1).
For car practical tests, the pass rate for the year-ending March 2021 was 49.8%, an increase of 3.9 percentage points from the year-ending March 2020 and the highest seen in the data series (which began in the year-ending March 2008) (Table 1).
Car tests by age, gender, and attempts
Table 1: Car theory and car practical tests by gender, Great Britain: year-ending March 2021, year-ending 31 March 2020 and year on year change (year-ending March 2021 compared to year-ending March 2020) (DRT0201), (DRT5201)
| Car test type | Gender | Tests Conducted (year-ending 2021) | Tests Passed (year-ending 2021) | Pass rate (%) (year-ending 2021) | Tests Conducted (year-ending 2020) | Tests Passed (year-ending 2020) | Pass rate (%) (year-ending 2020) | Tests Conducted (year on year percentage change) | Tests Passed (year on year percentage change) | Pass rate (year on year percentage point change) |
|---|---|---|---|---|---|---|---|---|---|---|
| Theory | Total | 891,279 | 496,660 | 55.7 | 1,865,740 | 878,903 | 47.1 | -52.2% | -43.5% | 8.6 |
| Theory | Female | 424,349 | 247,247 | 58.3 | 890,176 | 435,879 | 49.0 | -52.3% | -43.3% | 9.3 |
| Theory | Male | 466,752 | 249,289 | 53.4 | 975,205 | 442,793 | 45.4 | -52.1% | -43.7% | 8.0 |
| Practical | Total | 437,352 | 217,807 | 49.8 | 1,599,566 | 734,600 | 45.9 | -72.7% | -70.4% | 3.9 |
| Practical | Female | 219,171 | 103,230 | 47.1 | 837,193 | 356,542 | 42.6 | -73.8% | -71.0% | 4.5 |
| Practical | Male | 218,087 | 114,543 | 52.5 | 762,303 | 378,034 | 49.6 | -71.4% | -69.7% | 2.9 |
Note: Total tests may not equal the sum of male and female tests.
Overall in the year-ending March 2021, female candidates had a higher rate of success for the car theory test, with pass rates of 58.3% for female candidates and 53.4% for male candidates. The reverse was true across all ages for the car practical test, where female candidates over all ages had a pass rate of 47.1% and male candidates had a pass rate of 52.5% (Table 1).
Figure 3: Car practical test pass rates by gender and age band, Great Britain, year-ending March 2021 (DRT0203)
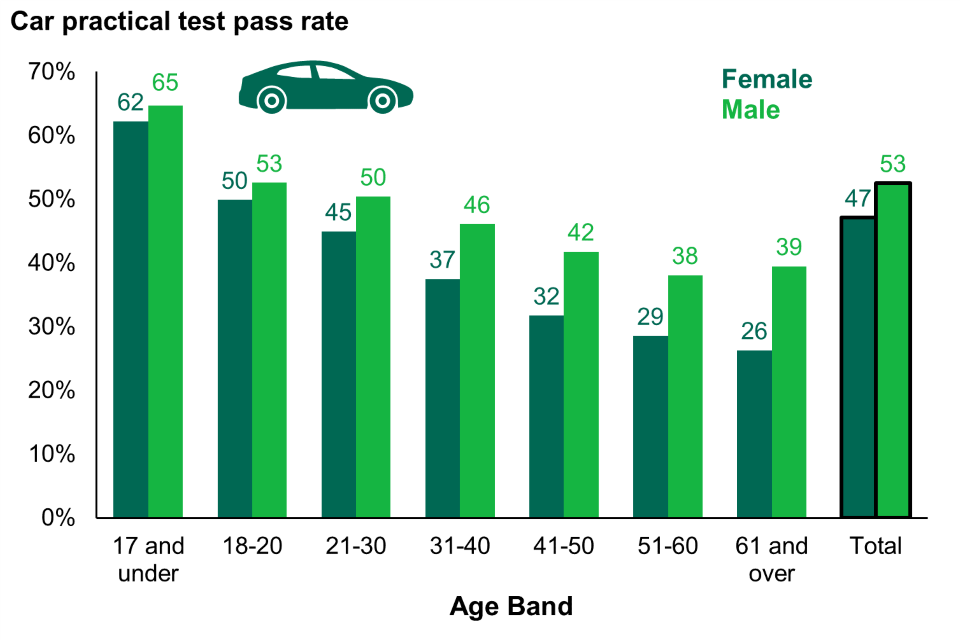
This chart shows the pass rates for car practical tests by gender and age band for year-ending March 2021.
Figure 4: Car practical tests by attempt, with pass rate, Great Britain, year-ending March 2021 (DRT0202)
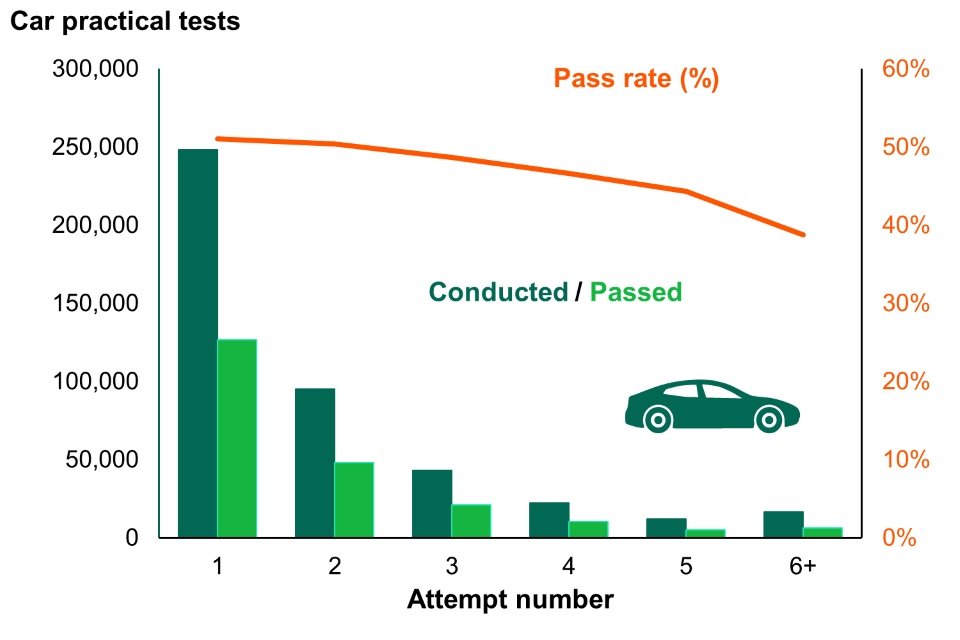
This chart shows the number of car practical tests conducted by attempt, with pass rate for the year-ending March 2021
The percentage of candidates passing the car practical test on first attempt increased by 3.1 percentage points from the year-ending March 2020 to 51.0%, meaning that in the year-ending March 2021, more candidates passed on their first attempt than all other attempts combined. Figure 4 illustrates that each subsequent attempt corresponded with a decrease in the pass rate.
Tables relating to the number of car practical tests (DRT0201 to DRT0203). Tables relating to the number of car theory tests (DRT5201 to DRT5203).
Motorcycle theory and practical tests
Figure 5: Motorcycle tests conducted by test type, Great Britain, annually, year-ending March 2011 to year-ending March 2021 (DRT0101), (DRT0102)
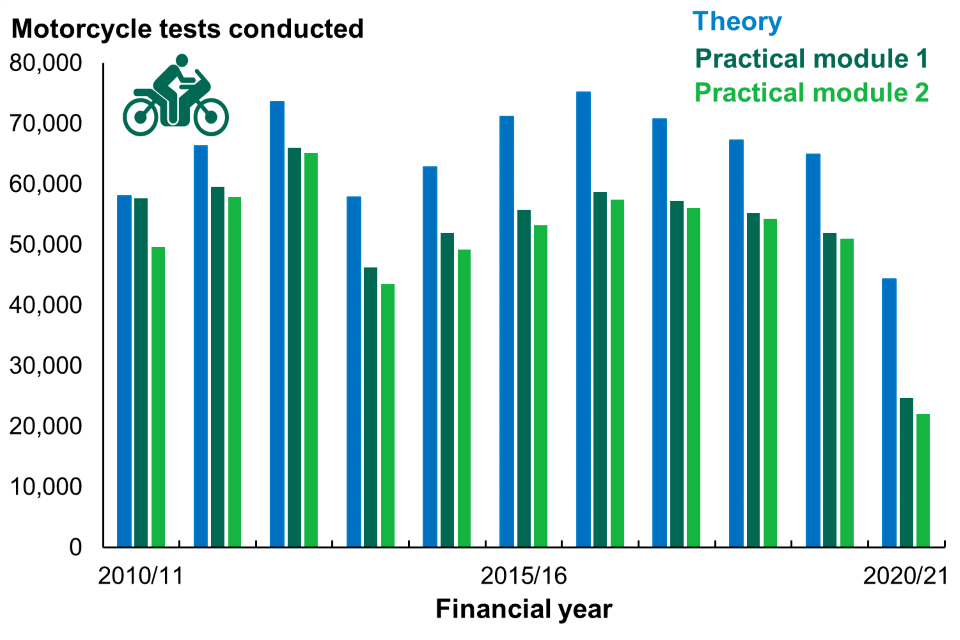
This chart shows the number of motorcycle tests conducted by test type, annually, from year-ending March 2011 to year-ending March 2021.
Figure 5 shows that there has been a large annual reduction in the number of motorcycle tests conducted for the year-ending March 2021 due to the disruption from the coronavirus (COVID-19). There was a larger year-on-year decrease in the number of practical tests conducted (52.5% and 56.8% for module 1 and module 2 respectively) from the year-ending March 2020, compared with theory tests conducted which fell by 31.8% over the same period.
Figure 6: Motorcycle test pass rate by test type, Great Britain, annually, year-ending March 2011 to year-ending March 2021 (DRT0101), (DRT0102)
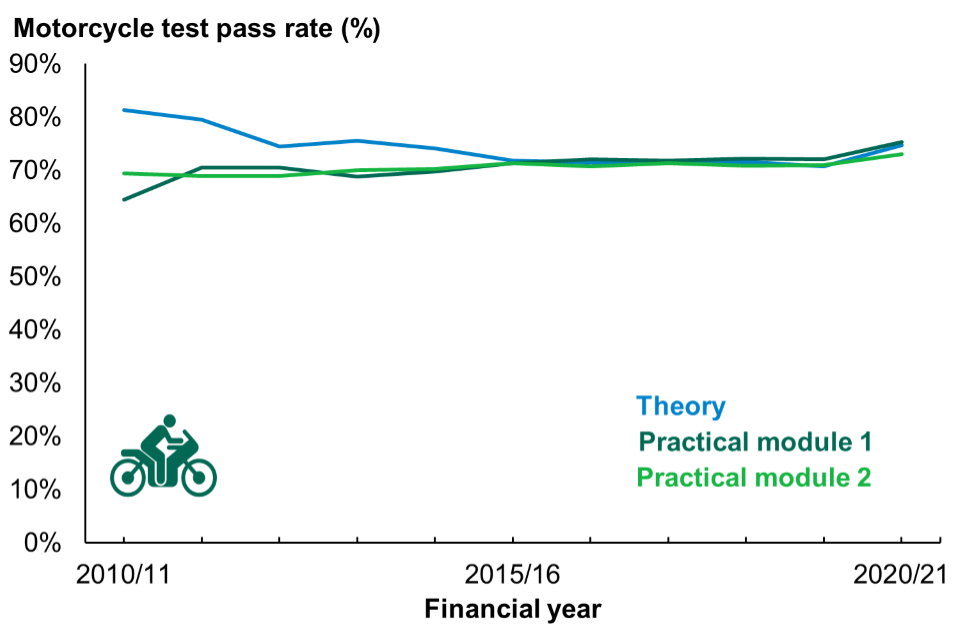
This chart shows motorcycle test pass rates by test type, annually, from year-ending March 2011 to year-ending March 2021..
Motorcycle test pass rates converged between the year-ending March 2011 and the year-ending March 2016, before maintaining similar levels until the year-ending March 2021, when increases in pass rates were seen across all motorcycle tests (Figure 6).
In the year-ending March 2021, the motorcycle theory pass rate was 74.7% and was within the range of theory pass rates seen prior to the year-ending March 2016, whilst practical pass rates were 75.3% and 73.0% for module 1 and module 2 respectively, the highest for both since the series began in the year-ending March 2010. Compared to the year-ending March 2020, the pass rate increased by 4.0 percentage points for theory tests, 3.2 percentage points for practical module 1, and 2.0 percentage points for practical module 2 (Table 2).
Table 2: Motorcycle tests by test type, Great Britain: year-ending March 2021, year-ending March 2020 and year on year change (year-ending March 2021 compared to year-ending March 2020) (DRT0101), (DRT0102)
| Motorcycle test type | Tests conducted (year-ending March 2021) | Tests passed (year-ending March 2021) | Pass rate (%) (year-ending March 2021) | Tests conducted (year-ending March 2020) | Tests passed (year-ending March 2020) | Pass rate (%) (year-ending March 2020) | Tests conducted (year on year percentage change) | Tests passed (year on year percentage change) | Pass rate (year on year percentage point change) |
|---|---|---|---|---|---|---|---|---|---|
| Theory | 44,301 | 33,085 | 74.7 | 64,924 | 45,893 | 70.7 | -31.8% | -27.9% | 4.0 |
| Practical module 1 | 24,670 | 18,585 | 75.3 | 51,921 | 37,432 | 72.1 | -52.5% | -50.3% | 3.2 |
| Practical module 2 | 22,012 | 16,078 | 73.0 | 50,993 | 36,205 | 71.0 | -56.8% | -55.6% | 2.0 |
Tables relating to the number of motorcycle practical tests: (DRT0401 to DRT0423). Tables relating to the number of motorcycle theory tests (DRT5401 to DRT5403)
Large Goods Vehicle (LGV) theory and practical tests
To obtain a licence to drive a LGV on the road (a ‘vocational’ licence), a candidate must pass two theory tests (multiple choice and hazard perception) and a practical (vocational) test. To drive a LGV professionally, it has been necessary to hold a Certificate of Professional Competence (CPC) since September 2009. This requires an additional theory (case study) and practical (safety demonstration) test.
Professional drivers already holding a vocational LGV licence before September 2009 qualified for the Driver CPC automatically under ‘acquired rights’. All professional drivers must also do 35 hours periodic training every 5 years to retain their CPC.
Figure 7: LGV tests conducted by test type, Great Britain, annually, year-ending March 2011 to year-ending March 2021) (DRT0101), (DRT0102)
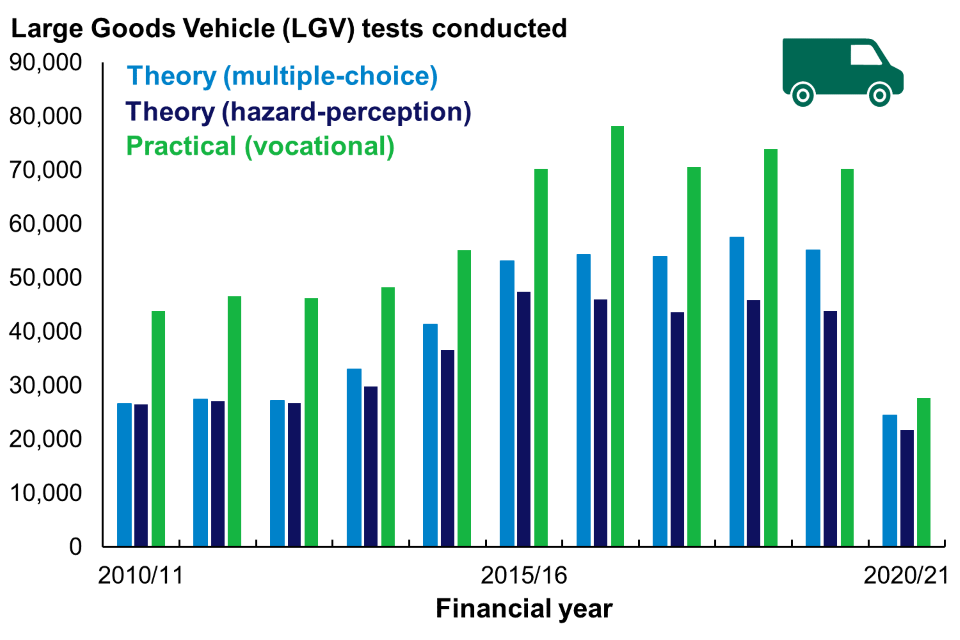
This chart shows the number of LGV tests conducted by test type, annually, from year-ending March 2011 to year-ending March 2021.
Due to the impact of the coronavirus (COVID-19), in the year-ending March 2021, saw a large drop in the number of tests conducted in Great Britain across all LGV tests (Figure 7). The number of practical (vocational) tests conducted was 27,630, the lowest ever recorded in the series (began in the year-ending March 2009). However, both theory test levels (24,477 and 21,784 for the multiple-choice and hazard perception tests respectively) were comparable to those observed at the beginning of the decade (year-ending March 2011 to year-ending March 2013) (Table 3).
Figure 8: LGV test pass rates by test type, Great Britain, annually, year-ending March 2011 to year-ending March 2021 (DRT0101), (DRT0102)
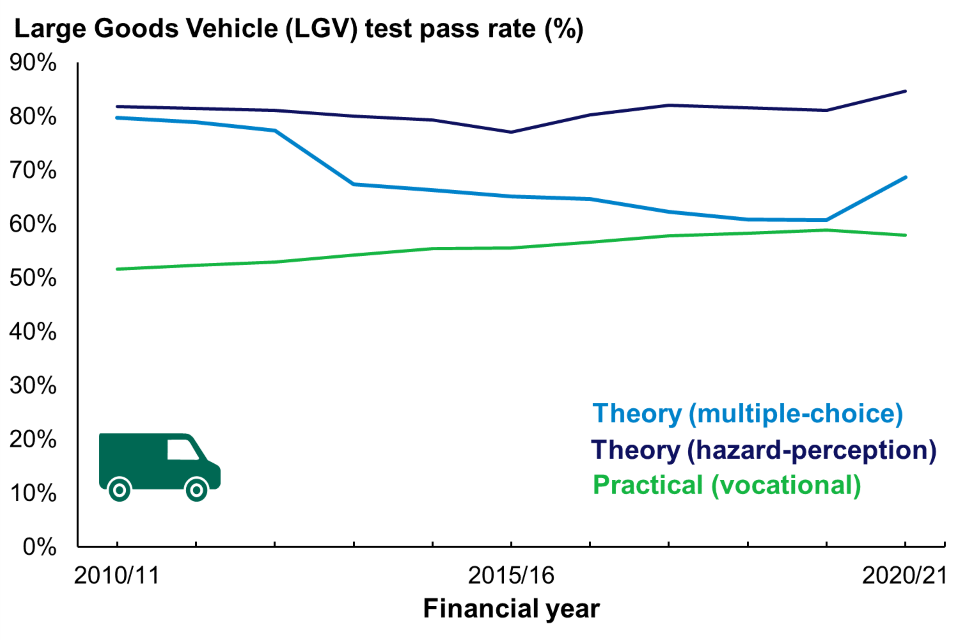
This chart shows LGV test pass rates by test type, annually: year-ending March 2011 to year-ending March 2021.
In the year-ending March 2021, LGV pass rates saw increases from the year-ending March 2020 of 7.9 percentage points to 68.7% for the multiple-choice test and 3.6 percentage points to 84.7% for the hazard-perception test. However, the practical (vocational) test pass rate dropped 1.0 percentage point compared with the year-ending March 2020 to 58.0% (Figure 8).
Table 3: LGV tests by test type, Great Britain: year-ending March 2021, year-ending March 2020 and year on year change (year-ending March 2021 compared to year-ending March 2020) (DRT0101), (DRT0102)
| LGV test type | Tests conducted (year-ending March 2021) | Tests passed (year-ending March 2021) | Pass rate (%) (year-ending March 2021) | Tests conducted (year-ending March 2020) | Tests passed (year-ending March 2020) | Pass rate (%) (year-ending March 2020) | Tests conducted (year on year percentage change) | Tests passed (year on year percentage change) | Pass rate (year on year percentage point change) |
|---|---|---|---|---|---|---|---|---|---|
| Theory - multiple choice | 24,477 | 16,807 | 68.7 | 55,110 | 33,469 | 60.7 | -55.6% | -49.8% | 7.9 |
| Theory - hazard perception | 21,784 | 18,456 | 84.7 | 43,882 | 35,612 | 81.2 | -50.4% | -48.2% | 3.6 |
| Theory - CPC | 14,160 | 10,428 | 73.6 | 33,510 | 23,069 | 68.8 | -57.7% | -54.8% | 4.8 |
| Practical - vocational | 27,630 | 16,022 | 58.0 | 70,288 | 41,434 | 58.9 | -60.7% | -61.3% | - 1.0 |
| Practical - CPC | 2,066 | 1,952 | 94.5 | 9,148 | 8,552 | 93.5 | -77.4% | -77.2% | 1.0 |
Tables relating to LGV practical tests, both vocational and CPC: (DRT0501 to DRT0503).
Tables relating to LGV theory tests, including CPC (DRT5501 to DRT5504).
Passenger Carrying Vehicle (PCV) theory and practical tests
To obtain a licence to drive a PCV on the road (a ‘vocational’ licence), a candidate must pass two theory tests (multiple choice and hazard perception) and a practical (vocational) test. To drive a PCV professionally, it has been necessary to hold a Certificate of Professional Competence (CPC) since September 2008.
This requires an additional theory (case study) and practical (safety demonstration) test. Professional drivers already holding a vocational PCV licence before September 2008 qualified for the Driver CPC automatically under ‘acquired rights’. All professional drivers must also do 35 hours periodic training every 5 years to retain their CPC.
Figure 9: PCV tests conducted by test type, Great Britain, annually, year-ending March 2011 to year-ending March 2021 (DRT0101), (DRT0102)
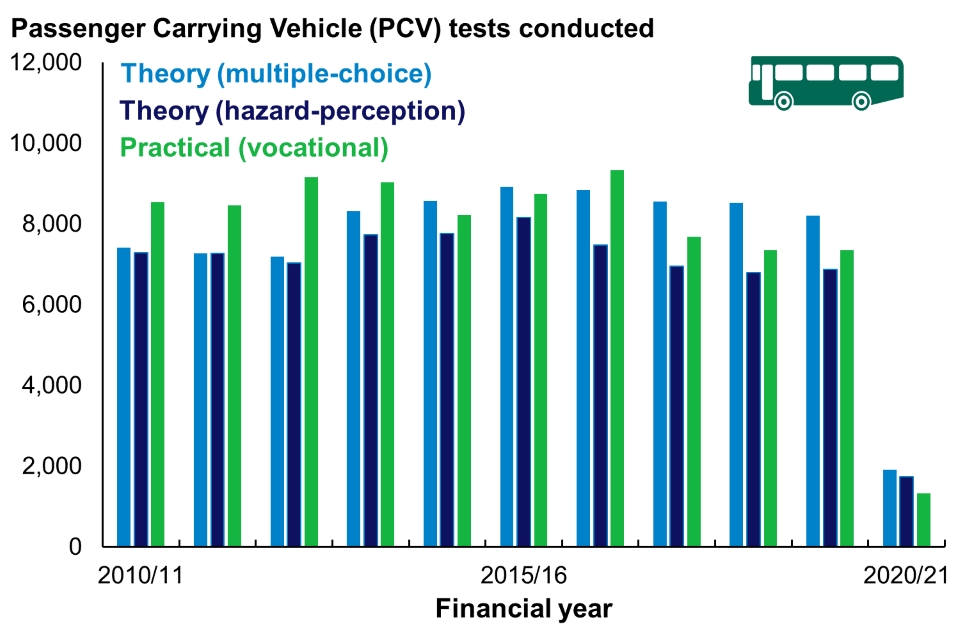
This chart shows the number of PCV tests conducted by test type, annually, from year-ending March 2011 to year-ending March 2021..
Figure 9 shows a large reduction in all PCV tests for the year-ending March 2021, following disruption due to the coronavirus (COVID-19). Figures for all the year-ending March 2021, PCV tests are the lowest ever seen in the series (which began in the year-ending March 2010), with 1,330 practical (vocational) tests conducted, 1,922 multiple-choice tests conducted and 1,746 hazard-perception tests conducted.
Out of all the test types, PCV tests saw the biggest percentage decrease in tests conducted from the year-ending March 2020, with the number of tests conducted falling by 81.9% for practical (vocational) tests and reductions of 76.6% and 74.6% seen for the multiple-choice and hazard-perception tests respectively.
Figure 10: PCV test pass rates by test type, Great Britain, annually, year-ending March 2011 to year-ending March 2021 (DRT0101), (DRT0102)

This chart shows PCV test pass rates by test type, annually: year-ending March 2011 to year-ending March 2021..
An increase in test pass rates from the year-ending March 2020 to the year-ending March 2021 was seen for the PCV theory tests by 1.9 percentage points to 64.8% for the multiple-choice test and 2.0 percentage points to 81.8% for the hazard perception test (Figure 10). However, the practical (vocational) test pass rate decreased by 4.3 percentage points from the year-ending March 2020 to 55.6% in the year-ending March 2021.
Table 4: PCV tests by test type, Great Britain: year-ending March 2021, year-ending March 2020 and year on year change (year-ending March 2021 compared to year-ending March 2020) (DRT0101), (DRT0102)
| PCV test type | Tests conducted (year-ending March 2021) | Tests passed (year-ending March 2021) | Pass rate (%) (year-ending March 2021) | Tests conducted (year-ending March 2020) | Tests passed (year-ending March 2020) | Pass rate (%) (year-ending March 2020) | Tests conducted (year on year percentage change) | Tests passed (year on year percentage change) | Pass rate (year on year percentage point change) |
|---|---|---|---|---|---|---|---|---|---|
| Theory - multiple choice | 1,922 | 1,245 | 64.8 | 8,210 | 5,164 | 62.9 | -76.6% | -75.9% | 1.9 |
| Theory - hazard perception | 1,746 | 1,428 | 81.8 | 6,874 | 5,487 | 79.8 | -74.6% | -74.0% | 2.0 |
| Theory - CPC | 1,341 | 648 | 48.3 | 5,334 | 2,809 | 52.7 | -74.9% | -76.9% | - 4.3 |
| Practical - vocational | 1,330 | 740 | 55.6 | 7,345 | 4,404 | 60.0 | -81.9% | -83.2% | - 4.3 |
| Practical - CPC | 83 | 75 | 90.4 | 1,478 | 1,348 | 91.2 | -94.4% | -94.4% | - 0.8 |
Tables relating to PCV practical tests, including both vocational and CPC: (DRT0601 to DRT0603).
Tables relating to PCV theory tests, including CPC (DRT5601 to DRT5604).
Total theory and practical tests
Total theory and total practical test figures exclude CPC tests and ADI (Approved Driving Instructor) tests.
In the year-ending March 2021, total test figures for both theory and practical tests across all test types were heavily impacted by the coronavirus (COVID-19). Overall, 985,509 theory tests and 512,994 practical tests were conducted in Great Britain in the year-ending March 2021, which are reductions of 51.8% and 71.2% respectively compared to the year-ending March 2020 (Table 5).
Table 5: Total practical and theory tests (excluding CPC and ADI tests), Great Britain: year-ending March 2021, year-ending March 2020 and year on year change (year-ending March 2021 compared to year-ending March 2020) (DRT0101), (DRT0102)
| Total (excluding CPC and ADI) | Tests conducted (year-ending March 2021) | Tests passed (year-ending March 2021) | Pass rate (%) (year-ending March 2021) | Tests conducted (year-ending March 2020) | Tests passed (year-ending March 2020) | Pass rate (%) (year-ending March 2020) | Tests conducted (year on year percentage change) | Tests passed (year on year percentage change) | Pass rate (year on year percentage point change) |
|---|---|---|---|---|---|---|---|---|---|
| Theory | 985,509 | 567,681 | 57.6 | 2,044,740 | 1,004,528 | 49.1 | -51.8% | -43.5% | 8.5 |
| Practical | 512,994 | 269,232 | 52.5 | 1,780,113 | 854,075 | 48.0 | -71.2% | -68.5% | 4.5 |
Figure 11 shows the varied impact of the coronavirus (COVID-19) on different test types for the number of tests conducted, with a greater reduction for practical tests compared with theory tests. Motorcycle tests decreased by the smallest percentage, whilst the biggest difference was seen in PCV tests.
Figure 11: Annual percentage change (year-ending March 2021 compared to year-ending March 2020) in tests conducted by test type (DRT0101), (DRT0102)
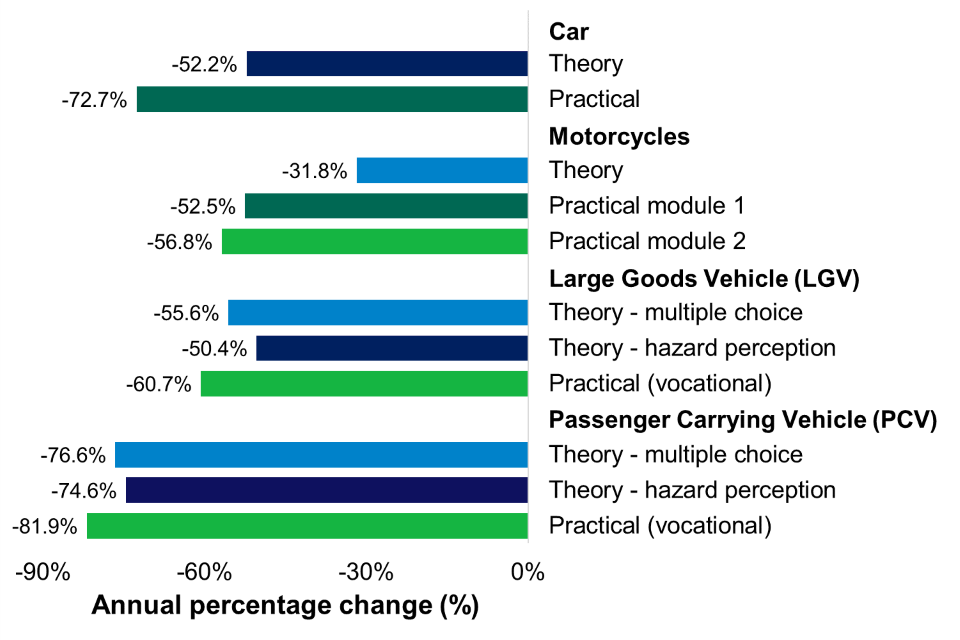
This chart shows the annual percentage change (year-ending March 2021 compared to year-ending March 2020) in tests conducted by test type.
Compared to the year-ending March 2020, pass rates for total theory tests increased by 8.5 percentage points from the year-ending March 2020 to 57.6% in the year-ending March 2021, whilst total practical test pass rates rose by 4.5 percentage points from the year-ending March 2020 to 52.5% in the year-ending March 2021 (Table 7).
Figure 12 illustrates that the percentage point changes in pass rates were smaller for practical tests compared with theory tests, with the practical (vocational tests) LGV and PCV being the only tests with lower pass rates in the year ending March 2021 compared to the year-ending March 2020.
Figure 12: Annual percentage point change (year-ending March 2021 compared to year-ending March 2020) in pass rate (percent) by test type (DRT0101), (DRT0102)
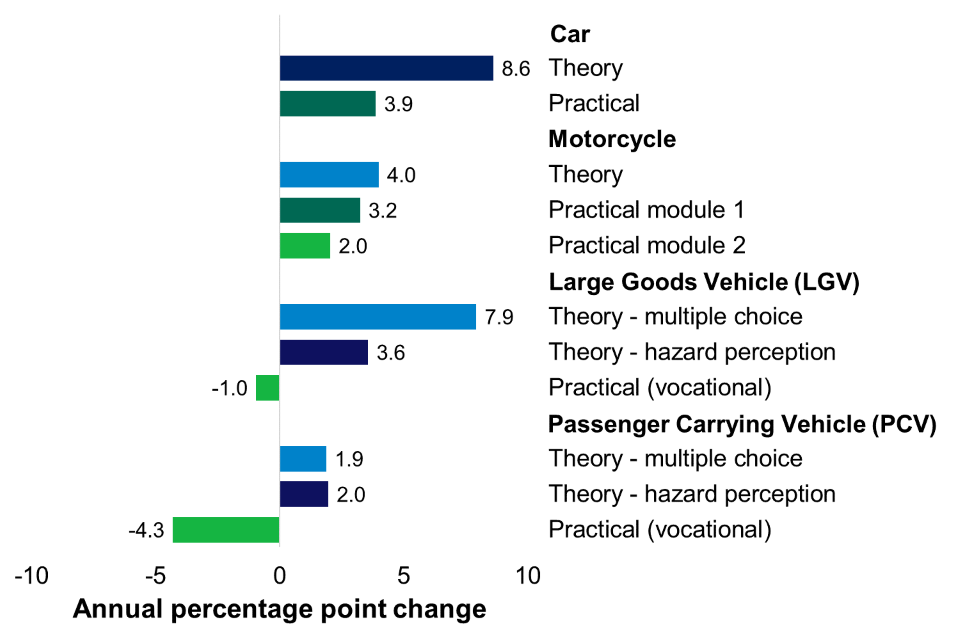
This chart shows the annual percentage point change (year-ending March 2021 compared to year-ending March 2020) in pass rate (%) by test type.
Figures for total practical tests can be found in (DRT0101) and figures for total theory tests can be found in (DRT0102).
Driving instructors and motorcycle instructors
An Approved Driving Instructor (ADI) is someone who has passed their ADI tests and has been added to the ADI statutory register. There are 3 parts of the ADI test:
- theory (part 1)
- driving ability (part 2)
- instructional ability (part 3)
Prospective instructors must pass all 3 parts of the ADI tests to be approved and registered. ADIs must undergo a standards check during each 4-year registration period.
Most learner motorcycle and moped riders must take Compulsory Basic Training (CBT) before riding on the road. CBT motorcycle instructors are required to pass a 2-day DVSA assessment and then work for a motorcycle Approved Training Body (ATB). CBT instructors must also undergo tests every 4 years.
Table 6: Number of ADIs on statutory register and number of approved CBT instructors, end-March 2021, end-March 2020 and year and year change (end-March 2021 compared to end-March 2020) (INS0101), (INS0501)
| Number of driving instructors | End-March 2021 | End-March 2020 | Year on year percentage change |
|---|---|---|---|
| ADIs on statutory register | 38,370 | 39,531 | -2.9% |
| Approved CBT instructors | 2,054 | 2,056 | -0.1% |
At the end of March 2021, there were:
- 38,370 ADIs on the statutory register
- 2,054 approved CBT motorcycle instructors
Compared to March 2020 (Table 6), this was a decrease of:
- 2.9% for ADIs
- 0.1% for CBTs
Figure 13: ADI tests conducted by test type, Great Britain, annually, year-ending March 2011 to year-ending March 2021 (DRT0101), (DRT0102)
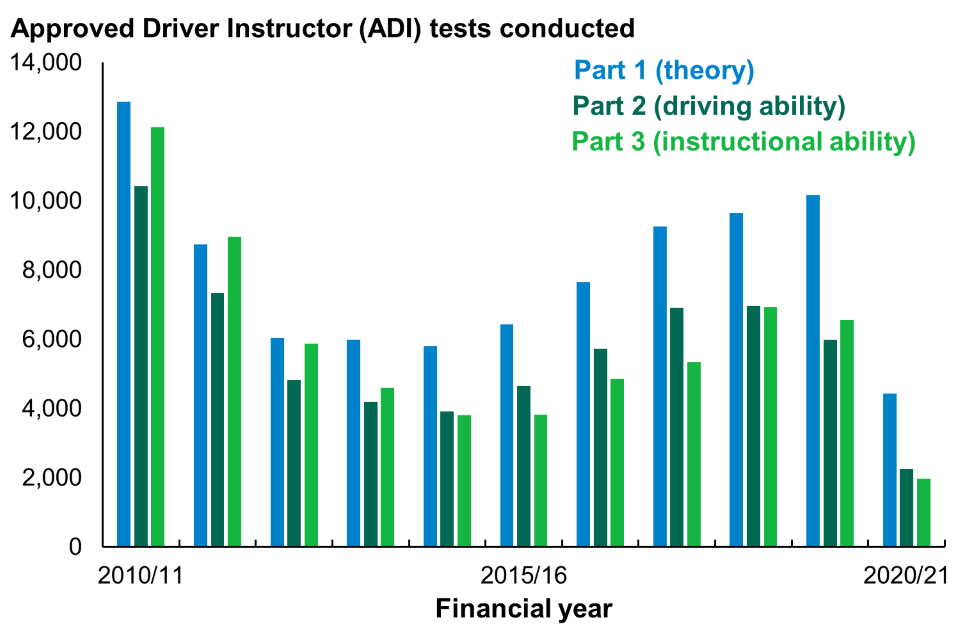
This chart shows the number of ADI tests conducted by test type, annually, year-ending March 2011 to year-ending March 2021.
Figure 13 illustrates that there was a steady increase in the number of ADI tests conducted from the year-ending March 2015 until the year-ending March 2021, when disruption from the coronavirus (COVID-19) resulted in a substantial fall in the number of tests (Table 7), conducted to:
- 4,431 for part 1 (theory)
- 2,246 for part 2 (driving ability)
- 1,983 for part 3 (instructional ability)
Figure 14: ADI test pass rates by test type, Great Britain, annually, year-ending March 2011 to year-ending March 2021 (DRT0101), (DRT0102)
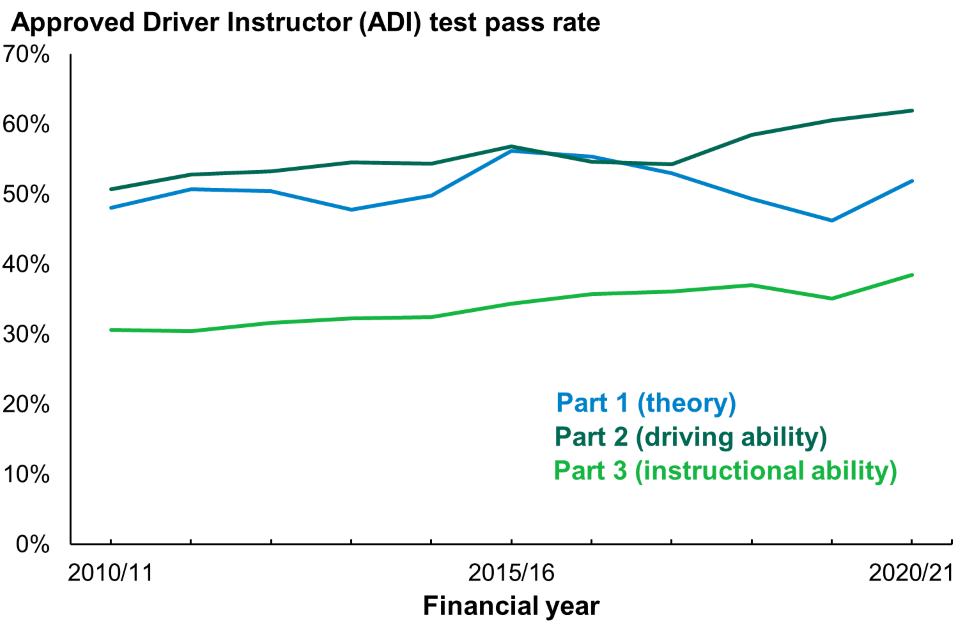
This chart shows ADI test pass rates by test type, annually: year-ending March 2011 to year-ending March 2021.
Figure 14 shows that pass rates increased across all 3 parts of the ADI test from year-ending March 2020 to year-ending March 2021 (Table 4), by:
- 5.7 percentage points to 46.2% for part 1 (theory)
- 1.3 percentage points to 62.0% for part 2 (driving ability)
- 3.4 percentage points for 35.1 for part 3 (instructional ability)
Table 7: ADI tests by test type, Great Britain: year-ending March 2021, year-ending March 2020, and year on year change (year-ending March 2021 compared to year-ending March 2020) (DRT0101), (DRT0102)
| ADI test type | Tests conducted (year-ending March 2021) | Tests passed (year-ending March 2021) | Pass rate (%) (year-ending March 2021) | Tests conducted (year-ending March 2020) | Tests passed (year-ending March 2020) | Pass rate (%) (year-ending March 2020) | Tests conducted (year on year percentage change) | Tests passed (year on year percentage change) | Pass rate (year on year percentage point change) |
|---|---|---|---|---|---|---|---|---|---|
| Part 1 (theory) | 4,431 | 2,300 | 51.9 | 10,162 | 4,698 | 46.2 | -56.4% | -51.0% | 5.7 |
| Part 2 (driving ability) | 2,246 | 1,392 | 62.0 | 5,983 | 3,628 | 60.6 | -62.5% | -61.6% | 1.3 |
| Part 3 (instructional ability) | 1,983 | 764 | 38.5 | 6,559 | 2,301 | 35.1 | -69.8% | -66.8% | 3.4 |
Since 7 April 2014, ADIs have been required to undertake a standards check where they will receive a Grade A, Grade B or Fail result.
The Grades of ADIs statistics (INS0102) represent a snapshot of the latest grade held by current instructors. They cannot be compared with the total number of check tests conducted, which includes tests taken by some instructors more than once.
Tables relating to ADI tests conducted:
- (DRT5701) (part 1 – theory),
- (DRT0701) (part 2 – driving ability),
- (DRT0721) (part 3 – instructional ability).
Tables relating to the number of ADIs (INS0101 to INS0103).
Tables relating to CBT and Incident Statistics (INS0501 to INS0504).
Background information
About these statistics
This statistical release is published by the Department for Transport based on statistics produced by the DVSA, which administers the driving test and training schemes in Great Britain. The driver and rider tests and instructors collection provides further detail of the key findings presented in this statistical release, including detailed data tables and operational data by test centre.
Practical test categories included are:
- B (car),
- A, A1 and A2 (motorcycles)
- C1 (medium-sized vehicles)
- C1E (medium-sized vehicles with a trailer)
- C (large vehicles)
- CE (large vehicles with a trailer)
- D1 (minibuses)
- D1E (minibuses with a trailer)
- D (buses)
- DE (buses with a trailer)
To gain a category CE licence, a driver must hold a category C licence before taking the test, whilst a category D licence is required before acquiring a category DE licence.
The data are being provided simply for information as they are frequently requested under the Freedom of Information Act.
Key terms
Table 8a: Key terms for dates
| Key term | Definition |
|---|---|
| year-ending March 2021 | Financial year from 1 April 2020 to 31 March 2021 |
| year-ending March 2020 | Financial year from 1 April 2019 to 31 March 2020 |
| Quarter 1 | Financial quarter 1 (April to June) |
| Quarter 2 | Financial quarter 2 (July to September) |
| Quarter 3 | Financial quarter 3 (October to December) |
| Quarter 4 | Financial quarter 4 (January to March) |
Table 8b: Key terms for test types
| Key term | Definition |
|---|---|
| Certificate of Professional Competence (CPC) | To drive a LGV (Large Goods Vehicle) or PCV (Passenger Carrying Vehicle) professionally, it is necessary to hold a Certificate of Professional Competence (CPC). This requires an additional theory (case study) and practical (safety demonstration) test. Professional drivers already holding a vocational LGV licence before September 2009 or vocational PCV licence before September 2008 qualified for the Driver CPC automatically under ‘acquired rights’. |
| Total theory tests | Total theory test figures are the sum of the following theory tests: - car - motorcycle - LGV multiple-choice - LGV hazard-perception - PCV multiple-choice - PCV hazard-perception. Total test figures do not include CPC tests or Approved Driving Instructor (ADI) tests. |
| Total practical tests | Total practical test figures are the sum of the following practical tests: - car - motorcycle module 1 (off-road) - motorcycle module 2 (on-road) - LGV vocational - PCV vocational. Total test figures do not include CPC tests or Approved Driving Instructor (ADI) tests. |
LGV and PCV vocational and CPC test differences
LGV and PCV practical vocational test figures are always higher than the corresponding CPC practical test figure, as CPC tests are only required to drive these vehicles professionally. Non-commercial use of these vehicles might include, for example, driving a horse box.
Official Statistics
Official Statistics are produced to the high professional standards set by the Code of Practice for Statistics. However, these statistics have not yet been assessed by the Office for Statistics Regulation.
Details of ministers and officials who receive pre-release access to these statistics up to 24 hours before release can be found in the pre-release access list.
Ethnicity information
Additional data on ethnicity of candidates are released via www.data.gov.uk. This information is not published as part of the statistical release as many candidates do not declare their ethnicity. It is, therefore, highly likely that the information is subject to self-selection and reporting biases and neither DVSA nor DfT would recommend that users rely on these data being a true reflection of the ethnicity of all candidates.
Release of DfT statistics publications
To hear more about DfT statistics publications as they are released, please follow us on Twitter via our @DfTstats account.
Further information
Responsible statistician: Stephen Reynolds
Author: Jeni Martin
Media: 020 7944 3066
Public: 020 7944 3077
Email: Vehicles Statistics
Next release
Driver and rider testing and instructor statistics are published quarterly as tables, with an annual statistical release.
The next set of statistical tables are due to be published in September 2021, covering the period up to the end of June 2021, with the next annual release in June 2022.