DCMS Sectors Economic Estimates: Employment percentage measure Technical Report
Published 8 July 2021

© Crown copyright 2021
This publication is licensed under the terms of the Open Government Licence v3.0 except where otherwise stated. To view this licence, visit nationalarchives.gov.uk/doc/open-government-licence/version/3 or write to the Information Policy Team, The National Archives, Kew, London TW9 4DU, or email: psi@nationalarchives.gov.uk.
Where we have identified any third party copyright information you will need to obtain permission from the copyright holders concerned.
This publication is available at https://www.gov.uk/government/statistics/dcms-sectors-economic-estimates-employment-percentage-measure/dcms-sectors-economic-estimates-employment-percentage-measure-technical-report
This document covers the following topics:
- an overview of the content covered in the statistical tables ‘DCMS Economic Estimates: Percentage of all 16-64 year-olds with a main job in the DCMS Sectors (excl. Tourism): United Kingdom (UK), 2019 & 2020’, also known as the ‘Employment percentage measure’.
- an overview of DCMS Sectors, how they are defined, and limitations of these definitions
- the methodology underlying the statistical release, including data sources
- the processes used to check that the estimates have been produced correctly
- other sources of information for the DCMS sectors
- further information, including contact details for DCMS statisticians.
1. Overview of release
This is the technical report for the statistics release ‘DCMS Economic Estimates: Percentage of all 16-64 year-olds with a main job in the DCMS Sectors (excl. Tourism): UK, 2019 & 2020. This is defined as the number of people aged 16-64 whose main employment was in the DCMS sectors, divided by the total 16-64 year-old population.
This is the first release of its kind for the DCMS sectors and is an interim publication produced to meet user needs for timely employment statistics. Typically, DCMS publishes employment statistics which look at the number of jobs in DCMS sectors, rather than percentages of the population with a main job in the DCMS sectors. However, estimates on number of jobs have been paused until later in 2021, pending a necessary re-weighting of the underlying datasets for periods affected by the coronavirus (COVID-19) outbreak. Percentages of the population with a main job in the DCMS sectors, by contrast, are less affected by this re-weighting and can continue to be published currently. This is in line with ONS advice on the data, as the data owners.
These statistics are further broken down by employee/self-employed, and the demographics of sex and region of residence. The calculations are based on international classifications (Standard Industrial Classification (SIC) codes).
Data are available for each DCMS sector (excluding Tourism) and subsectors within the Creative Industries, Digital Sector, and Cultural Sector. There is significant overlap between DCMS Sectors so users should be aware that the estimate for “DCMS Sectors Total” is lower than the sum of the individual sectors. The time periods covered are:
- January 2019 to December 2019
- October 2019 to September 2020
- January 2020 to December 2020
The estimates methodology in the publication are consistent with national (UK) estimates, published by the Office for National Statistics (ONS). However, they use different datasets, so the DCMS published figures will not be exactly the same as the ONS ones.
1.1 Code of Practice for Statistics
DCMS Economic Estimates: Percentage of all 16-64 year-olds with a main job in the DCMS Sectors (excl. Tourism): UK, 2019 & 2020 is an experimental official statistic and has been produced to the standards set out in the Code of Practice for Statistics. They are classed as experimental as it is the first time DCMS has published estimates of the proportion of people employed in DCMS sectors.
1.2 Users
The users of these statistics fall into five broad categories:
- Ministers and other political figures
- Policy and other professionals in DCMS and other Government departments
- Industries and their representative bodies
- Charitable organisations
- Academics
The primary use of these statistics is to monitor the performance of the industries in the DCMS sectors, helping to understand how current and future policy interventions can be most effective.
2. Sector definitions
2.1 Overview of DCMS Sectors
Main sector definitions
The sectors for which DCMS has responsibility are:
- Civil Society
- Creative Industries
- Cultural Sector
- Digital Sector
- Gambling
- Sport
- Telecoms
- Tourism
In order to measure the economic impact of a sector it is important to be able to define it. DCMS uses a range of definitions based on International or UK agreed definitions. All definitions are based on the Standard Industrial Classification 2007 (SIC) codes. This means nationally consistent sources of data can be used and enables international comparisons.
Individual sector definitions were developed in isolation as the department’s remit expanded. This has led to overlap between DCMS sectors. For example, the Cultural Sector is defined using SIC codes that are nearly all within the Creative Industries, whilst the Telecoms Sector is completely within the Digital Sector.
Figure 1 (below) shows the overlap between DCMS Sectors in terms of SIC codes. Users should note that this does not give an indication of the magnitude of the overlap.
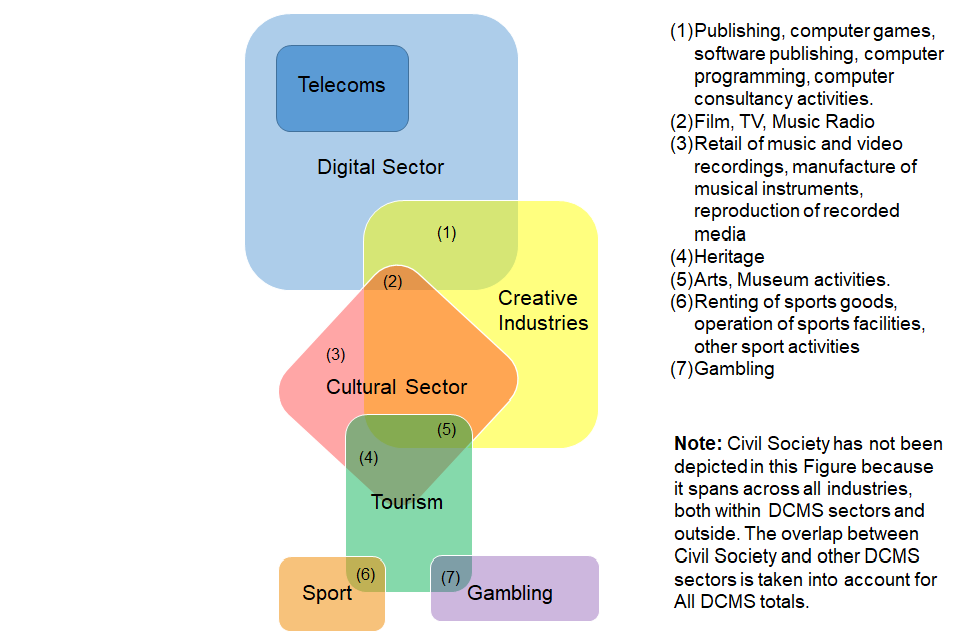
Chart showing how the SIC codes overlap within the DCMS sectors, where a SIC code can be both Creative and Digital (e.g.). The chart is on the left-hand-side, accompanied by a written list and note.
2.2 Details and limitations of sector definitions
This section looks at sector definitions in more detail, and provides an overview of limitations.
There are substantial limitations to the underlying classifications. As the balance and make-up of the economy changes, the SIC, finalised in 2007, is less able to provide the detail for important elements of the UK economy related to DCMS Sectors. The SIC codes used to produce these estimates are a ‘best fit’, subject to the limitations described in the following section.
Civil Society
In July 2016, DCMS took on responsibility for the Office for Civil Society (renamed Civil Society and Youth in January 2021), which covers charities, voluntary organisations or trusts, social enterprises, mutuals and community interest companies. The Civil Society sector is not like a traditional industry and therefore data are not readily available in the usual data sources.
For employment, the civil society sector is defined as those working for a charity or voluntary organisation.
Creative Industries
The Creative Industries were defined in the Government’s 2001 Creative Industries Mapping Document as “those industries which have their origin in individual creativity, skill and talent and which have a potential for wealth and job creation through the generation and exploitation of intellectual property”.
To allow the Creative Industries to be measured, DCMS worked with others to develop a statistical definition of the Creative Industries which reflects this definition. DCMS uses a “Creative Intensity” to determine which industries (at 4 digit SIC) are Creative. The Creative Intensity is the proportion of occupations in an industry that are creative and, if the intensity is above a set threshold, that industry is typically defined as Creative. More information can be found in this 2016 methodology document.
Cultural Sector
There are significant limitations to the DCMS measurement of the cultural sector arising from the lack of detailed disaggregation possible using the standard industrial classifications. There are many cases where culture forms a small part of an industry classification and therefore cannot be separately identified and assigned as culture using standard data sources. DCMS consulted on the definition of the Cultural sector and published a response in April 2017.
It is recognised that, due to the limitations associated with SIC codes, the SIC code used in past publications as a proxy for the Heritage sector (91.03 - Operation of historical sites and building and similar visitor attractions) is likely to be an underestimate of this sector’s value. We have changed the name of the Heritage sector to ‘Operation for historical sites and similar visitor attractions’ to reflect this.
Digital Sector
The definition of the Digital sector used by DCMS is based on the OECD definition of the ‘information society’. This is a combination of the OECD definition for the “ICT sector” as well as including the definition of the “content and media sector”. An overview of the SIC codes included in each of these sectors is available in the OECD Guide to Measuring the Information Society 2011 (see Box 7.A1.2 on page 159 and Box 7.A1.3 on page 164).
This definition used for the Digital Sector does not allow consideration of the value added of “digital” to the wider economy e.g. in health care or construction. DCMS policy responsibility is for digital across the economy and therefore this is a significant weakness in the current approach.
Gambling
The definition of gambling used in the DCMS Sectors Economic Estimates is consistent with the internationally agreed definition, SIC 92, Gambling and betting activities.
Sport
The main definition of sport used in the release is based on the EU agreed core/statistical Vilnius definition, which includes only SIC codes which are predominately sport.
Tourism
Tourism estimates are calculated based on the Tourism Satellite Account, which looks at the GVA and employment directly attributable to the Tourism sector. Rather than assigning the entire output of some SIC codes to the Tourism sector, it assesses the proportion of activity across the economy that is directly attributable to tourism, and uses these proportions to calculate direct estimates. As there is currently no data for Tourism in 2020, estimates for Tourism have not been provided in these statistics.
3. Methodology
3.1 Method
The employment statistics are calculated using the Office for National Statistics (ONS) Annual Population Survey (APS). The APS survey is completed by households, who are asked if they are currently in work and details subsequently reported. These details include the sector of work, earnings, and demographic information including region of work, nationality, age, ethnicity etc. Individuals who respond are ascribed a weight, so that survey replies can be scaled up to provide estimates for the population it aspires to be representative of.
For DCMS, we receive these fields after some cleaning set out below. We then aggregate the weights for those who are in work and aged 16-64 by the SIC code of their main job. The overall weights for the relevant SIC codes are summed to produce sector and subsector totals. These are divided by the sum of the weights of all those aged 16-64 in work to get the estimated proportion of total employment accounted for by each sector or subsector.
As part of the aggregation process we also apply disclosure control measures to prevent the identification of any respondents. Where the number of respondents for a cell is below a set threshold the value is suppressed. Double and triple suppression are also applied where necessary to stop disclosure via, for example, subtracting figures from the total, also known as disclosure via differencing.
3.2 Statistics by demographic breakdowns, including changes in this release
As mentioned above, the Annual Population Survey enables demographic breakdowns of statistics.
Typically, DCMS Sector employment statistics include a variety of demographic breakdowns, including age, sex, region of work, nationality, ethnicity, disability and highest qualification. However, for this release, the demographic breakdowns have been focused on sex and region of residence. This is in line with ONS guidance pending the re-weighting (which affects several demographic variables – for example nationality and ethnicity), and in order to provide a more streamlined, prioritised set of outputs to users to a deadline.
3.3 Summary of data sources
In summary, the data presented in this release:
- are based on official statistics data sources
- are based on internationally-harmonised codes
- are based on survey data and, as with all data from surveys, there will be an associated error margin surrounding these estimates[footnote 1]
This means the estimates are:
- comparable at both a national and international level.
- comparable over time, allowing trends to be measured and monitored
However, this also means the estimates are subject to limitations of the underlying classifications of the make-up of the UK economy. For example, the standard industrial classification (SIC) codes were developed in 2007 and have not been revised since. Emerging sectors, such as Artificial Intelligence, are therefore hard to capture and may be excluded or mis-coded.
4. Quality assurance processes
This document summarises the quality assurance processes applied during the production of these statistics by our data providers, the Office for National Statistics (ONS), as well as those applied by DCMS.
4.1 Quality assurance processes at ONS
Quality assurance at ONS takes place at a number of stages. The various stages and the processes in place to ensure quality for the data sources are outlined below. It is worth noting that information presented here on the data sources are taken from the Annual Population Survey Quality Methodology Information (QMI) and should be credited to colleagues at the ONS.
4.2 ONS Annual Population Survey
The Annual Population Survey (APS) is a continuous household survey, covering the UK. The topics covered include employment and unemployment, as well as information on housing, ethnicity, religion, health and education.
The purpose of the APS is to provide information on important social and socio-economic variables at local levels. The published statistics enable monitoring of estimates between censuses for a range of policy purposes and provide local area information for labour market estimates. The APS is not a stand-alone survey, but uses data combined from two waves of the main Labour Force Survey (LFS) with data collected on a local sample boost.
Sampling Frame
The sampling frame for the survey in Great Britain is the Royal Mail Postcode Address File (PAF) and the National Health Service (NHS) communal accommodation list. Due to the very low population density in the far north of Scotland (north of the Caledonian Canal), telephone directories are used as sampling frames. A systematic sample is drawn each quarter from these three sampling bases, and as the PAF is broken down geographically, the systematic sampling ensures that the sample is representative at regional level. In Northern Ireland, the Rating and Valuation Lists (which serve for the administration of land taxes) are used.
Sample Design
The APS survey year is divided into quarters of 13 weeks. From January 2006, the APS has been conducted on the basis of calendar quarters: January to March (Quarter 1), April to June (Quarter 2), July to September (Quarter 3) and October to December (Quarter 4). The APS design is not stratified.
The APS combines data from 4 successive quarters of the Labour Force Survey (LFS) with rolling-year data from the English, Welsh and Scottish Local Labour Force Survey (LLFS). Each quarter’s LFS sample of private households is made up of 5 waves, each of approximately 12,000 households. Each cohort is interviewed in 5 successive quarters, so that in any one quarter, one cohort will be receiving their first interview (this is wave 1), another cohort their second (this is wave 2), and so on.
The APS data set is created by taking waves 1 and 5 from 4 successive quarters to obtain an annually representative sample of around 80,000 households. Over the period of the 4 quarters, waves 1 and 5 will never contain the same households to avoid the inclusion of responses from any household more than once in the dataset.
Data Collection
Interviews in all waves have typically been carried out either on a face-to-face basis with the help of laptops, known as Computer Assisted Personal Interviews (CAPI) or on the telephone, known as Computer Assisted Telephone Interviews (CATI). Information is collected using a software package called Blaise.
Since the onset of the coronavirus (COVID-19) pandemic, face-to-face interviewing was suspended in March 2020, and survey fieldwork has since been carried out entirely by telephone . These changes have affected people’s willingness to respond, with differences observed across characteristics like ethnicity, disability status, nationality, country of birth and housing. This, combined with the fact that the population weights used as part of the Labour Force Survey (LFS) statistics predate the pandemic and so do not show its potential demographic and structural impacts, is why the dataset is being re-weighted.
Validation and quality assurance
Accuracy is the degree of closeness between an estimate and the true population value.
As the Annual Population Survey (APS) is a sample survey, it provides estimates of population characteristics rather than exact measures. In principle, many random samples could be drawn and each would give different results, due to the fact that each sample would be made up of different people, who would give different answers to the questions asked. The spread of these results is the sampling variability.
Confidence intervals are used to present the sampling variability. For example, with a 95% confidence interval, it is expected that in 95% of survey samples, the resulting confidence interval will contain the true value that would be obtained by surveying the whole population. The statistical methodology used to calculate the Labour Force Survey (LFS) sampling variability is published in the LFS Quality and Methodology Information report.
Comparability is the degree to which data can be compared over time and domain, coherence is the degree to which data are derived from different sources or methods but refer to the same topic and are similar. Some sources provide data that overlap with APS data on employment, unemployment and earnings.
The APS is one of a number of sources of data about the labour market. Some sources provide data that overlap with APS data on employment, unemployment and earnings. We have published guidance about the strengths and limitations of each source in relation to these topics and indicated which source is the most appropriate for different purposes.
The LFS (and APS) is the source we recommend for employment-related statistics such as estimates of the number of people in employment. The LFS (and APS) is also a unique source of comprehensive, coherent information about unemployment and economic inactivity, where it provides information separately about people who want a job and those who do not.
On each quarterly APS dataset, the variable frequencies are compared with the previous period. This identifies any significant discontinuities at an early stage. All discontinuities judged significant are investigated to determine the reason for the discontinuity. Is it the product of questionnaire revision or processing error, derived variable revision or error or real world change? This process also ensures that the metadata associated with each variable are correct.
Specific main derived variables are checked in detail by extracting the underlying variables and recalculating in another application, then comparing the results with the values in the dataset. This ensures that the program used to calculate the derived variables is working correctly.
4.3 Quality assurance processes at DCMS
The majority of quality assurance of the data underpinning the DCMS Economic Estimates: Percentage of all 16-64 year-olds with a main job in the DCMS Sectors (excl. Tourism): UK, 2019 & 2020 release takes place at ONS, through the processes described above. However, further quality assurance checks are carried out within DCMS at various stages.
Production of the report is typically carried out by one member of staff, whilst quality assurance is completed by at least one other, to ensure an independent evaluation of the work.
Data requirements
For the APS data, DCMS discusses its data requirements with ONS and these are formalised as a Data Access Agreement (DAA). The DAA covers which data are required, the purpose of the data, and the conditions under which ONS provide the data. Discussions of requirements and purpose with ONS improve the understanding of the data at DCMS, helping us to ensure we receive the correct data and use it appropriately.
Checking of the data delivery
For the APS data, DCMS checks that the data delivered by ONS match what is listed in the Data Access Agreement (DAA). For this particular release we check that:
- We have received all data, in particular all data at the 4 digit SIC code level, which is required for us to aggregate up to produce estimates for our sectors and sub-sectors.
- Data at the 4 digit SIC code has not been rounded unexpectedly. This would cause rounding errors when aggregating up to produce estimates for our sectors and sub-sectors. As we are publishing a new statistic for DCMS, it was necessary to work with data owners, and labour market colleagues, at ONS to scope out the work. This included:
- Checking how the calculation is done. In particular, establishing that the focus is on main jobs (second jobs are not counted), and that the regional variable used for the calculation by ONS is region of residence
- Understanding the implications for demographic breakdowns, as set out above
Data analysis
At the analysis stage, data are aggregated up to produce information about DCMS sectors and sub-sectors.
For these estimates, table production was carried out in the programming language R as part of the automation work being undertaken in DCMS. However, as it was a new set of statistics, the calculation was “dual run” in another software package, SPSS, combined with Excel. This was to see if the figures matched across the two.
Once tables were produced the statistics lead also completed the following checks:
- Whether the sum of the breakdowns matches the relevant total. E.g.:
- Do sub-sectors within the Creative Industries sum to the Creative Industries total?
- Do the individual regional breakdowns (e.g.) sum up to the total for that sector?
- “Sense checks” of the data. E.g.:
- Are the estimates similar from one year to the next? How do the figures compare with ONS published totals?
- Looking at any large differences between the data and possible causes to these.
Quality assurance of data analysis
Once analysis is complete, DCMS document the checks needed for quality assurers to carry out. The checks cover:
- Ensuring the correct data are used for the analysis.
- Checking that the correct SIC codes have been aggregated together to form DCMS sector (and sub-sector) estimates. Are all SIC codes we require included? Are there any non-DCMS SIC codes that have been included by accident?
- Making sure it is not possible to derive disclosive data from the figures that will be published.
- Making sure the correct data has been pasted to the final tables for publication, are accessible, formatted correctly, and have appropriate documentation.
Dissemination
Finalised figures are disseminated within Excel tables published on GOV.UK, with summary text on the webpage. These are produced by the Employment statistics lead who, beforehand, checks with the ONS on details of how to interpret the statistics. Before publishing, a quality assurer checks the figures match between the tables and the Gov.Uk page summary. The quality assurer also makes sure any statements made about the figures (e.g. regarding trends) are correct according to the analysis and checks for spelling or grammar errors.
5. External data sources
It is recognised that there are always different ways to define sectors, but their relevance depends on what they are needed for. Government generally favours classification systems which are
- rigorously measured,
- internationally comparable,
- nationally consistent, and
- ideally applicable to specific policy interventions.
These are the main reasons for DCMS constructing sector classifications from Standard Industrial Classification (SIC) codes. However, DCMS accepts that there are limitations with this approach and alternative definitions can be useful where a policy-relevant grouping of businesses crosses existing Standard Industrial Classification (SIC) codes. DCMS is aware of other estimates relevant to DCMS Sectors. These estimates use various methods and data sources, and can be useful for serving several purposes, e.g. monitoring progress under specific policy themes such as community health or the environment, or measuring activities subsumed across a range of SICs.
The ONS use the quarterly Labour Force Survey for their estimates of UK-wide employment rates. Our calculation of the population percentage of 16-64 year-olds having a main job in the DCMS sectors takes a very similar approach. However, as the APS uses two waves of the LFS, the datasets are not directly comparable and the ONS published figures will differ slightly from ours.
For employment statistics more broadly, the main alternative is the Business Register and Employment Survey (BRES). This has the advantage of asking businesses directly about their employees and hence is likely to capture the sector of employees more accurately than a household survey. However, it does not contain the range of demographic breakdowns that the APS does, which enables us to build a fuller picture of employment in our sectors, using a still-robust data source.
The Gambling Commission’s biannual Industry Statistics also publish estimates on Gambling jobs in Great Britain (though not the wider UK). These figures are collected from gambling operators and the estimates are typically higher than DCMS estimates. The reason for this is unknown but is believed to primarily relate to a discrepancy between the Gambling SIC code and licensed gambling operators who, if they are also gambling software developers (e.g.), may not put down the Gambling SIC code as their primary activity.
For some parts of the DCMS Sectors, estimates have been attempted to a fuller definition of the sector. In particular, for the Heritage subsector DCMS only looks at economic activity attributed to the “Operation of historical sites and attractions” (SIC 91.03). However, Historic England (working with the CEBR) have published their own estimate of the number of jobs supported by Heritage, using a wider definition. UK Music have done likewise, for the Music sector, again using a wider definition.
It is recognised that there will be other sources of evidence from industry bodies, for example, which have not been included above. We encourage statistics producers within DCMS sectors who have not been referenced to contact the economic estimates team at evidence@dcms.gov.uk.
6. Further information
For enquiries on this release, please email evidence@dcms.gov.uk.
For general enquiries contact:
Department for Digital, Culture, Media and Sport
100 Parliament Street London
SW1A 2BQ
Telephone: 020 7211 6000
DCMS statisticians can be followed on Twitter via @DCMSInsight.
This release is an Experimental Official Statistics publication and has been produced to the standards set out in the Code of Practice for Statistics.
-
Sampling error is the error caused by observing a sample (as in a survey) instead of the whole population (as in a census). While each sample is designed to produce the “best” estimate of the true population value, a number of equal-sized samples covering the population would generally produce varying population estimates. This means we cannot say an estimate of, for example, 20% is very accurate for the whole population. Our best estimates, from the survey sample, suggest that the figure is 20%, but due to the degree of error, the true population figure could perhaps be 18% or 22%. This is not an issue with the quality of the data or analysis; rather it is an inherent principle when using survey data to inform estimates. ↩