DCMS Economic Estimates 2020 (provisional): Earnings
Published 26 November 2020

© Crown copyright 2020
This publication is licensed under the terms of the Open Government Licence v3.0 except where otherwise stated. To view this licence, visit nationalarchives.gov.uk/doc/open-government-licence/version/3 or write to the Information Policy Team, The National Archives, Kew, London TW9 4DU, or email: psi@nationalarchives.gov.uk.
Where we have identified any third party copyright information you will need to obtain permission from the copyright holders concerned.
This publication is available at https://www.gov.uk/government/statistics/dcms-sectors-economic-estimates-2020-earnings/dcms-economic-estimates-2020-provisional-earnings
Released: 26 November 2020
Next update: TBC
Geographic coverage: United Kingdom
1. Introduction
This release provides estimates for earnings of employees in DCMS sectors. Our headline measure of earnings is nominal median gross weekly earnings for all employees i.e. earnings of the self employed are not included.
Estimates are based on the Annual Survey of Hours and Earnings (ASHE) dataset. This is a snapshot of earnings in the UK at a reference date in April each year. In 2020, the reference date was 22 April, during national lockdown.
- Median weekly earnings by employees in DCMS sectors in 2020 were £422, 7.6% lower than the UK average of £456.
- Median weekly earnings in 2020 for employees on furlough in DCMS sectors were 58.0% lower than those not furloughed (£253 and £603 per week, respectively). For the UK as a whole, this difference was 33.6% (£334 for furloughed employees compared to £503 for those not furloughed).
This report also contains estimates of earnings in DCMS Sectors by region, furlough status, and gender. Accompanying data tables also include information on:
- demographics: gender, age
- employment type: full-time, part-time
- annual gross pay
- the Gender Pay Gap (GPG), using hourly earnings excluding overtime
- More detail at occupation and industry level
- Earnings in DCMS sectors
- DCMS sectors
Figure 1 compares the distribution of median weekly earnings across DCMS sectors for 2019 and 2020:
- Median weekly earnings in DCMS sectors in 2020 were £422, 7.6% lower than the UK average of £456.
- Earnings have increased by 2.5% since 2019, from £411, a slightly higher increase than the UK economy as a whole, which increased by 2.0%.
- The highest-earning DCMS sectors in 2020 were Telecoms (£720), Digital (£686) and Creative Industries (£629). * Median weekly earnings by employees in the Telecoms sector were 57.9% higher than the UK average.
- The lowest-earning sectors were Tourism (£273) and Sport (£277). Employees in these sectors earned around 40% less than the UK median.
- Earnings in the Cultural Sector and Telecoms saw the highest increases from 2019 to 2020, by 17.8% and 14.6% respectively.
- Three DCMS sectors saw decreases in median weekly wages from 2019 to 2020. These were the Tourism sector (-12.1%), Civil Society (-5.7%) and Creative Industries (-1.5%).
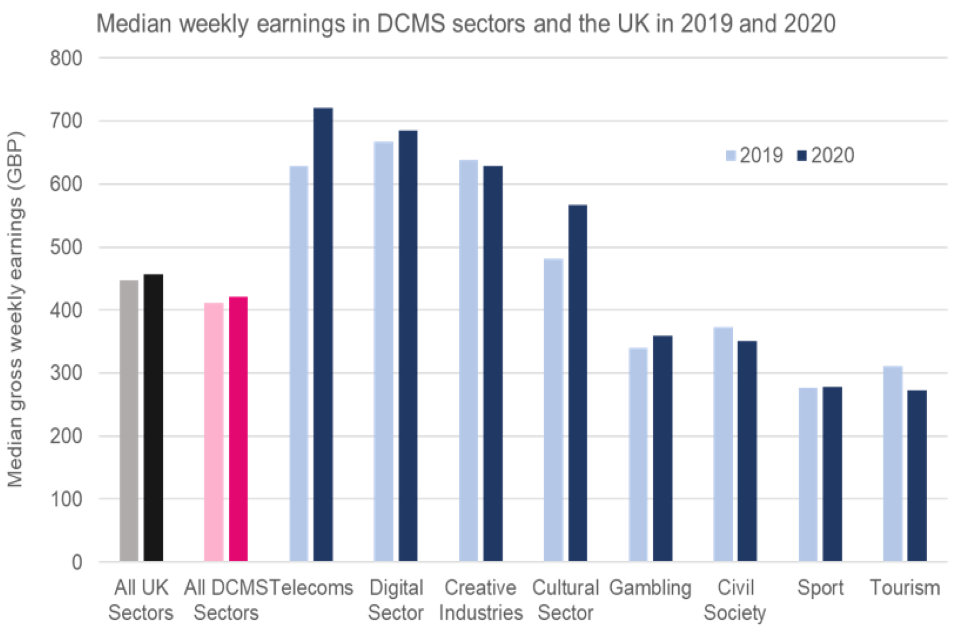
Figure 1: Median gross weekly earnings in DCMS sectors and the UK in 2019 and 2020 Regions
- Weekly median earnings in 2020 were highest in London (£575), and the South East (£493). The lowest earnings were seen in Yorkshire and The Humber (£329) and Wales (£335).
- The South East was the only UK region with weekly median earnings in DCMS sectors higher than the economy wide regional average for all employees, at £493 compared to £477, a 3.6% difference.
- The largest differences between regional averages for all employees and for DCMS sectors were in Scotland (22.3% lower than regional average) and Yorkshire and The Humber (20.2% lower than regional average.)
Figure 2 shows median weekly earnings for employees by sector and region:
-
In general, the pattern of earnings in each region was similar across the sectors, with Digital and Telecoms sectors being highest.
-
The pattern of regional variations was generally the same for each sector, with highest earnings in London and the South East, and lowest in Wales and Yorkshire and the Humber.
-
However, earnings in the Cultural and Tourism sectors were particularly low in the North East, while earnings in Civil Society were highest in the North East and lowest in Northern Ireland.
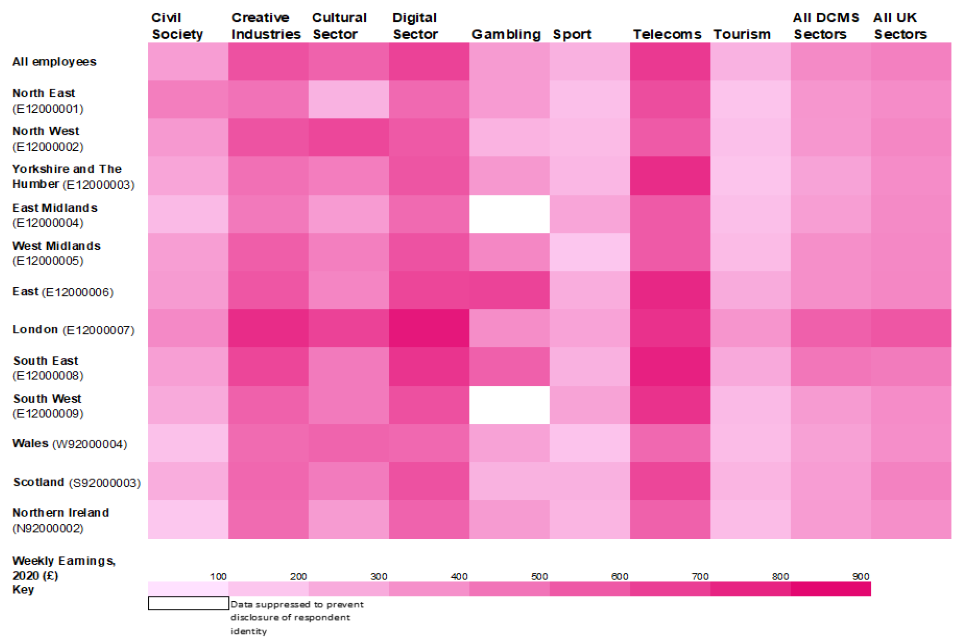
Figure 2: Variation in median weekly earnings in the UK in 2020 by DCMS sector and UK region
2. Furlough
Figure 3 compares median weekly earnings for employees who were furloughed and those who weren’t, for DCMS sectors, DCMS as a whole and the UK. There were large differences in every sector, with median weekly earnings for furloughed employees lower than those for employees who were not furloughed.
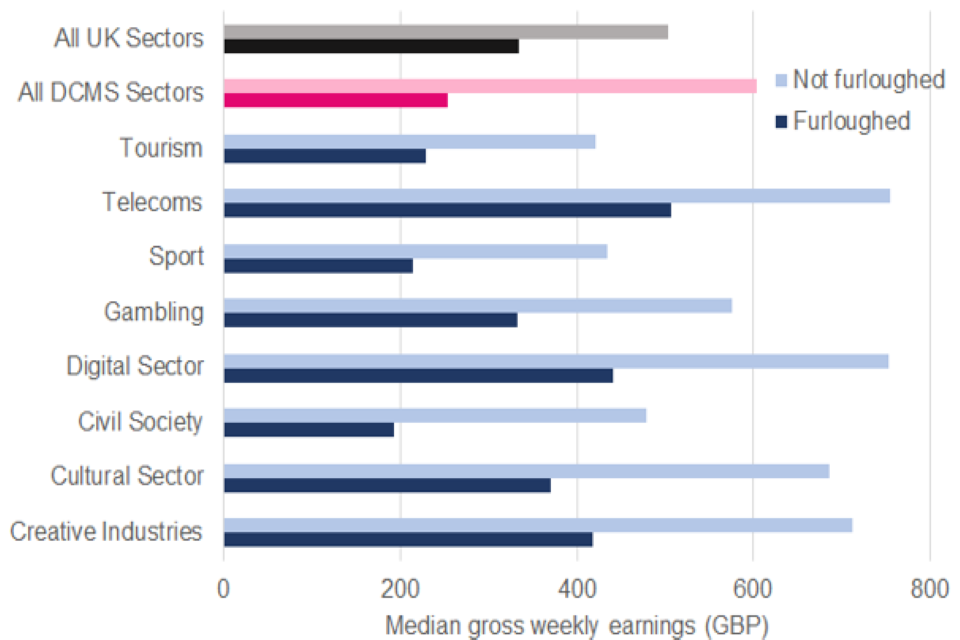
Figure 3: Median gross weekly earnings in DCMS sectors and the UK by furlough status
- Median weekly earnings in 2020 for employees on furlough in DCMS sectors were 58.0% lower than those not furloughed (£253 and £603 per week, respectively). For the UK as a whole, this difference was 33.6% (£334 for furloughed employees compared to £503 for those not furloughed).
- Earnings for furloughed employees are calculated using actual earnings during the survey period, and regular hours worked pre-furlough, reflecting the 20% pay decrease for those employees who did not receive the top-up from their employer.
- Analysis by the Office for National Statistics showed that for the UK as a whole, based on hourly earnings, the lowest-paying jobs were over five times more likely than other employees to be furloughed with reduced pay (Low and High Pay in the UK: 2020).
- The ONS Business Impact of Covid-19 Survey (BICS) covering the period including 22 April 2020 estimated that roughly 65% of jobs in businesses that had not permanently closed in the Arts, Entertainment and Recreation industry were furloughed, and 78% of jobs in the Accomodation and Food Services Activities industry.
- The Information and Communication, and the Professional, Scientific and Technical Activities industries had roughly 13% of jobs furloughed. These estimates should be treated with caution, but are indicative of differences in furlough rates across different industries.
3. Other key findings
- The GPG is calculated using hourly earnings excluding overtime. It is presented as the difference in median earnings for men and women as a percentage of the figure for men.
- In 2020, the GPG for DCMS Sectors was 27.5%, compared to 15.5% for the whole of the UK economy. In other words, women were paid 72p for every £1 earned by men in DCMS sectors, compared to the UK average of 85p.
- Median earnings in DCMS sectors in 2020 were above the UK average for those aged 40 to 49 and 50 to 59 (5.3% and 8.7% higher than the UK averages of £521 and £476 respectively). DCMS employment statistics for 2019 suggest that lower paid DCMS sectors like gambling and tourism tend to be weighted towards younger employees.
Further detail can be found in the tables accompanying this report.
4. Methods and limitations
For full definitions, methodology and strengths and limitations of the data, please read the accompanying technical report.
Estimates of earnings are calculated from the ONS ASHE survey. As with other statistics in the Economic Estimates series, categorisation of DCMS sectors is based on the Standard Industrial Classification (SIC) codes.
The ASHE dataset was filtered differently for different measures of earnings. This approach is consistent with the measures used in the ONS headline publication. For the weekly and hourly pay figures the dataset excludes:
- those who have lost earnings due to absence during the pay period (unless due to furlough)
- those who do not have a valid region of work
- those who are less than 16 years old
For the annual earnings figures, the dataset excludes:
- those who have been in the same job for less than one year
- those who do not have a valid region of work
- those who are less than 16 years old
5. The 2020 ASHE
In 2020, the ASHE survey covered the pay period including 22 April, during the COVID-19 pandemic. This meant that:
- the usual sample size achieved was around 25% smaller than usual, at 136,000 jobs compared to 180,000 in other years. This means that estimates of earnings for 2020 have greater uncertainty than usual.
- at the time the survey was carried out approximately 8.8 million employees (in the whole UK economy) were furloughed under the Coronavirus Job Retention Scheme (CJRS). The CJRS funded 80% of normal pay, to a maximum of £2,500 per month, and employers were permitted to top up pay to normal levels but were not required to.
- pay estimates include furloughed employees and are based on actual payments made to the employee from company payrolls and the hours on which this pay was calculated, which in the case of furloughed employees are their usual hours.
- due to challenges in matching some jobs to the ASHE sample, the furlough estimates in ASHE represent an undercount of approximately 20% against administrative sources. The Office for National Statistics considers that the information is useful for earnings comparisons but not for counting furloughed employees.
6. Classification and upcoming publications
These statistics are classed as experimental as it is the first time DCMS has introduced analysis on earnings in all DCMS sectors.
DCMS plans to widen this analysis in the future to include other sources of earnings data, in particular to enable analysis by other demographics, including disability and ethnicity. This work is a response to customer interest after the publication of Digital Sector earnings estimates for 2018, and remains a priority.
Provisional (p) results for 2020 are available and are subject to change once finalised in late 2021. Data for 2019 are final. These statistics have been produced in accordance with the requirements of the Code of Practice for Statistics.
The next set of publications of DCMS sectors Economic Estimates are outlined below:
- DCMS Sectors Economic Estimates 2019: GVA scheduled for December 2020
- DCMS Sectors Economic Estimates 2019: Trade in Services scheduled for February 2021
The final dates will be announced via the DCMS statistical release calendar nearer the time.
Views on this publication are welcomed from users. Responses should be provided to:< evidence@dcms.gov.uk>.
7. Contact information
The responsible statistician for this release is Rachel Moyce. For enquiries on this release, please contact Rachel at evidence@dcms.gov.uk.
For general enquiries contact:
Department for Digital, Culture, Media and Sport
100 Parliament Street
London
SW1A 2BQ
Email: enquiries@dcms.gov.uk
For media enquiries contact: 020 7211 2210
DCMS statisticians can be followed on Twitter via @DCMSInsight.