DCMS Sector Economic Estimates Provisional 2018: Regional GVA
Published 20 May 2020

© Crown copyright 2020
This publication is licensed under the terms of the Open Government Licence v3.0 except where otherwise stated. To view this licence, visit nationalarchives.gov.uk/doc/open-government-licence/version/3 or write to the Information Policy Team, The National Archives, Kew, London TW9 4DU, or email: psi@nationalarchives.gov.uk.
Where we have identified any third party copyright information you will need to obtain permission from the copyright holders concerned.
This publication is available at https://www.gov.uk/government/statistics/dcms-sectors-economic-estimates-2018-regional-gva/dcms-sector-economic-estimates-provisional-2018-regional-gva
This release provides estimates of the contribution of DCMS Sectors (excluding Tourism and Civil Society) to each UK region, measured by gross value added (GVA). GVA is a measure of the increase in the value of the economy due to the production of goods and services. Its relationship to GDP is as follows:
GVA = GDP + Subsidies - Taxes
It is measured either at current basic prices (‘nominal GVA’), which give the best ‘instantaneous’ measure of the value to the economy, but are not adjusted for the effect of inflation, or in “real terms” in chained volume measures, where the effect of inflation is removed.
We use current prices to report current sector estimates and chained volume measures for any comparisons over time.
The DCMS sectors covered in this report are:
- Creative Industries
- Cultural Sector
- Digital Sector
- Gambling
- Sport
- Telecoms
This release is shorter than earlier releases in the DCMS Economic Estimates series, and contains less detailed analysis. All of the data released in previous years, including more detailed industry breakdowns, is still available in the accompanying data tables.
The UK regions with the biggest increase in DCMS Sector (excluding Tourism and Civil Society) GVA were London and the East Midlands which grew by 53.3% and 31.4%, respectively, in real terms between 2010 and 2018.
East Midlands, Scotland, West Midlands and Yorkshire and the Humber saw the highest growth in DCMS sectors GVA since 2017 (7.0%, 6.8%, 6.0%, and 6.0% respectively).
Activity in DCMS sectors was more concentrated in London than the general economy; 39.6% of DCMS sector GVA was accounted for in London compared to 23.6% for the total UK economy.
GVA from the Creative Industries, Cultural, Digital and Telecoms sectors was largely concentrated in London and the South East. By contrast, GVA from the Sport and Gambling sectors was distributed more evenly across the UK, although these sectors are much smaller in value.
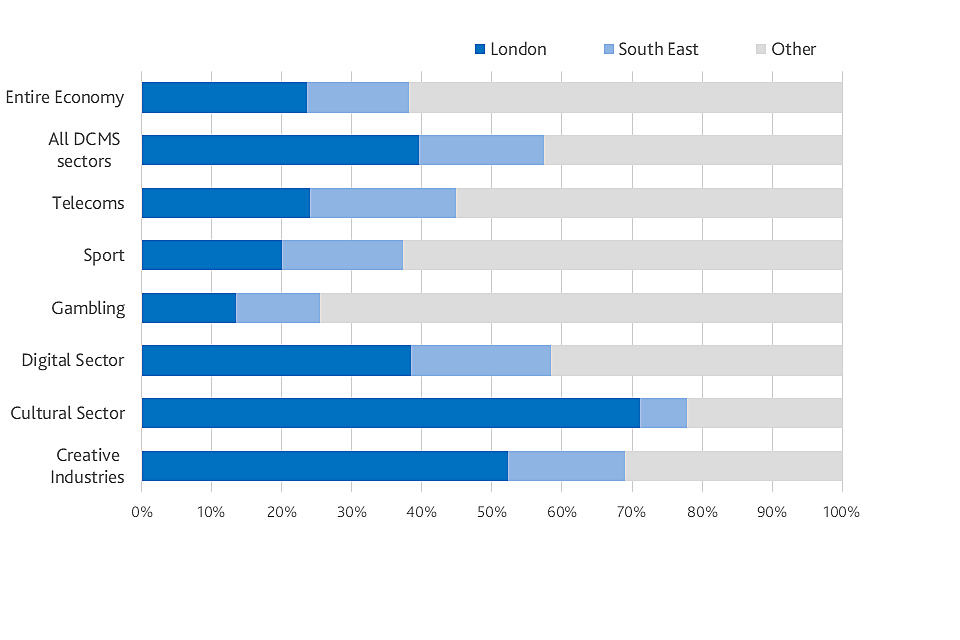
Figure 1 shows how GVA from the Creative Industries, Cultural, Digital and Telecoms sectors is largely concentrated in London and the South East. By contrast, GVA from the Sport and Gambling sectors was distributed more evenly across the UK
In 2018, London accounted for more than half of GVA both in the Cultural Sector and the Creative Industries, as shown above in Figure 1. South East was the region with the second highest GVA in DCMS sectors in 2018.
London had a much smaller share of GVA in Gambling (13.5%) , Sport (20.0%) and Telecoms (24.0%) sectors, compared to its 39.6% share of all DCMS sectors’ GVA.
1. Chapter 1: Introduction
1.1 Code of Practice for Statistics
In June 2019, the DCMS Sector Economic Estimates: Regional GVA were designated as National Statistics. This affirms that the statistics have met the requirements of the Code of Practice for Statistics.
1.2 Background
Released: 20 May 2020
Geographic Coverage: United Kingdom
This release provides estimates for the contribution of DCMS Sectors (excluding Tourism and Civil Society [footnote 1] to the UK economy, represented by:
- Gross Value Added (GVA), shown in current prices (i.e. not adjusted for inflation)
- Gross Value Added (GVA), shown in chained volume measures (i.e. adjusted for inflation)
Both of these estimates are available from 2010 to 2018. The same data sources are used for DCMS estimates as for national (UK) estimates, enabling comparisons to be made on a consistent basis. The time lag between the publication date and the reference period for the statistics is due to the time it takes to collect and process the data.
A definition for each sector is available in the methodology note, along with details of methods and data limitations. There is significant overlap between DCMS sectors so users should be aware that the estimate for ‘DCMS Sectors total’ is lower than the sum of the individual sectors
In summary, the data presented in this report on employment:
- are based on official statistics data sources
-
are based on internationally-harmonised codes, meaning the estimates are:
- comparable at both a national and international level
- comparable over time, allowing trends to be measured and monitored
- subject to limitations of the underlying classifications around reflecting the current balance and make-up of the UK economy (for example, the SIC codes were developed in 2007 and have not been revised since; emerging sectors, such as Artificial Intelligence, are therefore hard to capture and may be excluded or mis-coded)
-
are based on survey data (Annual Business Survey) and, as with all data from surveys, there will be an associated error margin surrounding these estimates[footnote 2]
- this means, for example, we cannot say an estimate of 20% is totally accurate for the whole population; our best estimates, from the survey sample, suggest that the figure is 20%, but due to the degree of error the true population figure could perhaps be 18% or 23%
- this is not an issue with the quality of the data or analysis; rather it is an inherent principle when using survey data to inform estimates
2. Chapter 2: Regional GVA for DCMS sectors
This chapter presents regional GVA estimates for each DCMS sector (excluding Tourism and Civil Society). All estimates of GVA are shown in current (nominal) prices i.e. not adjusted for inflation. All time series comparisons are in real terms (Chained Volume Measures). Regional GVA estimates are consistent with the Office for National Statistics GVA(B) estimates. Where data are not available directly from these ONS regional tables, the Annual Business Survey (ABS) has been used to allocate GVA within the categories available in the regional GVA tables. Further information on the methodology is available in the associated methodology note.
We define GVA as being the measure of the value of goods and services produced in an area, industry or sector of the UK economy as a whole. This is calculated by estimating the value of an output (goods and services) minus the value of inputs used in that output’s production process. GVA plus taxes (less subsidies) on products is equivalent to gross domestic product (GDP). When we talk about the overall UK economy, we refer to all UK sectors based on the Standard Industrial Classification 2007.
Data tables accompanying this release are available at: http://www.gov.uk/government/statistics/dcms-sectors-economic-estimates-2018-regional-gva
2.1 Understanding DCMS sector overlaps
For each DCMS Sector, definitions were developed individually based on internal, UK or international best practice/standards for that sector, rather than with reference to each other. In some cases, industries have been included in more than one sector, i.e., the sectors are not mutually exclusive. Figure 2.1 illustrates these overlaps; for example, the Telecoms sector can be seen to be wholly within the Digital sector because the entire Telecoms bar is directly above the Digital sector bar. Conversely, there is no overlap between the Sport and Gambling sectors as neither bar is directly above the other.
For example, 24.7% of the DCMS sector GVA is within both the Creative Industries and the Digital sector. These overlaps include activities such as Computer programming and software publishing. When calculating the DCMS sector total, the GVA from industries within the overlap is counted once.
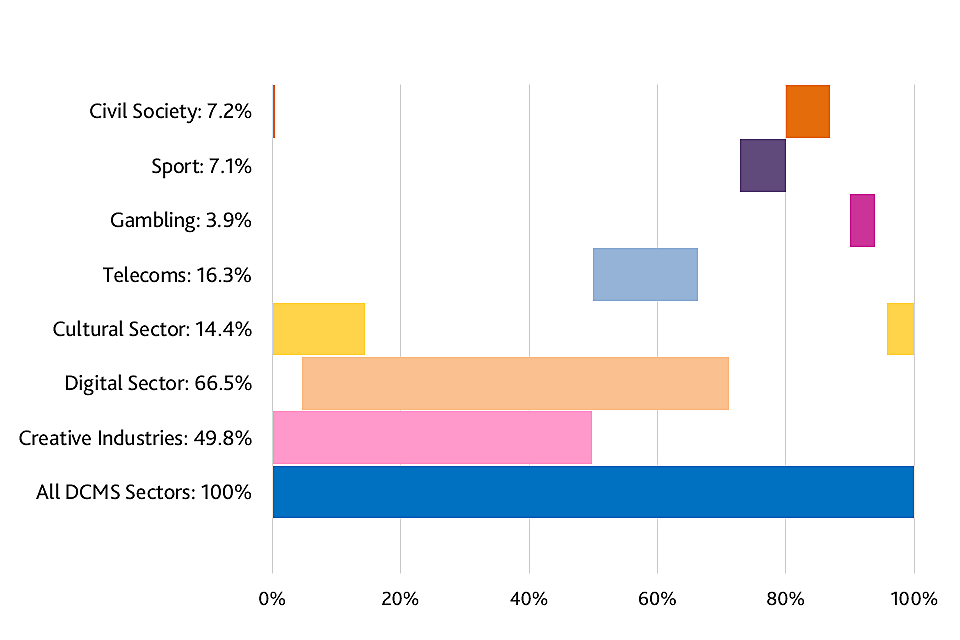
In some cases, industries have been included in more than one sector, i.e., the sectors are not mutually exclusive. Figure 2.1 shows these overlaps
For more information, Chapter 2 of the methodology note visually outlines the overlap between SIC codes in DCMS sectors, but not the value of GVA within these overlaps.
2.2 Overview of regional distribution of DCMS sectors GVA
Figure 2.2 shows the distribution and proportions of DCMS GVA in different regions. London accounted for 39.6% of DCMS sectors GVA in 2018, similar to 2017 (39.7%). DCMS sector GVA in this region increased by 3.7% since 2017 in real terms, from £77.2bn in 2017 to £80.0bn in 2018, based on chain volume measures. This increase is lower than that of UK in DCMS sectors, which was 4.3%, but is higher than the growth of the whole UK economy at 1.4%.
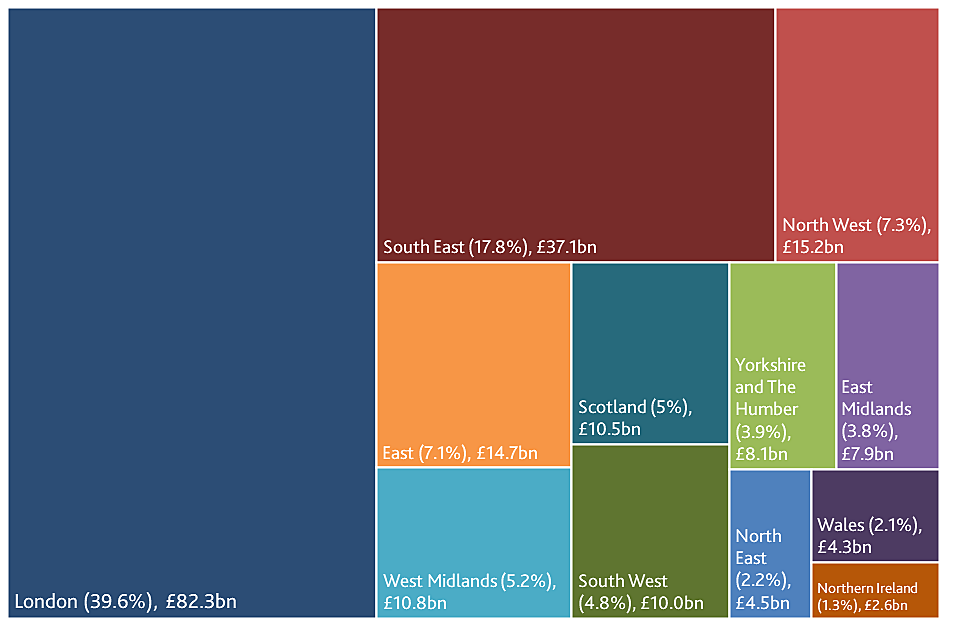
Figure 2.2: Proportion and value of GVA for DCMS sectors (excluding Tourism and Civil Society), by region: 2018 (provisional)
Figure 2.3 compares the growth of DCMS sectors (excluding Tourism and Civil Society) to the averages of all sectors for different regions in the UK. With 29.7% DCMS sector growth since 2010 was nearly twice as big as that of UK average with 16.6%. The GVA in DCMS sectors in London and East midlands grew the fastest with 53.3% and 31.4%, respectively.
Since 2010 DCMS sector GVA grew faster than the regional average for all regions except South East and Yorkshire and the Humber. The biggest difference between the rate of growth of DCMS sectors and the total economy was in North East, where DCMS sectors grew by more than three times as much as the entire economy.
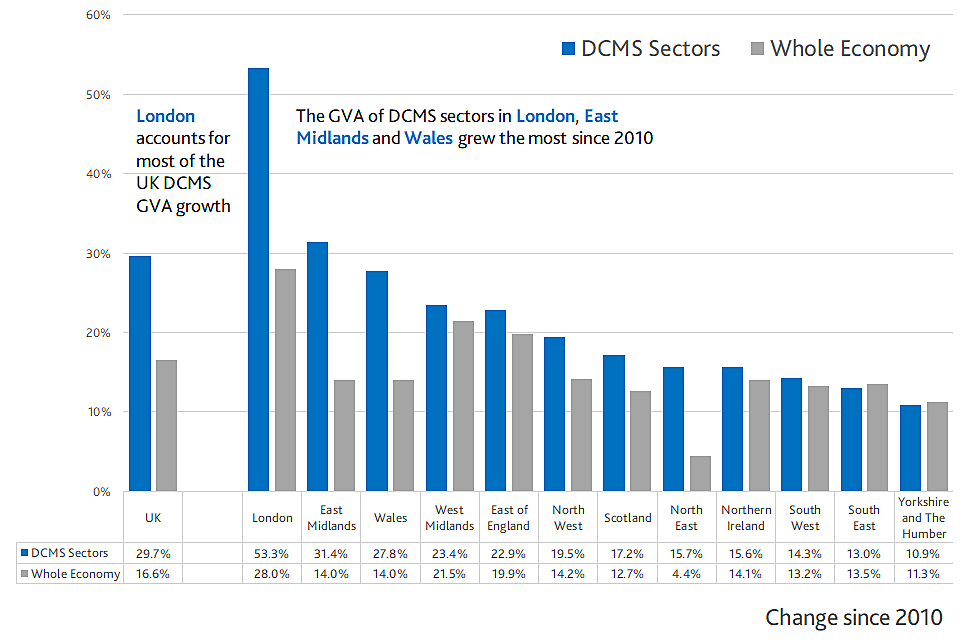
Figure 2.3 compares the growth of DCMS sectors (excluding Tourism and Civil Society) to the averages of all sectors for different regions in the UK. With 29.7% DCMS sector growth since 2010 was nearly twice as big as that of UK average with 16.6%.
Figure 2.4 illustrates the percentage change in GVA for DCMS sectors (excluding Tourism and Civil Society) and all UK sectors since 2017. East Midlands, Scotland, West Midlands and Yorkshire and the Humber saw the highest growth in DCMS sectors GVA since 2017, between 6.0% and 7.0%. Compared to the growth since 2010, this is a change in trends for Scotland and Yorkshire and the Humber, which are among the regions with the lower growth in DCMS sectors. The opposite is true for DCMS sectors in Wales, which grew more than in most other regions since 2010, but grew the second least since 2017.
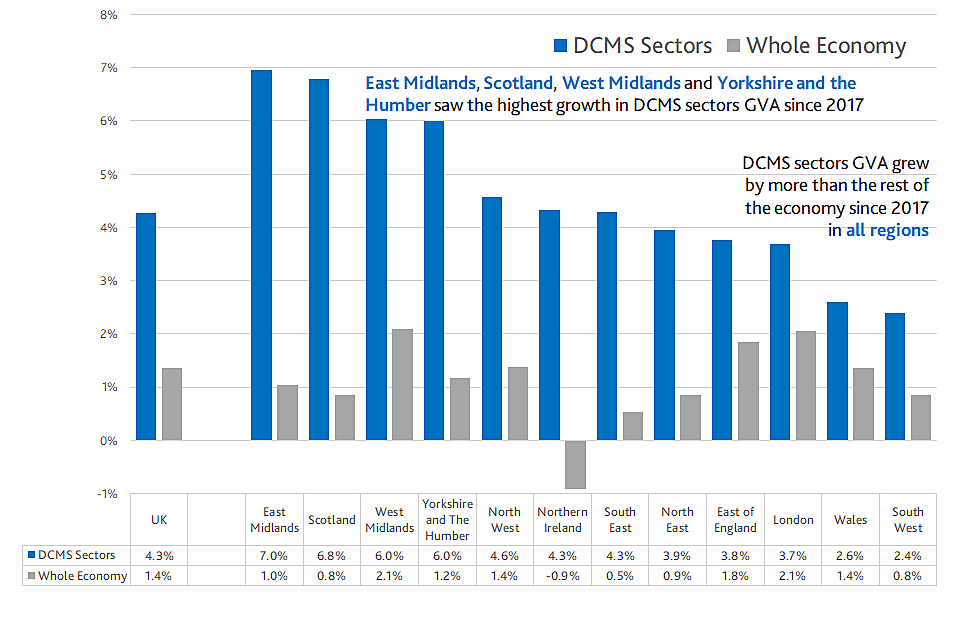
Figure 2.4 shows the percentage change in GVA for DCMS sectors since 2017. East Midlands, Scotland, West Midlands and Yorkshire and the Humber saw the highest growth in DCMS sectors GVA since 2017, between 6.0% and 7.0%.
The Digital sector contributed to the GVA growth in the East Midlands region the most, contributing nearly 37% more in 2018 than in 2010, from the value from £3.6bn in 2010 to £5.0bn in 2010.
The GVA in DCMS sectors increased by 3.7% in London, which is a smaller increase than expected looking at the wider trend (on average, it increased by 6.2% yearly between 2014 and 2017).
In all regions the DCMS sectors GVA grew by more than the economy as a whole.
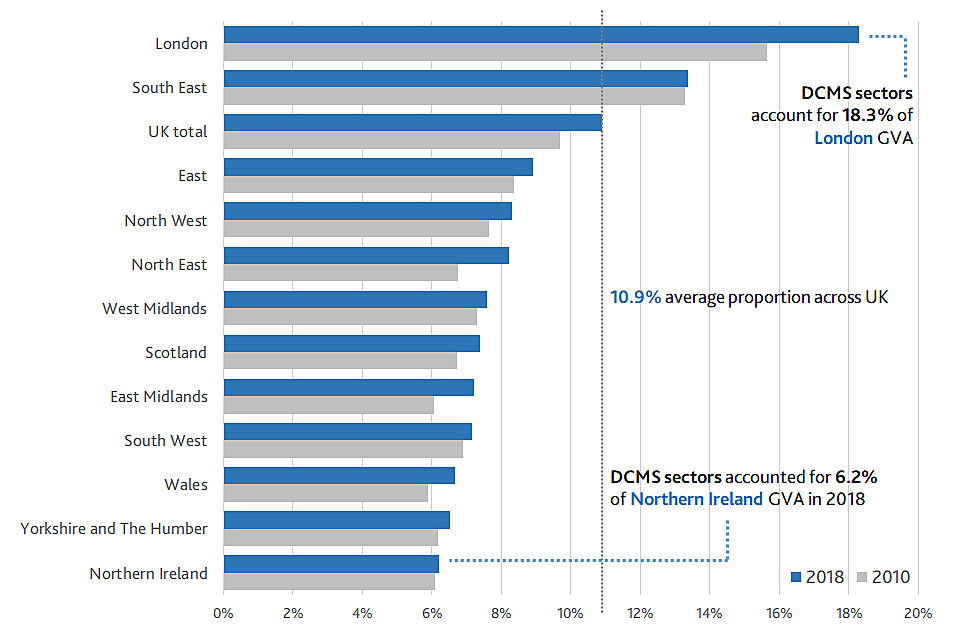
Figure 2.5 shows how DCMS sectors (excluding Tourism and Civil Society) accounted for 18.3% of total GVA in London and 13.4% in the South East in 2018.
DCMS sectors (excluding Tourism and Civil Society) accounted for 18.3% of total GVA in London and 13.4% in the South East in 2018. By contrast, these sectors accounted for a relatively low proportion of GVA in Wales (6.7%), Northern Ireland (6.2%) and Yorkshire and The Humber (6.5%).
Across UK, the proportion of DCMS sectors has increased from 9.8% to 10.9% since 2010. In individual regions this proportion has stayed consistent, increasing the most in London, North East and East Midlands.
3. Chapter 3: Regional GVA by sector
This chapter builds on the analysis in chapter 2, and looks at the regional growth and values for each individual sector. There is significant overlap between DCMS sectors so users should be aware that the estimate for “DCMS Sectors total” is lower than the sum of the individual sectors. Also, larger SIC codes within multiple sectors, for example in Creative Industries and Cultural Sector, are likely to drive the trends in the same way for both sectors.
Of all DCMS sectors (excluding Tourism and Civil Society), the Digital Sector and the Creative Industries contributed the most in GVA in each region in 2018, except in the North East where the value of GVA for the Digital (£3.1bn) and Telecoms (£2.2bn) sectors was the largest, and in Wales, where the value of GVA for the Digital (£3.2bn) and Telecoms (1.1bn) sectors were the largest.
The Creative Industries and Cultural Sector generated a majority of their GVA in London (52.3% and 71.2% respectively in 2018). The South East accounted for a further 16.7% and 6.6% of these sectors respectively.
GVA from the Digital Sector was also concentrated in London (which accounted for 39.6%) and the South East (17.8%). Nearly half of GVA from the Telecoms Sector was generated in these two regions with the South East contributing 20.9% compared to 24.0% from London. GVA from the Sport and Gambling sectors were distributed more evenly across the regions, although these are much smaller in value.
By comparison, 23.6% of GVA for the total UK economy was generated in London in 2018 and 14.5% in the South East. Therefore, GVA generation in DCMS sectors is more concentrated in these regions (39.6% and 17.8% respectively) compared to the general economy (23.6% and 14.5%).
3.1 Creative Industries
The two regions with the highest share of GVA in Creative industries were London and South East with shares of 52.3% and 16.7% respectively (£58.4bn and £18.6bn in 2018 in current prices)
Since 2010, the GVA in Creative Industries of London and Scotland increased the most in real terms, increasing by 75.0% and 55.0% respectively.
3.2 Cultural Sector
The two regions with the highest share of GVA in the Cultural Sector were London and South East with shares of 71.2% and 6.6% respectively (£23.1bn and £2.1bn in 2018 in current prices)
Since 2010, the GVA in the Cultural Sector of London and North West increased the most in real terms, increasing by 68.5% and 50.7% respectively. In Northern Ireland there has been a decrease of 18.0% since 2010.
3.3 Digital Sector
The two regions with the highest share of GVA in the Digital Sector were London and South East with shares of 38.5% and 20.0% respectively (£56.6bn and £29.4bn in 2018 in current prices)
Since 2010, the GVA in Digital Sector of London and East Midlands increased the most in real terms, increasing by 43.2% and 36.9% respectively.
3.4 Gambling
Compared to other DCMS sectors, GVA for the Gambling sector was more evenly spread across the UK regions and devolved administrations of the UK.
The two regions with the highest share of GVA in the Gambling sector were London and East of England with shares of 13.5% and 12.3% respectively (£1.2bn and £1.1bn in 2018 in current prices)
Since 2010, the GVA in the Gambling Sector of West Midlands and South East increased the most in real terms, increasing by 158.6% and 103.1% respectively. Gambling GVA decreased only in Scotland, by 14.3%.
3.5 Sport
The two regions with the highest share of GVA in the Sport sector were London and South East with shares of 20.0% and 17.3% respectively (£3.4bn and £3.0bn in 2018 in current prices)
Since 2010, the GVA in the Sport sector of East of England and London increased the most in real terms, increasing by 35.9% and 25.2% respectively.
Since 2010, Sport GVA decreased the most in real terms in West Midlands and North East, shrinking by 17.0% and 15.9% respectively
3.6 Telecoms
The two regions with the highest share of GVA in Telecoms were London and South East with shares of 24.0% and 20.9% respectively (£8.7bn and £7.6bn in 2018 in current prices)
Since 2010, the GVA in the Telecoms sector of Wales and North East increased the most in real terms, increasing by 39.4% and 25.0% respectively.
4. Chapter 4: Next steps
DCMS have developed a suite of economic estimates which help support policy and understand the economic impact our sectors have on the UK economy. The regional GVA estimates in the release is expected to be used by customers both within and outside the government. In combination with other economic indicators, regional GVA estimates help build a comprehensive picture of the UK economy. DCMS will continue to work with ONS to pursue the possibility of producing regional GVA estimates for the Tourism sector as part of the Tourism Satellite Account.
Upcoming work in the DCMS Economic Estimates series includes:
- DCMS Economic Estimates 2019: Business demographics scheduled for late May 2020
The date for these publications will be announced via the DCMS statistical release calendar nearer the time. .
5. Annex A: Definitions and limitations
This annex outlines the limitations of the data used within DCMS sectors Economic Estimates: Regional GVA. Further information is available in the methodology note.
The estimates set out in this report are robust but there are some limitations which users should be aware of:
5.1 ABS survey design changes
The ABS (Annual Business Survey) is used to break down the Supply and Use Tables (SUT) estimates to the 4 digit level. However, users should note that the ABS population was expanded in 2015 which led to an increase in the number of businesses in the overall population of approximately 4%. In 2015, these businesses increased the level of turnover by 0.4% and GVA by 0.8%.
Users should also note that a sample re-optimisation has been included in the ABS estimates for 2016. This is carried out every five years to improve the efficiency of the sample estimation and reduce sampling variability as part of the regular process to improve estimates.
Both of these survey design changes can have a possible impact on the DCMS GVA estimates although the ABS is only being used to provide a proportion of the SUT so these changes should have minimal impact on the overall figures.
5.2 Sport
For the purposes of this publication the statistical definition of sport has been used. This incorporates only those 4 digit Standard Industrial Classification (SIC) codes which are predominately sport (see methodology note Table 2.1). DCMS also publishes estimates of sport based on the EU agreed Vilnius definition. The Vilnius definition is a more comprehensive measure of sport which considers the contribution of sport across a range of industries, for example sport advertising, and sport related construction. The methodology for the DCMS Sport Satellite Account is currently being reviewed and therefore has not been used in these estimates.
5.3 Heritage
The heritage sector is defined in our estimates by one SIC code “91.03 Operation of historical sites and building and similar visitor attractions”. DCMS use standard industrial classification (SIC) codes to construct these estimates, which enables international comparability as well as comparability with national estimates. As the balance and make-up of the economy changes, the international SIC codes used here are less able to provide the detail for important elements of the UK economy related to DCMS sectors. It is therefore recognised that the published estimates are likely to be an underestimate for the Heritage sector.
5.4 GVA
These data are taken from ONS “balanced estimate” of regional gross value added (GVA(B)). These estimates “balance” the income and production approaches to measuring the economy into a single estimate at a regional level. This is a new approach that was introduced in December 2017. These estimates are consistent with the UK National Accounts, The Blue Book: 2018. National aggregates for the components of GVA are allocated to regions using the most appropriate regional indicator available.
However, as the DCMS sectors are defined at 4 digit SIC level, and the GVA(B) figures are at a higher level, a method for breaking down the regional estimates of GVA was applied. This was done using approximate Gross Value Added (aGVA) data from the UK non-financial business economy (Annual Business Survey).
Both the regional GVA and ABS data sources are subject to revisions, as they are re-balanced each year.
More details of limitations are available in the methodology note.
6. Annex B: Further information
-
The next update to these statistics is scheduled to be published in early 2021.
-
The responsible statistician for this release is Ziga Dernac. For enquiries on this release, please email evidence@culture.gov.uk.
-
For general enquiries contact: Department for Digital, Culture, Media and Sport, 100 Parliament Street, London, SW1A 2BQ, Email: enquiries@culture.gov.uk.
-
For media enquiries contact: 020 7211 2210
-
DCMS statisticians can be followed on Twitter via @DCMSInsight.
-
The DCMS-Sector Economic Estimates were designed as National Statistics on 26 June 2019. This followed a report by the Office for Statistics Regulation in December 2018, which stated that the series could be designated as National Statistics subject to meeting certain requirements.
-
Since the report, we have striven to improve our publications by providing summaries of other notable sources of data, more detail on the nature and extent of the overlap between the sectors, and further information on the quality and limitations of the data. We will continue to improve the series in the future, in line with the recommendations of the report.
-
Tourism and Civil Society data are based on a different methodology to other DCMS sectors. Tourism data are taken from the Tourism Satellite Account and therefore it is not possible to produce robust demographic breakdowns for direct Tourism jobs. ↩
-
Sampling error is the error caused by observing a sample (as in a survey) instead of the whole population (as in a census). While each sample is designed to produce the “best” estimate of the true population value, a number of equal-sized samples covering the population would generally produce varying population estimates. ↩