DCMS Sectors Economic Estimates: Workforce, January to December 2021
Updated 22 November 2024

© Crown copyright 2024
This publication is licensed under the terms of the Open Government Licence v3.0 except where otherwise stated. To view this licence, visit nationalarchives.gov.uk/doc/open-government-licence/version/3 or write to the Information Policy Team, The National Archives, Kew, London TW9 4DU, or email: psi@nationalarchives.gov.uk.
Where we have identified any third party copyright information you will need to obtain permission from the copyright holders concerned.
This publication is available at https://www.gov.uk/government/statistics/dcms-sector-economic-estimates-workforce-2021/dcms-sectors-economic-estimates-workforce-january-to-december-2021
1. Main Points
1.1 Employment
- In 2021 the total number of filled jobs in all the DCMS Sectors (excluding Tourism) was 4.3 million (12.9% of all UK employment), representing an increase of 3.1% (128 thousand) compared to 2020; employment in the UK fell by 0.6% in the same period.
- As of 2021, within the DCMS Sectors (excluding Tourism), 44.5% of filled jobs were held by women, 15.0% by people with a disability (as defined under the Equality Act 2010), and 13.2% by people from ethnic minority groups (excluding white minorities); this marks a lower representation of women than the UK overall but a similar proportion of minority ethnic and disabled people.
1.2 Earnings
- According to 2021 estimates, median hourly pay was estimated to be £15.68 in the DCMS Sectors (excluding Tourism); this represents greater median pay than the UK overall (£13.51).
- Of the DCMS Sectors (excluding Tourism), only Gambling and Sport had a lower median hourly pay than the UK overall; the Creative Industries and the Digital Sector had the highest median hourly pay of any DCMS Sector.
- Within the DCMS Sectors (excluding Tourism), according to median hourly pay, the gender pay gap stood at 23.9% while the disability pay gap was 14.7%; the UK had a lower gender pay gap but a similar disability pay gap.
2. Details:
This publication provides an update on the DCMS workforce based on the latest 2021 data provided by the Office for National Statistics (ONS) Annual Population Survey (APS). For this purpose, estimates will cover both employment and earnings in the DCMS sectors (excluding Tourism) for the 2021 calendar year (January to December).
2.1 Sectors
The estimates in this publication cover employment and earnings in sectors for which DCMS is responsible:
- Civil Society
- Creative Industries
- Cultural Sector
- Digital Sector
- Gambling
- Sport
- Telecoms
- Tourism (Not included in this release)
For details of each sector’s definition, see the associated technical report.
Please note data is not available for the Tourism sector because 2021 estimates from the ONS’s Tourism Satellite Account are yet to be published.
2.2 Measures
Employment
DCMS publishes estimates on the number of filled jobs in the DCMS sectors, and for the UK overall. This includes breakdowns by various demographic groups (e.g. sex, ethnicity, disability etc.). These estimates are calculated using the Annual Population Survey (APS) and aim to provide greater understanding of employment trends and access in DCMS sectors, and of DCMS’ contribution to the UK economy.
Following a move to more machine-readable outputs, employment estimates for previous years have tended to be released as single year files, sometimes with slightly different demographic breakdowns as we have responded to user needs. This publication will compare the latest 2021 calendar year data to the 2020 and 2019 data released in the DCMS Sector National Economic Estimates: 2011 to 2020 publication.
Earnings
DCMS publishes the following earnings estimates:
- Gross hourly pay in main jobs for the DCMS Sectors, using the ONS Annual Population Survey (APS). This is used in these estimates and provides more detailed demographic information. It was last published in the DCMS Sector National Economic Estimates: 2011 to 2020 publication.
- Gross weekly earnings, using the Annual Survey for Hours and Earnings (ASHE). This is more robust for headline measures because data is reported by businesses as part of the Pay As You Earn (PAYE) system of taxation, and has a larger sample size. The latest ASHE estimates were published as part of the DCMS Sector National Economic Estimates: 2011 to 2020 release.
Estimates of earnings across sectors and between different groups, including over time, are important to understand how DCMS Sector industries contribute to the economic wellbeing of the workforce, and whether inequalities exist between workers with different characteristics.
3. Employment
DCMS publishes rolling employment estimates, with the subject of this report focusing on the January 2021 to December 2021 calendar year. All comparisons with previous data will be to the previous calendar year’s estimates (January 2020 to December 2020), or to the equivalent time period in 2019 (January to December 2019) for pre-pandemic comparisons.
Users should note, estimates for Gambling are often based on low sample sizes and therefore may have low accuracy.
3.1 Headline employment
In 2021 the total number of filled jobs in all the DCMS Sectors (excluding Tourism) was 4.3 million (12.9% of all UK employment), representing an increase of 128 thousand jobs (3.1%) compared to 2020 and an opposing trend to the UK overall which fell by 200 thousand jobs (0.6%).
Over the period from 2019 (pre-pandemic) to 2021, DCMS Sector (excluding Tourism) employment increased by 254 thousand jobs (6.3%). By contrast, employment in the UK overall fell by 400 thousand jobs (1.2%).
Estimates for the number of filled jobs in the individual sectors, and their changes compared to the 2020 and 2019 calendar years respectively were as follows:
- Creative Industries: As of 2021, was made up of 2.3 million filled jobs, an increase of 113 thousand (5.1%) compared to the previous calendar year and 234 thousand (11.1%) since 2019 (pre-pandemic).
- Digital Sector: As of 2021, was made up of 1.8 million filled jobs, an increase of 108 thousand (6.3%) compared to the previous calendar year and 249 thousand (16.0%) since 2019 (pre-pandemic).
- Civil Society: As of 2021, was made up of 927 thousand filled jobs, a decrease of 4 thousand (0.5%) compared to the previous calendar year, but an increase of 30 thousand (3.3%) since 2019 (pre-pandemic).
- Cultural Sector: As of 2021, was made up of 708 thousand filled jobs, an increase of 6 thousand (0.9%) compared to the previous calendar year and 31 thousand (4.6%) since 2019 (pre-pandemic).
- Sport: As of 2021, was made up of 527 thousand filled jobs, a decrease of 5 thousand (0.9%) compared to the previous calendar year and 35 thousand (6.3%) since 2019 (pre-pandemic).
- Telecoms: As of 2021, was made up of 189 thousand filled jobs, an increase of 12 thousand (7.1%) compared to the previous calendar year and 11 thousand (6.4%) since 2019 (pre-pandemic).
- Gambling: As of 2021, was made up of 73 thousand filled jobs, an increase of 1 thousand (0.9%) compared to the previous calendar year, but a decrease of 3 thousand (4.0%) since 2019 (pre-pandemic).
Figure 1 - Employment growth in the DCMS Sectors (excluding Tourism) was predominantly driven by increases in the Creative Industries and Digital Sector, the two largest DCMS Sectors (excluding Tourism) by number of jobs. However, it was partially offset by small decreases in the Sport and Civil Society sectors (note that the sum of the sector differences do not equal the overall DCMS change because of overlap between the sectors).
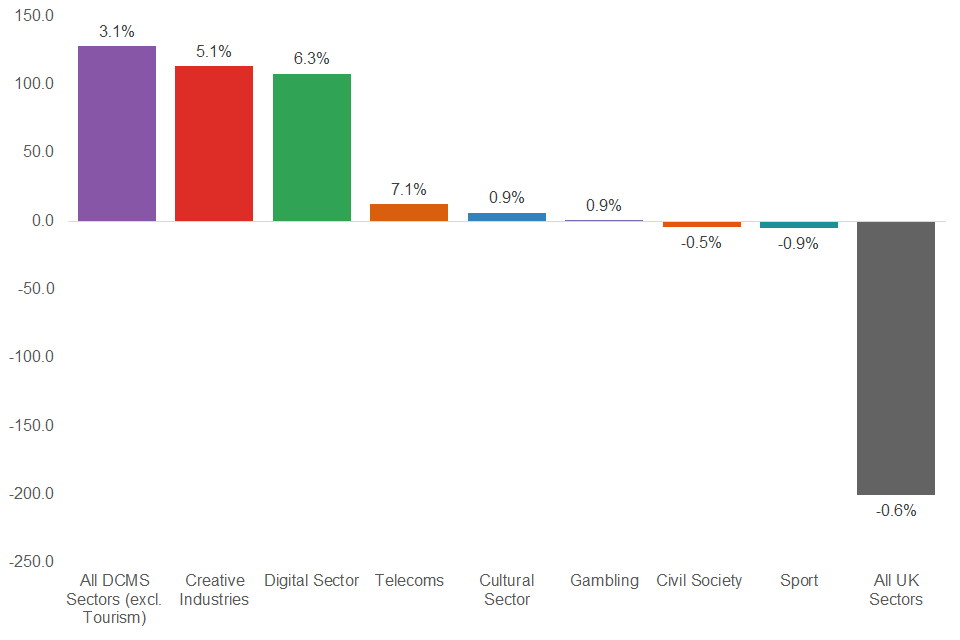
Change in employment, number of filled jobs (thousands) and percentage change, by DCMS sector (excluding Tourism), (2020 to 2021 calendar years).
Consistent with the trend of previous years, in 2021, employment growth in the Creative Industries and the Digital Sector were particularly driven by the industries that they share. Specifically, the “IT, software and computer services” (960 thousand filled jobs) and “Computer programming, consultancy and related activities” (967 thousand filled jobs) sub-sectors made up the largest shares of the Creative and Digital sectors respectively.
Within the “IT, software and computer services” sub-sector, employment increased by 88 thousand filled jobs, while the same increase stood at 82 thousand within the “Computer programming, consultancy and related activities” sub-sector.
There is much overlap between the two sub-sectors, with a substantial portion of employment growth in both sub-sectors, and to an extent the DCMS sectors, coming from the “Computer programming activities” (57 thousand filled jobs) and “Computer consultancy activities” (22 thousand filled jobs) industries.
3.2 Demographics
The APS enables us to estimate multiple breakdowns by demographics when it comes to employment estimates for the DCMS sectors. This section focuses on breakdowns by sex (male and female), disability (reported as people with a disability and people without a disability, as defined under the 2010 Equality Act) and ethnicity (with a focus on ethnic minority groups as a whole, excluding white minorities, and the white ethnic group). However, the published tables contain more information, including breakdowns by region, age and working pattern (full-time or part-time).
In 2021, of the filled jobs in the DCMS Sectors (excluding Tourism), 44.5% were held by women, 13.2% by those classified as being part of an ethnic minority group (excluding white minorities) and 15.0% by those with a disability. This marks a similar representation of ethnic minority groups (excluding white minorities), and of individuals with a disability under the Equality Act 2010, to that of the UK workforce overall (13.1% and 15.4% respectively). However, it marks a worse representation of women than the UK workforce overall (48.1%).
Within the individual DCMS sectors (excluding Tourism), 2021 employment estimates indicate there is great variation in the characteristics of the workforce. The demographic make up of the individual DCMS sectors (excluding Tourism) according to sex, ethnicity and disability status were as follows:
- Creative Industries: As of 2021, the Creative Industries had an estimated share of filled jobs held by women at 38.0%, by people with a disability at 13.3%, and by people from ethnic minority groups (excluding white minorities) at 15.1%.
- Digital Sector: As of 2021, the Digital sector had an estimated share of filled jobs held by women at 30.3%, by people with a disability at 12.4%, and by people from ethnic minority groups (excluding white minorities) at 17.6%.
- Civil Society: As of 2021, Civil Society had an estimated share of filled jobs held by women at 67.9%, by people with a disability at 20.6%, and by people from ethnic minority groups (excluding white minorities) at 9.5%.
- Cultural Sector: As of 2021, the Cultural sector had an estimated share of filled jobs held by women at 49.7%, people with a disability at 16.2%, and by people from ethnic minority groups (excluding white minorities) at 10.6%.
- Sport: As of 2021, the Sport sector had an estimated share of filled jobs held by women at 46.0%, by people with a disability at 14.1%, and by people from ethnic minority groups (excluding white minorities) at 8.1%.
- Telecoms: As of 2021, the Telecoms sector had an estimated share of filled jobs held by women at 32.4%, by people with a disability at 13.6%, and by people from ethnic minority groups (excluding white minorities) at 13.1%.
- Gambling: As of 2021, the Gambling sector had an estimated share of filled jobs held by women at 41.7%, by people with a disability at 20.8%, and by people from ethnic minority groups (excluding white minorities) at 12.3%.
It is to be acknowledged that experiences do differ between ethnic minority groups. For example, in the Digital Sector, the ethnic minority (excluding white minorities) share exceeds the UK workforce average but this comes mainly from a high proportion of workers identifying as an Asian / Asian British ethnicity in the sector (10.6% vs 6.9% for the UK). By contrast, the proportions for other ethnic minority (excluding white minorities) groups are more in line with UK averages and range from 2-3%. This and related findings can be found in our published tables, which report the following ethnicity breakdowns, apart from where these breakdowns do not pass disclosure control:
- White (note: this group includes white minority groups)
- Mixed / Multiple ethnic groups
- Asian / Asian British
- Black / African / Caribbean / Black British
- Other ethnic group
Figure 2 - There is great variation in the demographic make-up of the DCMS Sectors (excluding Tourism). Female representation is by far the largest in Civil Society, whereby women occupied the majority of the sectors filled jobs, substantially larger than the UK and DCMS average. Meanwhile, the Digital Sector had the largest share of people from an ethnic minority group (excluding white minorities), but had the smallest representation of women and people with a disability.
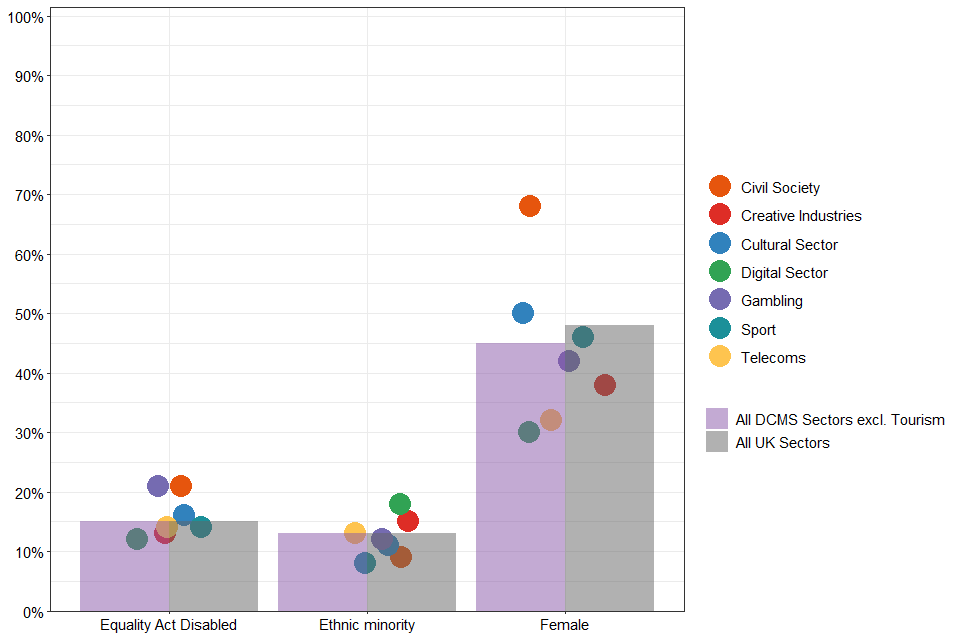
Employment, demographic breakdown (%), by DCMS sectors (including All DCMS Sectors excl. Tourism and All UK Sectors) (note: Within this figure ethnic minority excludes people classed as white minorities)
4. Earnings
DCMS publishes earnings estimates based on two data sources: The Annual Population Survey (APS) and the Annual Survey for Hours and Earnings (ASHE). This report focuses on earnings in the 2021 calendar year derived from the APS. Earnings estimates based on the APS were last published as part of the DCMS Sector National Economic Estimates: 2011 to 2020 release, with calendar year data provided from 2016 to 2020.
These estimates provide a value of median hourly gross pay for individuals with a main job in the DCMS sectors (and all UK sectors).
Users should note, earnings estimates based on the APS are less robust than those based on ASHE and where data is not reported it is due to low sample size. For this reason we have only provided summaries of earnings by ethnicity for the two largest sectors: Creative Industries, and the Digital Sector. The preferred source for headline earnings estimates is the ASHE, with the latest data available in the DCMS Sector National Economic Estimates: 2011 to 2020 release.
While the Gambling sector is reported, users should be aware estimates are often based on low sample size and therefore may have low accuracy.
4.1 Headline earnings
As of 2021, median hourly pay was estimated to be higher in the DCMS Sectors (excluding Tourism) than the UK overall, at £15.68 compared to £13.51. Breaking this down into the individual sectors reveals all DCMS sectors apart from Gambling and Sport had higher pay than the UK average.
Detail on the median hourly earnings of workers within the DCMS sectors and how they compare to the UK overall are as follows.
- Digital Sector: As of 2021, an estimated median hourly pay of £20.74; approximately 53.5% greater pay than the UK average.
- Creative Industries: As of 2021, an estimated median hourly pay of £19.24; approximately 42.4% greater pay than the UK average.
- Telecoms: As of 2021, an estimated median hourly pay of £17.30; approximately 28.1% greater pay than the UK average.
- Cultural Sector: As of 2021, an estimated median hourly pay of £15.08; approximately 11.6% greater pay than the UK average.
- Civil Society: As of 2021, an estimated median hourly pay of £13.63; approximately 0.9% greater pay than the UK average.
- Gambling: As of 2021, an estimated median hourly pay of £10.64; approximately 21.2% less pay than the UK average.
- Sport: As of 2021, an estimated median hourly pay of £10.00; approximately 26.0% less pay than the UK average.
Figure 3 - Median hourly pay in the DCMS Sectors (excluding Tourism) exceeded the UK average, with the Digital, Creative and Telecoms sectors all having above average hourly pay when compared to the DCMS Sectors (excluding Tourism) total, and substantially larger pay than the UK overall.
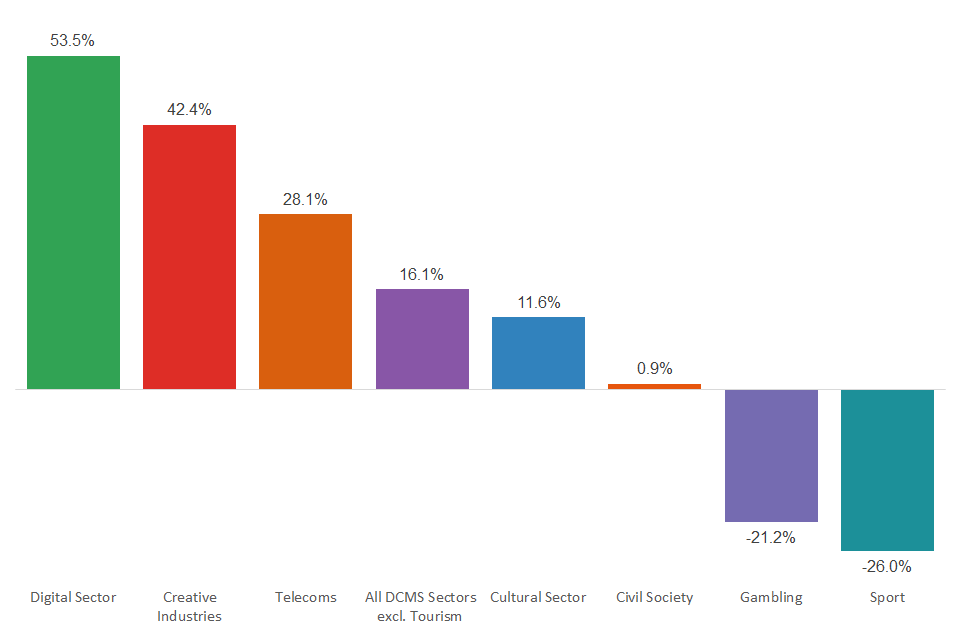
Median hourly gross pay, percentage difference compared to the UK overall, by DCMS sector (excluding Tourism).
4.2 Demographics
The APS enables us to estimate multiple breakdowns by demographics when it comes to earnings estimates for the DCMS sectors. This section focuses on breakdowns by sex (male and female), disability (reported as people with a disability and people without a disability, as defined under the 2010 Equality Act) and ethnicity (where data is less available due to low sample sizes but reported by ethnic group as set out in the bullet points directly above Figure 2). However, the published tables contain more information, including breakdowns by region, age and working pattern (full-time or part-time).
These findings are presented in terms of percentage differences at the median; for example, a median gender pay gap of 20%, which can equivalently be thought of as, for every £1 earned by a man, a woman earns £0.80 (at the median).
These percentage differences indicate that the gender pay gap is greater in the DCMS Sectors (excluding Tourism) than the UK overall, while the disability pay gap is similar. The estimated gender and disability pay gaps for the UK and the DCMS Sectors (excluding Tourism) were as follows:
- DCMS Sectors (excluding Tourism): At the median, for every £1.00 earned by a man in the DCMS Sectors (excluding Tourism), a woman earns £0.76 (a gender pay gap of 23.9%). Meanwhile, at the median, for every £1.00 earned by a non-disabled person in the DCMS Sectors (excluding Tourism), a disabled person earns £0.85 (a disability pay gap of 14.7%).
- UK overall: At the median, for every £1.00 earned by a man in the UK, a woman earns £0.85 (a gender pay gap of 15.1%). Meanwhile, at the median, for every £1.00 earned by a non-disabled person in the UK, a disabled person earns £0.85 (a disability pay gap of 14.6%).
Of the individual DCMS Sectors (excluding Tourism), the gender pay gap was estimated to be largest in the Telecoms sector but smallest in the Gambling sector. On the other hand, the disability pay gap was estimated to be largest in the Civil Society sector while negative in the Telecoms sector (a negative disability pay gap indicates that disabled people earn more than non-disabled people).
The gender and disability pay gaps for the individual DCMS sectors (excluding Tourism), at the median, were as follows:
- Creative Industries: At the median, for every £1.00 earned by a man in the Creative Industries, a woman earns £0.78 (a gender pay gap of 22.2%). At the median, for every £1.00 earned by a person without a disability, a person with a disability earns £0.94 (a disability pay gap of 6.0%).
- Digital Sector: At the median, for every £1.00 earned by a man in the Digital Sector, a woman earns £0.81 (a gender pay gap of 18.8%). At the median, for every £1.00 earned by a person without a disability, a person with a disability earns £0.98 (a disability pay gap of 2.1%).
- Civil Society: At the median, for every £1.00 earned by a man in the Civil Society sector, a woman earns £0.86 (a gender pay gap of 13.6%). At the median, for every £1.00 earned by a person without a disability, a person with a disability earns £0.87 (a disability pay gap of 13.2%).
- Cultural Sector: At the median, for every £1.00 earned by a man in the Cultural sector, a woman earns £0.93 (a gender pay gap of 7.3%). At the median, for every £1.00 earned by a person without a disability, a person with a disability earns £0.91 (a disability pay gap of 8.8%).
- Sport: At the median, for every £1.00 earned by a man in the Sports sector, a woman earns £0.87 (a gender pay gap of 12.8%). At the median, for every £1.00 earned by a person without a disability, a person with a disability earns £0.92 (a disability pay gap of 7.8%).
- Telecoms: At the median, for every £1.00 earned by a man in the Telecoms sector, a woman earns £0.73 (a gender pay gap of 27.5%). At the median, for every £1.00 earned by a person without a disability, a person with a disability earns £1.06 (a disability pay gap of -6.2%).
- Gambling: At the median, for every £1.00 earned by a man in the Gambling sector, a woman earns £0.94 (a gender pay gap of 6.3%). At the median, for every £1.00 earned by a person without a disability, a person with a disability earns £0.99 (a disability pay gap of 1.0%).
DCMS published more accurate estimates of the gender pay gap based on the Annual Survey of Hours and Earnings (ASHE), with the most up to date data available in the DCMS Sector National Economic Estimates: 2011 to 2020 release.
Looking at DCMS Sectors (excluding Tourism) earnings broken down by different ethnic groups, much like the UK overall, people of Black/ African/ Caribbean/ Black British ethnicity had the lowest median earnings of any ethnic group. However, unlike the UK overall, for the DCMS Sectors (excluding Tourism) people of Asian/ Asian British ethnicity were estimated to have the highest median hourly pay.
More broadly, there is substantial variation in median pay within the DCMS sectors depending on ethnicity.
Ethnicity information for earnings in the DCMS sectors is published in our tables. However, the data are relatively sparse due to low sample sizes which is why we have presented limited analysis here for example in comparison with the employment section.
5. Glossary
5.1 Median
The median is a type of average, found by taking the middle value of the variable of interest. In this report, we are interested in earnings, so we look at all of the surveyed earnings responses in order of size and take the value that falls in the middle. Using this measure of central tendency avoids the skew created by extreme values (extremely large or extremely small values).
5.2 Gender pay gap
For the purpose of this report, we define the gender pay gap as the difference in median hourly pay between men and women in terms of men’s pay. This is calculated as follows:
- Take the median hourly pay for men and subtract the median hourly pay for women.
- divide the result by median hourly pay of men.
- multiply the result by 100.
5.3 Disability pay gap
For the purpose of this report, we define the disability pay gap as the difference in median hourly pay between disabled individuals and non-disabled individuals (as defined under the Equality Act 2010), in terms of non-disabled individuals’ pay. This is calculated as follows:
- Take the median hourly pay for non-disabled people and subtract the median hourly pay for disabled people.
- divide the result by median hourly pay of non-disabled people.
- multiply the result by 100.