DCMS Sector Economic Estimates: Employment Technical and Quality Assurance Report
Updated 22 November 2024

© Crown copyright 2024
This publication is licensed under the terms of the Open Government Licence v3.0 except where otherwise stated. To view this licence, visit nationalarchives.gov.uk/doc/open-government-licence/version/3 or write to the Information Policy Team, The National Archives, Kew, London TW9 4DU, or email: psi@nationalarchives.gov.uk.
Where we have identified any third party copyright information you will need to obtain permission from the copyright holders concerned.
This publication is available at https://www.gov.uk/government/statistics/dcms-sector-economic-estimates-employment-oct-2020-sep-2021/dcms-sector-economic-estimates-employment-technical-and-quality-assurance-report
DCMS Sectors Economic Estimates: Employment, October 2020 to September 2021– Technical and quality assurance report
This document covers the following topics:
- an overview of the content covered in the statistical release ‘DCMS Economic Estimates: Employment October 2020 to September 2021’
- an overview of the DCMS Sectors, how they are defined, and limitations of these definitions
- the methodology underlying the statistical release, including data sources
- the processes used to check that the estimates have been produced correctly
- other sources of information for the DCMS sectors
- further information, including contact details for DCMS statisticians.
1. Overview of release
The statistics release ‘DCMS Sector Economic Estimates: Employment October 2020 to September 2021’ provides an estimate of the number of filled jobs in the DCMS sectors (excluding Tourism) for the 12-month period between October 2020 and September 2021. There is significant overlap between DCMS sectors therefore users should be aware that the estimate of the DCMS total is lower than the sum of the individual sectors. These estimates are derived from two data sources (Annual Population Survey and Labour Force Survey) and contain breakdowns including, but not limited to employment type (i.e. employed or self-employed), region of work, nationality, gender, ethnicity and socio-economic background.
Employment estimates based on APS data are an average over the 12-month period from October 2020 to September 2021. Employment estimates based on LFS data are an average over the period July 2021 to September 2021 because details related to parental occupation, on which estimates of socio-economic background are based, are only obtained in Q3 of the LFS questionnaires. More detail on the two data sources is available in section 3.
Estimates for the number of jobs in the Tourism sector are not available in this release. This is because the estimates for 2021 have not yet been published by ONS as part of the Tourism Satellite Account series. The Office for National Statistics (ONS) is the provider of the underlying data used for the analysis presented within this release. As such, the same data sources are used for DCMS estimates as for national estimates, enabling comparisons to be made on a consistent basis.
1.1 Code of Practice for Statistics
DCMS Sector Employment Estimates series is a National Statistic and has been produced to the standards set out in the Code of Practice for Statistics. In June 2019, the DCMS Sector Economic Estimates were badged as National Statistics. This affirms that the statistics have met the requirements of the Code of Practice for Statistics.
This followed a report by the Office for Statistics Regulation in December 2018, which stated that the series could be designated as National Statistics subject to meeting certain requirements. Since the report, we have striven to improve our publications by providing summaries of other notable sources of data, more detail on the nature and extent of the overlap between the sectors, and further information on the quality and limitations of the data. We will continue to improve the series in the future, in line with the recommendations of the report. We encourage our users to engage with us so that we can improve our statistics and identify gaps in the statistics that we produce.
1.2 Users
The users of these statistics fall into five broad categories:
- Ministers and other political figures
- Policy and other professionals in DCMS and other Government departments
- Industries and their representative bodies
- Charitable organisations
- Academics
The primary use of these statistics is to monitor the performance of the industries in the DCMS sectors, helping to understand how current and future policy interventions can be most effective.
2. Sector definitions
In order to measure the size of the economy it is important to be able to define it. DCMS uses a range of definitions based on internal or UK agreed definitions. Definitions are predominantly based on the Standard Industrial Classification 2007 (SIC) codes. This means nationally consistent sources of data can be used and enables international comparisons.
2.1 Overview of DCMS Sectors
Main sector definitions
The sectors for which DCMS has responsibility are:
- Civil Society
- Creative Industries
- Cultural Sector
- Digital Sector
- Gambling
- Sport
- Telecoms
- Tourism
The Tourism sector is not included in this release as estimates for 2021 have not yet been published by ONS as part of the Tourism Satellite Account series.
We have updated the methodology for estimating employment in Civil Society. Therefore, caution should be applied when comparing with previously published data. We have recently published a coherent back series with the most up to date methodology in the ‘DCMS Sector National Economic Estimates: 2011 – 2020’ release.
Each sector definition has been designed to be the best possible measure of that sector, rather than being considered as part of a greater whole. This approach has led to overlap between DCMS sectors. For example, the Cultural Sector is defined using SIC codes that are nearly all within the Creative Industries, whilst the Telecoms Sector is completely within the Digital Sector.
Figure 1 below visually shows the overlap between DCMS Sectors in terms of industries. Users should note that this does not give an indication of the magnitude of the value of overlap.
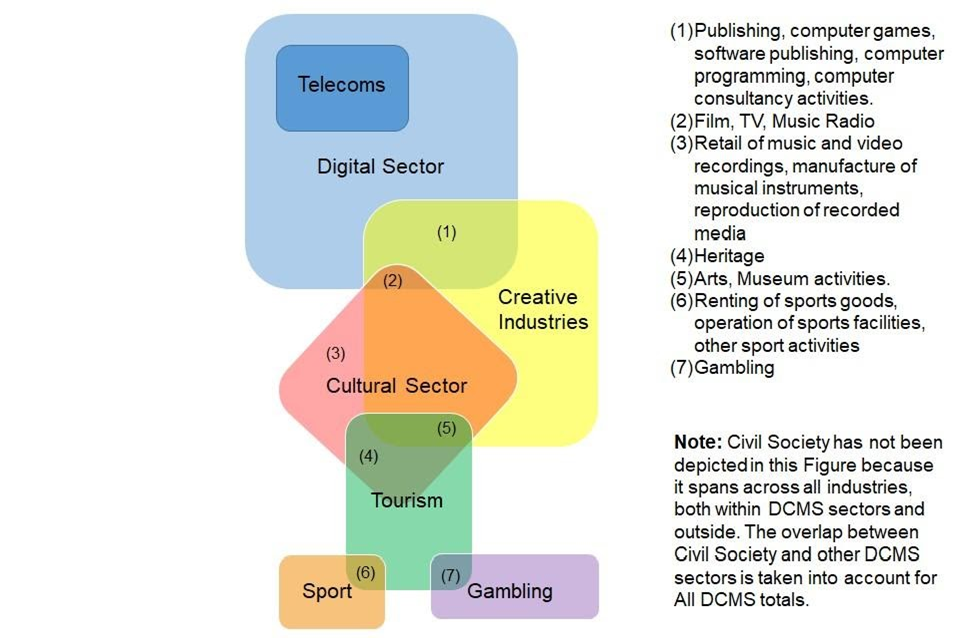
Figure 1. Commonality of industries across the DCMS Sectors
The exact size of the overlap between sectors varies by measure. For the figures in this release, the overlap between the sectors is as illustrated in Figure 2, below. Here the amount of one bar that is vertically above another bar indicates the size of the overlap, for example, the fact that the entirety of the Telecoms bar above the digital bar, indicates that all of the Telecoms sector is within the Digital sector.
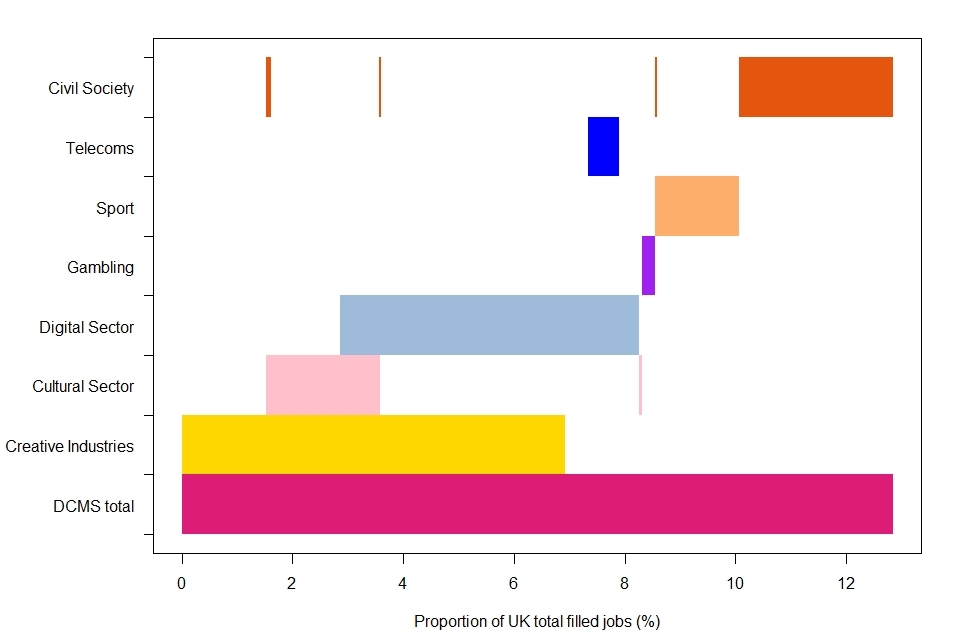
Figure 2: Size of the overlap between DCMS sectors, Employment, October 2020 to September 2021, UK
2.2 Other sector definitions
Additional analysis is presented in the employment release for the Audio-Visual sector and the Computer Games sector. The definition of the Audio-Visual sector (see below) is intended to reflect the sectors covered by the EU Audio Visual Media Services Directive.
- 59.11 - Motion picture, video and television programme production activities
- 59.12 - Motion picture, video and television programme post-production activities
- 59.13 - Motion picture, video and television programme distribution activities
- 59.2 - Sound recording and music publishing activities
- 60.1 - Radio broadcasting
- 60.2 - Television programming and broadcasting activities
- 63.91 - News agency activities
- 63.99 - Other information service activities n.e.c.
- 77.22 - Renting of video tapes and disks
- 77.4 - Leasing of intellectual property and similar products, except copyrighted works
The Computer Games sector combines the 4-digit SIC code 58.21 (Publishing of Computer Games) and 62.01/1 (Ready-made interactive leisure and entertainment software development).
A number of software programming companies in 62.01 – ‘Computer programming activities’ may also contribute to the output of computer games, as part of a range of programming activities. This is not included in these computer games estimates, but will have been implicitly included in the ‘IT, software and computer services’ group in the main estimates.
2.3 Details and limitations of sector definitions
This section looks at sector definitions used in this release in more detail, and provides an overview of limitations.
There are substantial limitations to the underlying classifications. As the balance and make-up of the economy changes, the SIC, finalised in 2007, is less able to provide the detail for important elements of the UK economy related to DCMS Sectors. The SIC codes used to produce these estimates are a ‘best fit’, subject to the limitations described in the following section.
Creative Industries
The Creative Industries were defined in the Government’s 2001 Creative Industries Mapping Document as “those industries which have their origin in individual creativity, skill and talent and which have a potential for wealth and job creation through the generation and exploitation of intellectual property”.
To allow the Creative Industries to be measured, DCMS worked with others to develop a statistical definition of the Creative Industries which reflects this definition. DCMS uses a “Creative Intensity” to determine which industries (at 4 digit SIC) are Creative. The Creative Intensity is the proportion of occupations in an industry that are creative and, if the intensity is above a set threshold, that industry is typically defined as Creative. More information can be found in the 2016 methodology document.
Cultural Sector
There are significant limitations to the DCMS measurement of the cultural sector arising from the lack of detailed disaggregation possible using the standard industrial classifications. There are many cases where culture forms a small part of an industry classification and therefore cannot be separately identified and assigned as culture using standard data sources. DCMS consulted on the definition of Culture and published a response in April 2017.
It is recognised that, due to the limitations associated with SIC codes, the SIC code used in past publications as a proxy for the Heritage sector (91.03 - Operation of historical sites and building and similar visitor attractions) is likely to be an underestimate of this sector’s value. We have changed the name of the Heritage sector to ‘Operation for historical sites and similar visitor attractions’ to reflect this.
Digital Sector
The definition of the Digital sector used by DCMS is based on the OECD definition of the ‘information society’. This is a combination of the OECD definition for the “ICT sector” as well as including the definition of the “content and media sector”. An overview of the SIC codes included in each of these sectors is available in the OECD Guide to Measuring the Information Society 2011 (see Box 7.A1.2 on page 159 and Box 7.A1.3 on page 164).
The definition used for the Digital Sector does not allow consideration of the value added of “digital” to the wider economy e.g. in health care or construction. DCMS policy responsibility is for digital across the economy and therefore this is a significant weakness in the current approach.
Sport
For the purpose of this publication the statistical definition of sport has been used. This incorporates only those 4-digit Standard Industrial Classification (SIC) codes which are predominantly sport (see the definitions table published alongside the methodology note).
DCMS also publishes estimates of sport based on the EU agreed Vilnius definition. The Vilnius definition is a more comprehensive measure of sport which considers the contribution of sport across a range of industries, for example sport advertising, and sport related construction. The methodology for the DCMS Sport Satellite Account is currently being reviewed and therefore has not been used in these estimates.
Civil Society
In DCMS employment estimates, respondents are considered to be part of the Civil Society sector if the organisation they work for is not “a private firm or business, a limited company”, and is a “charity, voluntary organisation or trust”. As this is only collected for respondents’ first jobs, estimates in the number of filled jobs in Civil Society are based on main jobs only, and do not include second jobs (unlike estimates for all other sectors). This estimate is therefore an under-estimate on two counts: it does not include second jobs, and it does not include volunteers, social enterprises and mutuals.
3. Methodology
3.1 Data Sources
The employment statistics are calculated using the Office for National Statistics (ONS) Annual Population survey (APS) and Labour Force (LFS).
Labour Force Survey
The Labour Force Survey (LFS) is a study of the employment circumstances of households living in private addresses in the UK and provides the official measures of employment and unemployment. Its purpose is to provide information on the UK labour market which can then be used to develop, manage, evaluate and report on labour market policies. The LFS is run quarterly, with some question modules varying between quarters. This means it can cover a wide range of topics, including information on socio-economic background, but can have a low sample size.
Annual Population Survey
The APS is a household survey that combines four quarters of the Labour Force Survey with an additional sample boost. Information collected includes the details of employment (e.g. location, industry, seniority, occupation, income), circumstances (e.g. housing tenure, health) and demography (e.g. nationality, age, ethnicity). Responses are weighted to population totals.
3.2 Method
The majority of the data processing for both surveys is done by ONS, with DCMS receiving cleaned and weighted respondent level data. To produce estimates of employment we remove any respondents who are not in work from the dataset for analysis. We define ‘in work’ as those with a first job who are an employee or self-employed and those who have a second job who are employees, self-employed or have otherwise not stated.
As we estimate employment as the number of filled jobs, we restructure the data to be on a per job basis, rather than a respondent basis. We then select entries that are relevant for a particular measure, e.g. all entries with an SIC code of 85.52 for total employment in Cultural Education, and aggregate over the associated population weights to generate an estimate of the total filled jobs.
As part of the aggregation process we also apply disclosure control measures to prevent the identification of any respondents. We suppress values where the number of respondents for a cell is below a set threshold. We also apply secondary suppression to prevent disclosure via differencing.
3.3 Changes in this release
Typically, DCMS sector employment statistics include a variety of demographic breakdowns, including age, sex, region of work, nationality, ethnicity, disability, highest qualification and occupation grouping. However, for this release the APS data will not contain information on occupation grouping, due to the movement to SOC2020 and the ongoing work into defining the Digital and Creative occupations under this new framework.
These statistics also include estimates for social mobility as determined by a respondent’s socio-economic background and their current occupation status. This is published in a separate LFS table. Specifically, we take a similar approach to that recommended by the Social mobility Commission in obtaining details on a respondent’s socio-economic background as measured by their parent/guardian’s occupation status, living status and household earning status when the respondent was 14 years old. This is then grouped with the respondents’ current occupational class (according to the latest SOC to NS-SEC guidance) to give a measure of mobility.
4. Quality assurance processes
This document summarises the quality assurance processes applied during the production of these statistics by our data providers, the Office for National Statistics (ONS), as well as those applied by DCMS.
4.1 Quality assurance processes at ONS
Quality assurance at ONS takes place at a number of stages. The various stages and the processes in place to ensure quality for the data sources are outlined below. It is worth noting that information presented here on data sources are taken from the Annual Population Survey (QMI) and the Labour Force Survey performance and quality monitoring report (PMQ). This work should be credited to colleagues at the ONS.
ONS Labour Force Survey
The primary purpose of the Labour Force Survey (LFS) is “the prompt publication of key aggregate, whole economy, indicators, for the integrated assessment of labour market conditions”. This includes all aspects of people’s work, including the education and training needed to equip them for work, the jobs themselves, job-search for those out of work and income from work and benefits.
Sample design
Output from the LFS is intended to be representative of the entire population of the UK and has been quarterly since 1992. Each quarterly sample is made up of 5 waves. Each wave samples approximately 12,000 households, giving a total sample size of approximately 60,000 UK households, of which around 40,000 households (100,000 individuals) respond per quarter. Each cohort is interviewed in 5 successive quarters, so that in any one quarter, one cohort will be receiving their first interview (this is wave 1), another cohort their second (this is wave 2), and so on. This means that 20% of the sample is replaced every quarter.
ONS Annual Population Survey
The purpose of the APS is to provide information on important social and socio-economic variables at local levels. The APS is not a stand-alone survey, but uses data from the Labour Force Survey (LFS) and a local sample boost.
Sample design
The APS survey year is divided into quarters of 13 weeks. From January 2006, it has been conducted on the basis of calendar quarters: January to March (Quarter 1), April to June (Quarter 2), July to September (Quarter 3) and October to December (Quarter 4). The APS design is not stratified.
The APS data set is created by taking waves 1 and 5 from four successive quarters, with rolling-year data from the English, Welsh and Scottish Local Labour Force Survey, to obtain an annually representative sample of around 80,000 households. Over the period of the 4 quarters, waves 1 and 5 will never contain the same households to avoid the inclusion of responses from any household more than once in the dataset.
Sampling frame
The sampling frame for the survey in Great Britain is the Royal Mail Postcode Address File (PAF) and the National Health Service (NHS) communal accommodation list. Due to the very low population density in the far north of Scotland (north of the Caledonian Canal), telephone directories are used as sampling frames. A systematic sample is drawn each quarter from these three sampling bases, and as the PAF is broken down geographically, the systematic sampling ensures that the sample is representative at regional level. In Northern Ireland, the Rating and Valuation Lists (which serve for the administration of land taxes) are used.
Data collection
Interviews in all waves are carried out either on a face-to-face basis with the help of laptops, known as Computer Assisted Personal Interviews (CAPI) or on the telephone, known as Computer Assisted Telephone Interviews (CATI). Information is collected using a software package called Blaise.
Validation and quality assurance
- Accuracy is the degree of closeness between an estimate and the true value. As both surveys are sample surveys, they provide estimates of population characteristics rather than exact measures. At ONS, confidence intervals are used to present the sampling variability of the survey. For example, with a 95% confidence interval, it is expected that in 95% of survey samples, the resulting confidence interval will contain the true value that would be obtained by surveying the whole population.
- Comparability is the degree to which data can be compared over time and domain, coherence is the degree to which data are derived from different sources or methods but refer to the same topic and are similar. Some sources provide data that overlap with APS/LFS data on employment, unemployment and earnings. More information on these sources are available here.
- Statistical disclosure control methodology is also applied to the datasets before release. This ensures that information attributable to an individual is not disclosed.
- On each quarterly LFS dataset, the variable frequencies are compared with the previous period. This identifies any significant discontinuities at an early stage. All discontinuities judged significant are investigated to determine the reason for the discontinuity. Is it the product of questionnaire revision or processing error, derived variable revision or error or real-world change? This process also ensures that the metadata associated with each variable are correct.
- Specific main derived variables are checked in detail by extracting the underlying variables and recalculating in another application, then comparing the results with the values in the dataset. This ensures that the program used to calculate the derived variables is working correctly.
Quality assurance processes at DCMS
The majority of quality assurance of the data underpinning the DCMS Sectors Economic Estimates Employment release takes place at ONS, through the processes described above. However, further quality assurance checks are carried out within DCMS at various stages.
Production of the report is typically carried out by one member of staff, whilst quality assurance is completed by at least one other, to ensure an independent evaluation of the work.
Data requirements
For both the APS and LFS data, DCMS discusses its data requirements with ONS and these are formalised as a Data Access Agreement (DAA). The DAA covers which data are required, the purpose of the data, and the conditions under which ONS provide the data. Discussions of requirements and purpose with ONS improve the understanding of the data at DCMS, helping us to ensure we receive the correct data and use it appropriately.
Production and data analysis
At the production stage, data are aggregated up to produce information about DCMS sectors and sub-sectors before inputting the data into the formal data tables ready for analysis. Disclosure control is also applied as part of this process.
The statistical lead ensures a number of quality assurance checks are undertaken during this process. These checks include :
- Whether disaggregations sum to the overall total. E.g:
- Do sub-sectors within the Creative Industries sum to the Creative Industries total?
- Do the individual regional breakdowns sum up to the total for that sector?
- “Sense checks” of the data. E.g.:
- Are the estimates similar from one year to the next? How do the figures compare with ONS published totals?
- Looking at any large differences between the data and possible causes to these.
- Checking that the correct SIC codes have been aggregated together to form DCMS sector (and sub-sector) estimates. Are all SIC codes we require included? Are there any non-DCMS SIC codes that have been included by accident?
- Checking it is not possible to derive disclosive data from the figures that will be published.
- Making sure the correct data has been pasted to the final tables for publication, are accessible, formatted correctly, and have appropriate documentation.
Having checked the quality of the data, analysis is then conducted to outline the key trends and patterns. This is then checked to ensure all statements, figures and charts are correct.
Dissemination
Finalised figures are published as OpenDocument spreadsheets on GOV.UK, with summary text on the webpage. These are produced by the workforce statistics lead who, beforehand, checks with the ONS on details of how to interpret the statistics. Before publishing, a quality assurer checks the figures match between the tables and the GOV.UK page summary. The quality assurer also makes sure any statements made about the figures (e.g. regarding trends) are correct according to the analysis and checks spelling or grammar errors.
5. External data sources
It is recognised that there are always different ways to define sectors, but their relevance depends on what they are needed for. Government generally favours classification systems which are
- rigorously measured,
- internationally comparable,
- nationally consistent, and
- ideally applicable to specific policy interventions.
These are the main reasons for DCMS constructing sector classifications from Standard Industrial Classification (SIC) codes. However, DCMS accepts that there are limitations with this approach and alternative definitions can be useful where a policy-relevant grouping of businesses crosses existing Standard Industrial Classification (SIC) codes. DCMS is aware of other estimates relevant to DCMS sectors. These estimates use various methods and data sources, and can be useful for serving several purposes, e.g. monitoring progress under specific policy themes such as community health or the environment, or measuring activities subsumed across a range of SIC’s.
The ONS use the quarterly Labour Force Survey for their estimates of UK-wide employment rates. Our APS employment estimates of the number of filled jobs in the DCMS sectors takes a similar approach. However, as the APS uses two waves of the LFS, the datasets are not directly comparable and the ONS published figures will differ slightly from ours.
For employment statistics more broadly, the main alternative is the Business Register and Employment Survey (BRES). This has the advantage of asking businesses directly about their employees and hence is likely to capture the sector of employees more accurately than a household survey. However, it does not contain the range of demographic breakdowns that the APS does, which enables us to build a fuller picture of employment in our sectors, using a still-robust data source, and does not include the self-employed, which constitute a substantial part of the workforce for many DCMS sectors.
For some parts of the DCMS Sectors, estimates have been attempted to a fuller definition of the sector. In particular, for the Heritage subsector DCMS only looks at economic activity attributed to the “Operation of historical sites and attractions” (SIC 91.03). However, Historic England (working with the CEBR) have published their own estimate of the number of jobs supported by Heritage, using a wider definition. UK Music have done likewise, for the Music sector, again using a wider definition.
It is recognised that there will be other sources of evidence from industry bodies, for example, which have not been included above. We encourage statistics producers within DCMS sectors who have not been referenced to contact the economic estimates team at evidence@dcms.gov.uk.
6. Further information
For enquiries on this release, please email evidence@dcms.gov.uk.
For general enquiries contact:
Department for Digital, Culture, Media and Sport 100 Parliament Street London SW1A 2BQ Telephone: 020 7211 6000
DCMS statisticians can be followed on Twitter via @DCMSInsight.
This release is a National Statistics publication and has been produced to the standards set out in the Code of Practice for Statistics.