Digital sector economic estimates: Trade, 2021 - main report
Updated 9 April 2025

© Crown copyright 2025
This publication is licensed under the terms of the Open Government Licence v3.0 except where otherwise stated. To view this licence, visit nationalarchives.gov.uk/doc/open-government-licence/version/3 or write to the Information Policy Team, The National Archives, Kew, London TW9 4DU, or email: psi@nationalarchives.gov.uk.
Where we have identified any third party copyright information you will need to obtain permission from the copyright holders concerned.
This publication is available at https://www.gov.uk/government/statistics/dcms-and-digital-sector-economic-estimates-trade-2021/digital-sector-economic-estimates-trade-2021-main-report
1. Background
- Release date: 3 August 2023
- Next release: Spring/Summer 2024
- Geographic coverage: United Kingdom
- Time coverage: 2016 to 2021
- Responsible analysts: Eri Hutchinson and Zoe Kimber
This release provides estimates for the following measures for 2021:
- estimates of exports and imports of goods in the digital sector
- estimates of exports and imports of services by businesses in the digital sector
Estimates of trade in services for the telecoms sector, which is wholly included in the digital sector, are also provided. The estimates for trade in goods for telecoms are not covered in this release, as there are no formally recognised telecoms imports or exports from the data sources available.
Estimates of trade in services and trade in goods are not comparable on any basis as they use different data sources and different definitions as to what constitutes an import or an export. See the accompanying technical report for further information.
This release includes figures up to 2021 i.e. these estimates are affected by EU-Exit and the COVID-19 pandemic. Caution is advised when making year on year comparisons of trade in goods or services due to the combined effects of the national and international lockdown restrictions as a result of the pandemic, EU-Exit uncertainty and border disruptions which contributed to the volatility in UK goods and services trade. [footnote 1] See Annex A for a timeline of events and pieces of legislation that occurred between 2016 and 2021 relevant to the movements of goods and people.
This publication, including the accompanying data tables, includes data for the period 2016 to 2021. This is the earliest year for which data is available for trade in goods and services in the DCMS sectors, following the creation of the Department for Science, Innovation and Technology, DSIT.
Estimates are given in current prices and have not been adjusted for inflation. Year on year increases are therefore likely to be higher than the ‘real’ (inflation-adjusted) value. Changes over time are therefore reported here as changes in the proportion of total UK imports and exports.
2. Headline findings
2.1 Trade in goods
Trade in digital sector goods in 2021 is estimated as:
- £38.1 billion of goods imports, 7.5% of total UK goods imports (down from 8.3% in 2020 and down from 7.7% in 2019)
- £13.8 billion of goods exports, 4.0% of total UK goods exports (down from 4.8% in 2020 and down from 4.7% in 2019)
2.2 Trade in services
Trade in services by businesses in digital sectors in 2021 is estimated as:
- £34.1 billion of service imports, 19.3% of total UK service imports (down from 21.4% in 2020 and up from 15.4% in 2019)
- £59.3 billion of service exports, 18.9% of total UK service exports (similar to 2020 and up from 16.3% in 2019)
3. Trade in goods
Estimates of trade in goods are calculated on a “cross-border” measure of trade; a good is recorded as an export or import when it physically leaves or enters the economic territory of a country. Due to the different definitions and calculations, estimates of trade in goods are not comparable on any basis to the estimates of trade in services. From 1 January 2021, Great Britain to EU goods export statistics are compiled directly from customs export declarations. As a result, there is a break in the time series for UK to EU export estimates in January 2021.[footnote 2] See the data sources section and methodology note for further information.
Imports of digital sector goods have been consistently higher than exports between 2016 and 2021 (the years of which data are available). This is consistent with the wider UK economy, as the UK is a net importer of goods.[footnote 3]
The proportion of total UK trade in goods accounted for by goods in the digital sector has decreased between 2019 (pre-pandemic) and 2021 for both imports (7.7% to 7.5%) and exports (4.7% to 4.0%), as shown in Figure 1. Compared to 2020, goods imports also decreased from 8.3% and goods exports decreased from 4.8%.
Figure 1: Trade in digital sector goods, including as a percentage of the UK total: 2016 to 2021

3.1 Trade in the digital sector
In 2021, the value of goods imported by the digital sector exceeded the value of goods exported by £24.3 billion. This was predominantly due to the ‘Manufacturing of electronics and computers’ sub-sector.
Figure 2: The net balance of trade in goods in the digital sector and sub-sectors, current prices, 2021, UK (£ billions)
| Sector | Net balance of trade in goods (£ billions) |
|---|---|
| Digital sector | -24.3 |
| Manufacturing of electronics and computers | -24.9 |
| Publishing (excluding translation and interpretation activities) | 0.8 |
| Software publishing | 0.0 |
| Film, TV, video, radio and music | -0.1 |
A negative net trade balance indicates that the value of goods imported is higher than the value of goods exported.
3.2 Trade with individual countries
This section summarises trade in digital sector goods by partner country in 2021 (Figure 3).
Imports of goods
China (£15.5 billion) was the largest source for digital sector goods imports to the UK in 2021, followed by the Netherlands (£3.9 billion).
China (£63.3 billion) was also the largest source for goods imports across the UK economy as a whole, followed by Germany (£53.8 billion) [footnote 3].
Exports of goods
The USA (£1.9 billion) was the largest destination for digital sector goods exports in 2021, followed by Germany (£1.8 billion).
This is true for the wider UK economy as a whole. The USA (£43.5 billion) was the largest export partner country for goods across the UK economy as a whole, followed by Germany (£29.8 billion).[footnote 3]
Figure 3: The top 5 countries that businesses in the digital sector imported the most goods from and exported the most goods to in 2021

4. Trade in services
Estimates of trade in services are classified by the business involved in the trade and not the service provided. They are calculated on a change of ownership (balance of payments) measure of trade - if trade moves across land borders but remains under the same ownership this is not counted as trade. Estimates of trade in services are not comparable on any basis to the estimates of trade in goods. See data sources section for further information.
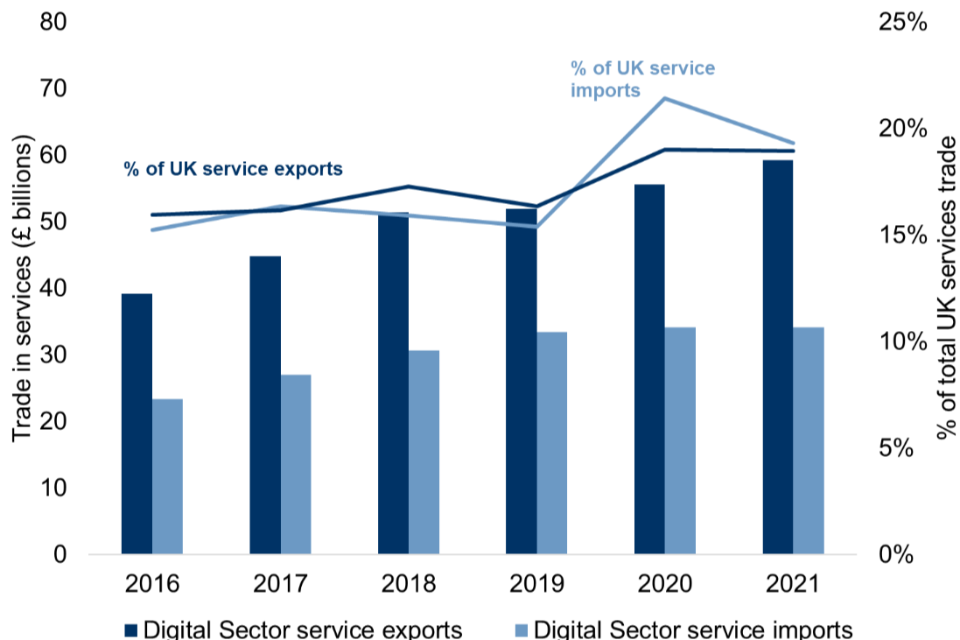
Exports of services by businesses in digital sectors have consistently been higher than imports of services between 2016 and 2021 (Figure 4). This is consistent with the UK economy as a whole (the UK is a net exporter of services.[footnote 1]
The proportion of total UK trade in services accounted for by services in the digital sector has increased between 2019 (pre-pandemic) and 2021 for both imports (15.4% to 19.3%) and exports (16.3% to 18.9%). Compared to 2020, services exports decreased slightly from 19.0% whereas service imports decreased from 21.4%.
Figure 4: Trade in digital sector services, as a percentage of the UK total: 2016 to 2021
4.1 Trade in the digital sector
This section summarises the trade in services by businesses in the digital sectors in 2021 by individual sector.
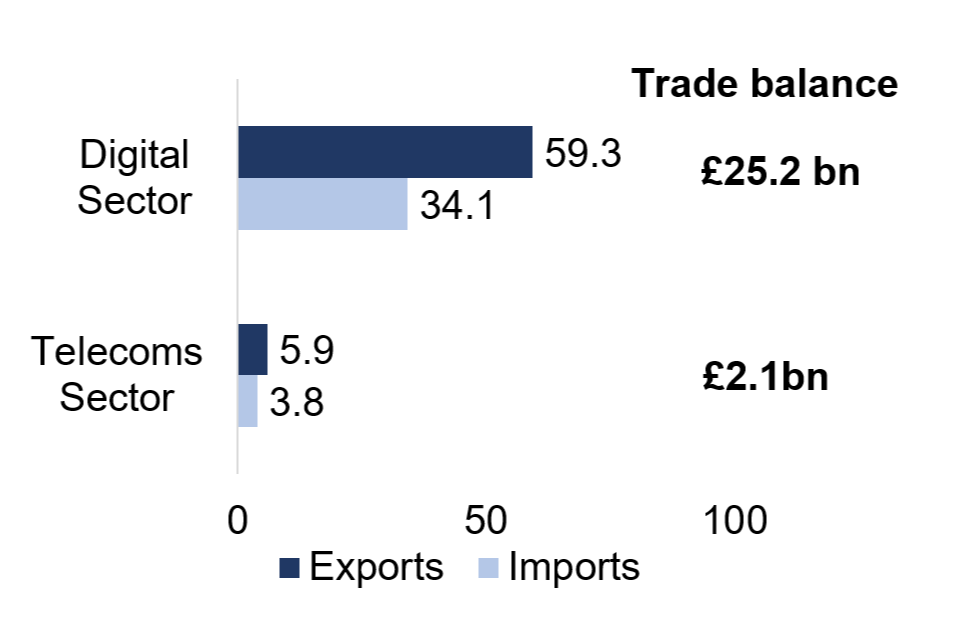
In 2021, the value of services exported by businesses in the digital sector exceeded the value of services imported by £25.2 billion (the net balance of trade). Exports of digital sector services are mainly driven by businesses in the ‘Computer programming, consultancy and related activities’ sub-sector. The telecoms sector is wholly within the digital sector. See digital sector overlaps in Annex B.
Figure 5: The net balance of trade in services in the digital sectors current prices, 2021, UK (£ billions)
| Sector | Net balance of trade in services (£ billions) |
|---|---|
| Digital sector | 25.2 |
| Telecoms | 2.1 |
*A positive net trade balance indicates that the value of services exported is higher than the value of services imported.
The value of services traded by businesses in each digital sector is presented below in current prices.
Figure 6: The value of services traded by businesses in each digital sector, 2021
Digital sector
In 2021, trade in services by businesses in the digital sector was estimated as:
- £34.1 billion service imports, 19.3% of UK service imports (down from 21.4% in 2020 and up from 15.4% in 2019)
- £59.3 billion service exports, 18.9% of UK service exports (similar to 19.0% in 2020 and up from 16.3% in 2019)
Of which: telecoms sector
In 2021, trade in services by businesses in the telecoms sector (which is wholly within the digital sector) was estimated as:
- £3.8 billion service imports, 2.2% of UK service imports (down from 2.9% in 2020 and up from 2.0% in 2019)
- £5.9 billion service exports, 1.9% of UK service exports (down from 2.1% in 2020 and up from 1.7% in 2019)
4.2 Trade with other countries
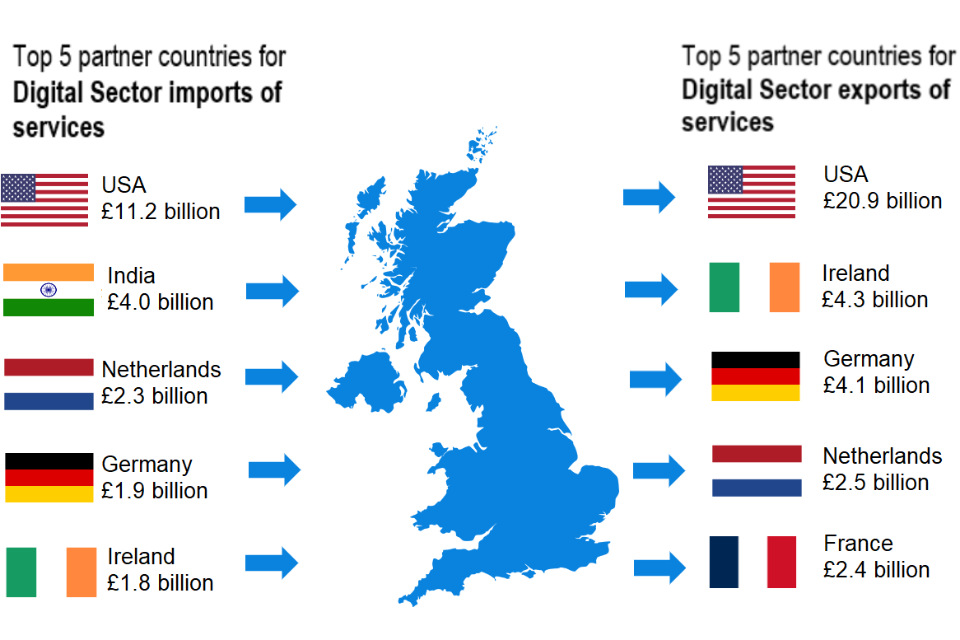
This section summarises trade in services by businesses in the digital sector by partner country in 2021 (Figure 7).
Imports of services
The USA (£11.2 billion) was the largest market for services imported by businesses in the digital sector in 2021, followed by India (£4.0 billion). China (£63.7 billion) was the largest source of services imported by businesses in the UK economy as a whole, followed by Germany (£53.8 billion).
Exports of services
The USA (£20.9 billion) was the largest market for services exported by businesses in the digital sector in 2021, followed by Ireland (£4.3 billion). Similarly, the USA (£48.0 billion) was the largest market for services exported by businesses in the UK economy as a whole, followed by Germany (£29.6 billion).
Figure 7: The top 5 countries that businesses in the digital sector imported the most goods from and exported the most services to in 2021
5. Data sources
5.1 Trade in goods
Data on trade in goods are collected from HMRC’s Intrastat survey (for EU trade) and customs import and export entries (for non-EU trade), which record the movement (for trade purposes) of goods across international borders. As such, the data are gathered under the cross-border principle of trade.
Up to 31 December 2020, UK to EU export statistics were collected via the Intrastat statistical survey. For goods moving from 1 January 2021, GB to EU export statistics are compiled directly from customs export declarations made according to the requirements of the Taxation (Cross Border Trade) Act [footnote 2]. As a result of the changes, there is a break in the time series for published UK to EU export statistics from January 2021. These will not be directly comparable to UK to EU export statistics published for previous months and years. UK imports from EU statistics are not impacted by this change as the Intrastat survey continues to operate for all UK (GB and NI) imports (arrivals) from the EU.
5.2 Trade in services
The estimates of trade in services are based on data from the ONS International Trade in Services (ITIS) dataset. These data are collected via survey and are gathered under the change of ownership principle of trade. The dataset does not provide full coverage of the economy and excluded sectors include: travel and transport; banking and other financial institutions; higher education; and most activities in the legal professions.
6. Further information
- The next update to these statistics will be published in Spring/Summer 2024.
- The responsible analysts for this release are Eri Hutchinson and Zoe Kimber. For enquiries on this release, please contact evidence@dcms.gov.uk.
- For general enquiries contact: Department for Culture, Media and Sport, 100 Parliament Street, London, SW1A 2BQ.
- Telephone: 020 7211 6000
- DCMS statisticians can be followed on Twitter via @DCMSInsight.
- The ‘Digital sector economic estimates: Trade’ release is an official statistics publication and has been produced to the standards set out in the Code of Practice for Statistics.
- Details of the pre-release access arrangements for this dataset have been published alongside this release.
7. Annex A: Timeline of trade-related events
A timeline of events and pieces of legislation that occurred between 2016 and 2021 and relevant to the movements of goods and people is shown in Table 1 below. We have included events that have been reported as notable by the House of Commons[footnote 4] library and the Office for National Statistics.[footnote 5]
Table 3: A timeline of trade related events that occurred between 2016 and 2021 and affected the movement of goods and people.
| Date | Event |
|---|---|
| 23 June 2016 | In a UK referendum held on 23 June 2016, a majority of those who voted chose to leave the European Union[footnote 4] |
| 29 March 2017 | Article 50 is triggered to commence the two-year countdown to the UK formally leaving the European Union (Brexit)[footnote 4] |
| March and October 2019 | UK firms stockpile goods ahead of Brexit deadlines in 2019 causing a spike in UK goods imports [footnote 5] |
| 31 January 2020 | The UK officially left the European Union and entered a transition period[footnote 4] |
| 31 December 2020 | The transition period ended and the United Kingdom left the European Union single market and customs union[footnote 4] |
| 1 January 2021 | GB goods exports to the EU are collected from customs export declarations. |
| 24 May 2021 | European Council welcomes entry into force of the EU-UK Trade and Cooperation Agreement |
-
(ONS): Impact of the coronavirus and EU exit on the collection and compilation of UK trade statistics ↩ ↩2
-
Up to 31 December 2020, UK to EU export statistics were collected via the Intrastat statistical survey. For goods moving from 1 January 2021, GB to EU export statistics are compiled directly from customs export declarations made according to the requirements of the Taxation (Cross Border Trade) Act. As a result of the changes, there is a break in the time series for published UK to EU export statistics from January 2021. These will not be directly comparable to UK to EU export statistics published for previous months and years. UK imports from EU statistics are not impacted by this change as the Intrastat survey continues to operate for all UK (GB and NI) imports (arrivals) from the EU. ↩ ↩2
-
HMRC (2022): UK overseas trade in goods statistics: summary of 2021 trade in goods ↩ ↩2 ↩3
-
(House of Commons library): Brexit timeline: events leading to the UK’s exit from the European Union ↩ ↩2 ↩3 ↩4 ↩5
-
(ONS): Did UK firms stockpile items ahead of the Brexit deadline? ↩ ↩2