DCMS sectors economic estimates: Trade, 2021 - main report
Updated 9 April 2025

© Crown copyright 2025
This publication is licensed under the terms of the Open Government Licence v3.0 except where otherwise stated. To view this licence, visit nationalarchives.gov.uk/doc/open-government-licence/version/3 or write to the Information Policy Team, The National Archives, Kew, London TW9 4DU, or email: psi@nationalarchives.gov.uk.
Where we have identified any third party copyright information you will need to obtain permission from the copyright holders concerned.
This publication is available at https://www.gov.uk/government/statistics/dcms-and-digital-sector-economic-estimates-trade-2021/dcms-sectors-economic-estimates-trade-2021-main-report
1 Background
- Release date: 3 August 2023
- Revised: 27 June 2024
- Revised: 9 April 2025
- Next release: spring/summer 2024
- Geographic coverage: United Kingdom
- Time coverage: 2016 to 2021
- Responsible analysts: Eri Hutchinson and Zoe Kimber
This release provides estimates for the following measures for 2021:
- estimates of exports and imports of goods in DCMS sectors
- estimates of exports and imports of services by businesses in DCMS sectors
- exports and imports of tourism where exports are defined as spending on goods and services by overseas visitors to the UK and imports are defined as spending by UK visitors overseas.
The DCMS sectors covered in this release are:
- creative industries
- cultural sector
- gambling (services only)
- sport
- tourism (covered on a separate basis to the other sectors)
Estimates are not available for the civil society sector as there are no formally recognised imports or exports of goods or services for civil society from the data sources available. Figures for gambling sector goods imports and exports are also not included in this release as there are no goods associated with this sector in the data sources available.
Estimates of trade in services and trade in goods are not comparable on any basis as they use different data sources and different definitions as to what constitutes an import or an export. See the accompanying technical report for further information.
Figures for the digital sector and telecoms are presented separately as responsibility for these policy areas now sits with the Department for Science, Innovation and Technology (DSIT).
This release includes figures up to 2021 (i.e. these estimates are affected by EU-Exit and the COVID-19 pandemic). Caution is advised when making year on year comparisons of trade in goods or services due to the combined effects of the national and international implications of pandemic, EU-Exit uncertainty and border disruptions which contributed to the volatility in UK goods and services trade.[footnote 1] See Annex A for a timeline of events and pieces of legislation that occurred between 2016 and 2021 relevant to the movements of goods and people.
This publication, including the accompanying data tables, includes data for the period 2016 to 2021. This is the earliest year for which data is available for trade in goods and services in the DCMS sectors, following the creation of DSIT and the change to the DCMS remit..
Estimates are given in current prices and have not been adjusted for inflation. Year on year increases are therefore likely to be higher than the ‘real’ (inflation-adjusted) value. Changes over time are therefore reported here as changes in the proportion of total UK imports and exports.
2. Headline findings
2.1 Trade in goods
Trade in included DCMS sector goods in 2021 is estimated as:
- £9.8 billion of goods imports, 1.9% of total UK goods imports (similar to 2020 and down from 2.4% in 2019).
- £10.4 billion of goods exports, 3.0% of total UK goods exports (down from 3.3% in 2020 and down from 4.4% in 2019).
2.2 Trade in services
Trade in services by businesses in included DCMS sectors in 2021 is estimated as:
- £28.1 billion of service imports, 15.9% of total UK service imports (similar to 16.0% in 2020 and up from 10.8% in 2019).
- £50.8 billion of service exports, 16.2% of total UK service exports (up from 15.8% in 2020 and 13.5% in 2019).
2.3 Trade in tourism
Trade in tourism in 2021 is estimated as:
- £15.5 billion in tourism imports (spend on goods and services by UK visitors overseas)
- £5.6 billion in tourism exports (spend on goods and services by overseas visitors to the UK)
3. Trade in goods
Estimates of trade in goods are calculated on a “cross-border” measure of trade; a good is recorded as an export or import when it physically leaves or enters the economic territory of a country. Due to the different definitions and calculations, estimates of trade in goods are not comparable on any basis to the estimates of trade in services. From 1 January 2021, Great Britain to EU goods export statistics are compiled directly from customs export declarations. As a result, there is a break in the time series for UK to EU export estimates in January 2021. [footnote 2] This means UK to EU export statistics will not be directly comparable to those published for previous or future months and years. See the Data Sources section and methodology note for further information.
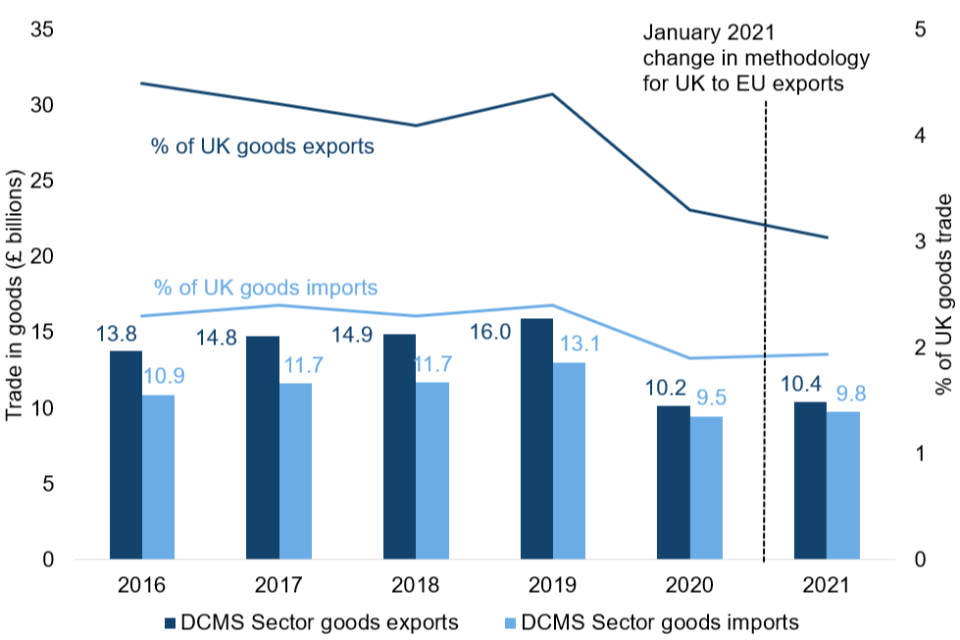
Exports of DCMS sector goods have been consistently higher than imports between 2016 and 2021 (the years of which data are available), as shown in Figure 1 below. This is in contrast to the UK economy as a whole, as the UK is a net importer of goods. [footnote 3]
The proportion of total UK trade in goods accounted for by goods in included DCMS Sectors decreased between 2019 (pre-pandemic) and 2021 for both imports (2.4% to 1.9%) and exports (4.4% to 3.0%) as shown in Figure 1. Most of the decrease occurred between 2019 and 2020 for both imports (1.9% in 2020) and exports (3.3% in 2020).
Figure 1: Trade in included DCMS sectors (excl. tourism, gambling and civil society) goods, including as a percentage of the UK total: 2016 to 2021
3.1 Trade in DCMS sectors
In 2021, the value of goods exported by included DCMS sectors exceeded the value of goods imported by £0.6 billion (a trade surplus). The largest contributor to this surplus was the volume of exports in creative industries goods (Figure 3), particularly exports of goods in the ‘Music, performing and visual arts’ sub-sector. DCMS sectors are not mutually exclusive; industries may contribute to and be classified as more than one sector. For more information, see the DCMS sector overlaps in Annex B.
Figure 2: The net balance of trade in goods by DCMS sectors, current prices, 2021, UK
| Sector | Net balance of trade in goods (£ billions) |
|---|---|
| DCMS Sectors | 0.6 |
| Creative Industries | 1.4 |
| Cultural Sector | 0.5 |
| Sport Sector | -0.6 |
A negative net trade balance indicates that there is a trade deficit and the value of goods imported is higher than the value of goods exported.
Figure 3: The value of goods traded by each DCMS sector, 2021

The value of goods traded by each DCMS sector is presented below, in current prices. Please note industries may contribute to and be classified as more than one sector. For example, the majority of cultural sector goods are also classified as creative industries goods. For more information see Annex B.
Creative industries
In 2021, trade in creative industries goods was estimated as:
- £7.8 billion goods imports, 1.5% of UK goods imports (down from 1.6% in 2020 and 2.1% in 2019).
- £9.2 billion goods exports, 2.7% of UK goods exports (down from 2.9% in 2020 and 3.8% in 2019).
Cultural sector
In 2021, trade in cultural sector goods was estimated as:
- £6.7 billion goods imports, 1.3% of UK goods imports (similar to 2020 and down from 1.8% in 2019).
- £7.2 billion goods exports, 2.1% of UK goods exports (similar to 2020 and down from 3.1% in 2019).
Sport sector
In 2021, trade in sport goods was estimated as:
- £1.7 billion goods imports, 0.3% of UK goods imports (similar to 2020 and up from 0.2% in 2019).
- £1.1 billion goods exports, 0.3% of UK goods exports (down from 0.4% in 2020 and 0.6% in 2019).
3.2 Trade with individual countries
This section summarises trade in DCMS sector goods by partner country in 2021 (Figure 4).
Imports of goods
The USA (£1.7 billion) was the largest source for DCMS sector goods imports to the UK in 2021, followed by China (£1.5 billion). In contrast, China (£63.3 billion) was the largest source for goods imports across the wider UK economy, followed by Germany (£53.8 billion) [footnote 3].
For all of the top five partner countries by value of imports, the creative industries was the largest category of DCMS sector goods imports except for China, for which it was the sport sector.
The top five partner countries by value of imports for included DCMS sectors (shown in Figure 4 below) are mostly the same across the individual DCMS sectors. Please refer to the data tables included in this release for further breakdowns by sector and subsector.
Exports of goods
The USA (£2.5 billion) was the largest destination for DCMS sector goods exports in 2021, followed by Switzerland (£1 billion). The USA (£43.5 billion) was also the largest export partner country for goods across the wider UK economy, followed by Germany (£29.8 billion).[footnote 3]
For all of the top five partner countries the creative industries was the largest category of DCMS Sector goods exports.
The top five partner countries for included DCMS sectors (shown in Figure 4 below) were mostly the same for goods exports in each DCMS sector, with some exceptions. Please refer to the data tables included in this release for further breakdowns by sector and subsector.
Figure 4: The top five countries that businesses in the included DCMS sectors imported the most goods from and exported the most goods to in 2021

4. Trade in services
Estimates of trade in services are classified by the business involved in the trade and not the service provided. They are calculated on a change of ownership (balance of payments) measure of trade - if trade moves across land borders but remains under the same ownership this is not counted as trade. Estimates of trade in services are not comparable on any basis to the estimates of trade in goods. See data sources section for further information.
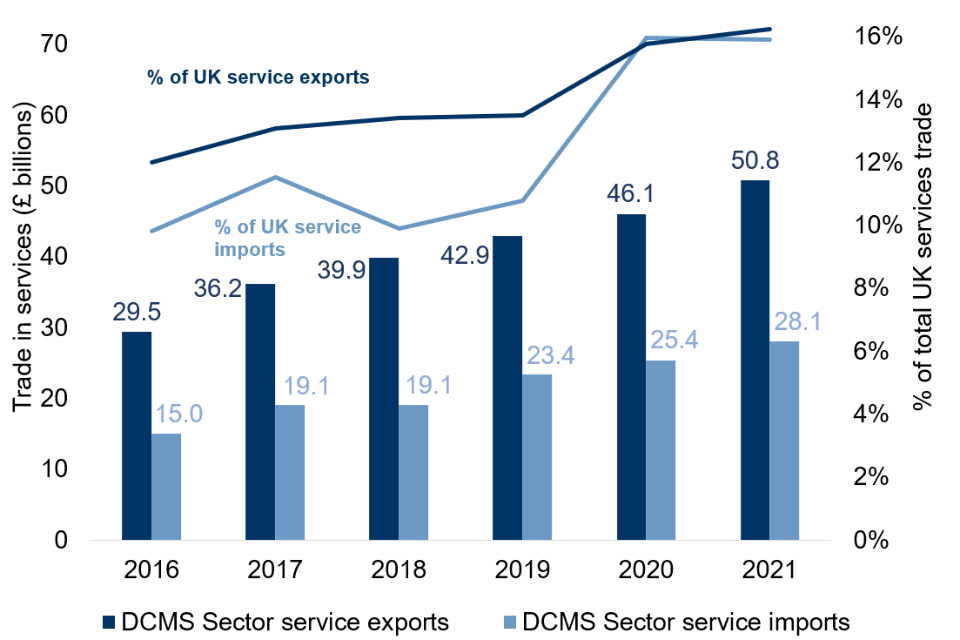
Exports of services by businesses in included DCMS sectors have consistently been higher than imports of services between 2016 and 2021 (Figure 5). This is consistent with the wider UK economy (the UK is a net exporter of services.[footnote 3]
The proportion of total UK trade in services accounted for by services in included DCMS Sectors has increased between 2019 (pre-pandemic) and 2021 for both imports (10.8% to 15.9%) and exports (13.5% to 16.2%), as shown in Figure 5. Most of the increase occurred between 2019 and 2020 for both imports (16.0% in 2020) and exports (15.8% in 2020).
Figure 5: Trade in included DCMS sectors (excl. tourism and civil society) services, as a percentage of the UK total: 2016 to 2021
4.1 Trade in DCMS sectors
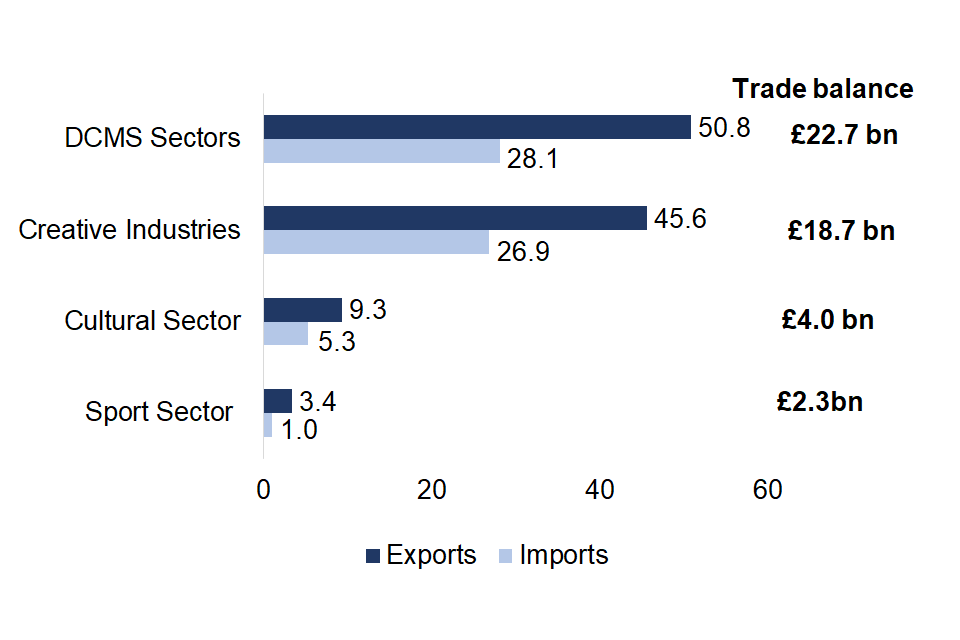
In 2021, the value of services exported by businesses in included DCMS sectors exceeded the value of services imported by £22.7 billion (a trade surplus), predominantly due to businesses in the creative industries (Figure 6). Exports of services in the creative industries are driven by businesses in the IT, software and computer services subsector.
DCMS sectors are not mutually exclusive; industries may contribute to and be classified as more than one sector. See DCMS sector overlaps in Annex B.
Figure 6: The net balance of trade in services by DCMS sectors, current prices, 2021, UK (£ billions)
| Sector | Net balance of trade in services (£ billions) |
|---|---|
| DCMS Sectors | 22.7 |
| Creative Industries | 18.7 |
| Cultural Sector | 4.0 |
| Sport Sector | 2.3 |
*A positive net trade balance indicates a trade surplus and that the value of services exported is higher than the value of services imported.
The value of services traded by businesses in each DCMS sector is presented below in current prices.
Although the gambling sector is included in the DCMS sector exports of services total, we have not reported the value of services exported by the gambling sector separately. This is because the aggregated exports of services data for gambling failed disclosure checks. These are tests that we apply to the data to make sure that respondents to the survey cannot be identified from the results. For this reason we are unable to report the net balance of trade in services for the gambling sector.
Figure 7: The value of services traded by businesses in each DCMS sector, 2021
Creative industries
In 2021, trade in services by businesses in the creative industries was estimated as:
- £26.9 billion service imports, 15.2% of UK service imports (up from 14.8% in 2020 and up from 10.1% in 2019).
- £45.6 billion service exports, 14.6% of UK service exports (up from 14.2% in 2020 and up from 11.9% in 2019).
Cultural sector
In 2021, trade in services by businesses in the cultural sector was estimated as:
- £5.3 billion service imports, 3.0% of UK service imports (up from 2.8% in 2020 and up from 2.5% in 2019).
- £9.3 billion service exports, 3.0% of UK service exports (similar to 2020 and down from 3.3% in 2019).
Gambling sector
In 2021, trade in services by businesses in the gambling sector was estimated as:
- £0.2 billion service imports, 0.1% of UK service imports (unchanged from 2020 or 2019).
Although the gambling sector is included in the DCMS sector exports of services total, we have not reported the value of services exported by the gambling sector separately. This is because the aggregated exports of services data for gambling failed disclosure checks. These are tests that we apply to the data to make sure that respondents to the survey cannot be identified from the results.
Sport sector
In 2021, trade in services by businesses in the sport sector was estimated as:
- £1.0 billion service imports, 0.6% of UK service imports (down from 1.1% in 2020 but up from 0.5% in 2019).
- £3.4 billion service exports, 1.1% of UK service exports (down from 1.4% in 2020 and 1.2% in 2019).
4.2 Trade with other countries
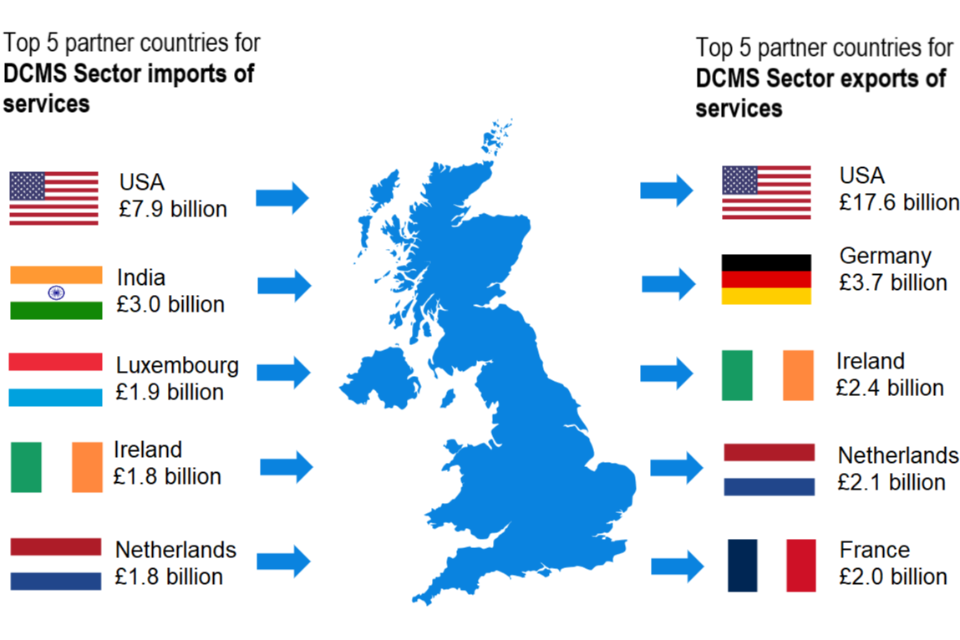
This section summarises trade in services by businesses in included DCMS sectors by partner country in 2021 (Figure 8).
Imports of services
The USA (£7.9 billion) was the largest source of services imported by businesses in included DCMS sectors in 2021, followed by India (£3.0 billion). China (£63.7 billion) was the largest source of services imported by businesses in the UK economy as a whole, followed by Germany (£53.8 billion).
For all the top five countries, businesses in the creative industries were the largest source for services imported by businesses in DCMS sectors.
The top five partner countries by value of imports for included DCMS sectors (shown in Figure 8 below) are mostly the same across the individual DCMS sectors with some exceptions. Please refer to the data tables included in this release for further breakdowns by sector and subsector.
Exports of services
The USA (£17.6 billion) was the largest recipient country of services exported by businesses in DCMS sectors in 2021, followed by Germany (£3.7 billion). Similarly, the USA (£48.0 billion) was the largest recipient country for services exported by businesses in the UK economy as a whole, followed by Germany (£29.6 billion).
To all the top five countries, businesses in the creative industries were the largest exporters of services in DCMS sectors.
The top five partner countries by value of exports for included DCMS sectors (shown in Figure 8 below) are mostly the same across the individual DCMS sectors with some exceptions. Please refer to the data tables included in this release for further breakdowns by sector and subsector.
Figure 8: the top five countries that businesses in the included DCMS Sectors imported services from and exported services to in 2021
5. Trade in tourism
This chapter details estimates of the value of trade in goods and services combined for tourism, as well as the proportion of total UK trade in goods and services that is accounted for by tourism. Estimates are given in current prices (i.e. not adjusted for inflation) and are based on the International Passenger Survey.
The International Passenger Survey (IPS) was suspended from 16 March 2020 to 18 January 2021 because of the coronavirus (COVID-19) pandemic. No IPS data were collected for the period when the survey was not operational; as a result the estimates in this release for 2020 are based on administrative sources and modelling and should be treated with caution. [footnote 4]
Expenditure by overseas tourist visitors to the UK is used as a proxy for exports of goods and services for tourism. Expenditure by UK residents on their visits abroad is used as a proxy for imports of goods and services for tourism. We expect the results for 2021 have been impacted by the coronavirus (COVID-19) and resulting global travel restrictions.
Further breakdowns by country are available from ONS.
5.1 Tourism exports
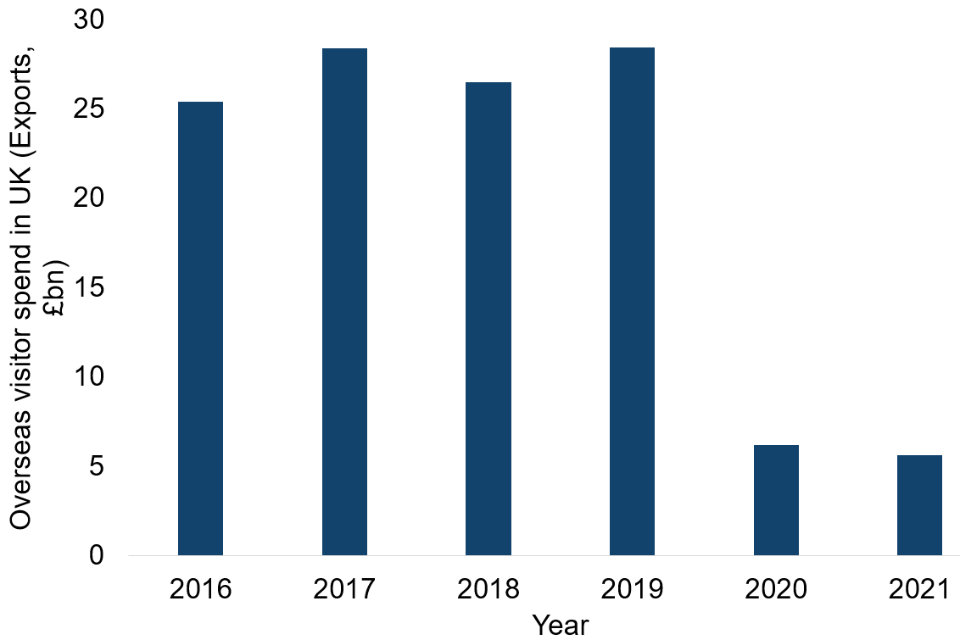
In 2021, the value of exports in the tourism sector – the spending on both goods and services by overseas visitors to the UK – was £5.6bn.
Measured in current prices, this is a lower amount of spending by overseas visitors to the UK than in 2020 (£6.2bn) and 2019 (£28.4bn). Note that these estimates are not directly comparable as they are not adjusted for inflation, and figures for 2020 and 2021 are influenced by the COVID-19 pandemic. The overall pattern since 2016 can be seen in Figure 9 below.
Figure 9: Spending by overseas visitors to the UK (exports of tourism), £bn (current prices): 2016 to 2021
Breakdowns by individual countries
Table 1 below shows the top five partner countries for exports of tourism (overseas visitor spend in the UK) in 2021. It presents estimates of the five countries whose tourists spent the most on goods and services when visiting the UK.
Table 1: Spending by overseas visitors in the UK from top five partner countries, unadjusted for inflation, 2019 to 2021
| Home country | Overseas visitor spend in UK (£ billions, 2019) | Overseas visitor spend in UK (£ billions, 2021) | % of total overseas visitor spend in UK (2021) |
|---|---|---|---|
| USA | 4.2 | 0.8 | 13.9 |
| France | 1.4 | 0.4 | 7.4 |
| Spain | 1.0 | 0.3 | 5.3 |
| Republic of Ireland | 1.0 | 0.3 | 5.2 |
| Germany | 1.6 | 0.2 | 4.2 |
The UK has seen a large decrease in tourism exports (overseas visitor spend in the UK) to almost every country analysed in 2021 when compared to both 2016 and 2019. We expect this is due to the effects of the COVID-19 pandemic and related travel restrictions.
5.2 Tourism imports
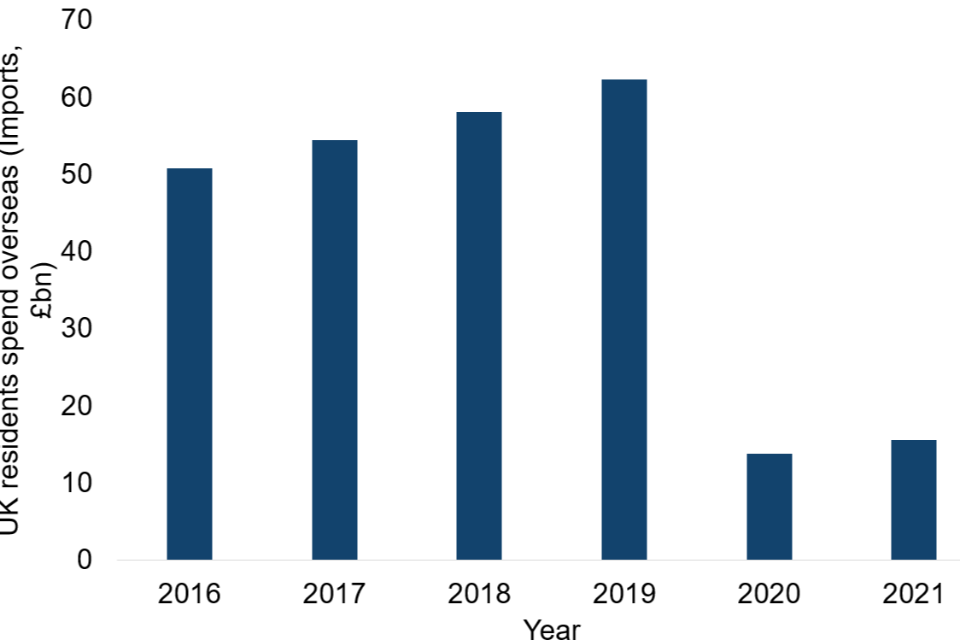
In 2021 the value of imports in the tourism sector (spending by UK residents visiting overseas) was £15.5bn. Measured in current prices, this is a higher amount of spending by UK residents overseas than in 2020 (£13.8bn) but lower than in 2019 (£62.3bn). Note that these estimates are not directly comparable as they are not adjusted for inflation, and figures for 2020 and 2021 are influenced by the COVID-19 pandemic. The overall trend since 2016 is shown in Figure 10 below.
Figure 10: Spending by UK residents visiting overseas (Imports of tourism), £bn: 2016 to 2021
Breakdowns by individual countries
Table 2 shows the top five partner countries for imports of tourism (UK visitor spend overseas). It presents estimates of the five countries where UK visitors spent the most on goods and services during their visits in 2021.
Table 2: Spending by UK visitors in the top five partner countries, unadjusted for inflation, 2019 to 2021
| Home country | UK visitor spend overseas (£ billions, 2019) | UK visitor spend overseas (£ billions, 2021) | % of total UK visitor spend overseas (2021) |
|---|---|---|---|
| Spain | 10.9 | 3.2 | 20.6 |
| Greece | 2.3 | 1.1 | 7.2 |
| France | 5.2 | 1.0 | 6.5 |
| Portugal | 2.0 | 0.8 | 5.4 |
| Romania | 0.8 | 0.6 | 4.2 |
The UK has seen a large decrease in tourism imports (UK visitor spend overseas) to most countries analysed in 2021 when compared to both 2016 and 2019. We expect this is mainly due to the effects of the COVID-19 pandemic and travel restrictions.
Only five of the countries analysed have seen an increase in spending by UK visitors in 2021 when compared to 2016 (unadjusted for inflation): Bahrain, Iraq, Romania, Kuwait and Estonia.
Only two have seen an increase in 2021 when compared to 2019 (unadjusted for inflation), the latest year in this series unaffected by COVID-19 travel restrictions: Bahrain and Iraq.
6. Data sources
6.1 Trade in goods
Data on trade in goods are collected from HMRC’s Intrastat survey (for EU imports and EU exports up to 31 December 2020) and customs import and export entries (for non-EU trade and EU exports from 1 January 2021), which record the movement (for trade purposes) of goods across international borders. As such, the data are gathered under the cross-border principle of trade.
Up to 31 December 2020, UK to EU export statistics were collected via the Intrastat statistical survey. For goods moving from 1 January 2021, GB to EU export statistics are compiled directly from customs export declarations made according to the requirements of the Taxation (Cross Border Trade) Act.[footnote 2] As a result of the changes, there is a break in the time series for published UK to EU export statistics from January 2021. These will not be directly comparable to UK to EU export statistics published for previous months and years. UK imports from EU statistics are not impacted by this change as the Intrastat survey continues to operate for all UK (GB and NI) imports (arrivals) from the EU.
6.2 Trade in services
The estimates of trade in services are based on data from the ONS International Trade in Services (ITIS) dataset. These data are collected via survey and measures the value of transactions of UK businesses by industry. The data are calculated on the change of ownership principle of trade. The dataset does not provide full coverage of the economy and excluded sectors include: travel and transport; banking and other financial institutions; higher education; and most activities in the legal professions.
6.3 Trade in tourism
The estimates of trade in tourism are based on data from the ONS International Passenger Survey (IPS). The survey collects information about passengers entering and leaving the UK and are based on the following definitions;
- imports of tourism – spending by UK residents on trips abroad
- exports of tourism – spending by overseas residents during visits to the UK
These figures represent trade in goods and services combined and therefore are not directly comparable with the trade in services or trade in goods estimates presented for all other sectors. Therefore, estimates of imports and exports of tourism are not presented in the DCMS sector totals.
Due to the COVID-19 pandemic the IPS was suspended on 16 March 2020 and resumed in January 2021.[footnote 5] No IPS data were collected for the period when the survey was not operational. The travel and tourism statistics for April to December 2020 published by ONS are based on administrative sources and modelling. There are therefore no breakdowns available by world regions or individual countries. The only figures available are the headline figures presented in Chapter 1 and the Overseas travel and tourism: 2020 ONS publication page. Further information on the methodology used to produce the estimates can be found on the ONS Data sources and quality page.
7. Further information
- The next update to these statistics will be published in Spring/Summer 2024.
- The responsible analysts for this release are Eri Hutchinson and Zoe Kimber. For enquiries on this release, please contact evidence@dcms.gov.uk.
- For general enquiries contact: Department for Culture, Media and Sport, 100 Parliament Street, London, SW1A 2BQ.
- Telephone: 020 7211 6000
- DCMS statisticians can be followed on Twitter via @DCMSInsight.
- The DCMS Sectors Economic Estimates: Trade release is an official statistics publication and has been produced to the standards set out in the Code of Practice for Statistics.
- Details of the pre-release access arrangements for this dataset have been published alongside this release.
8. Annex A: Timeline of trade-related events
A timeline of events and pieces of legislation that occurred between 2016 and 2021 and relevant to the movements of goods and people is shown in Table 1 below. We have included events that have been reported as notable by the House of Commons[footnote 6] library and the Office for National Statistics.[footnote 7]
TABLE 3: A timeline of trade related events that occurred between 2016 and 2021 and affected the movement of goods and people.
| Date | Event |
|---|---|
| 23 June 2016 | In a UK referendum held on 23 June 2016, a majority of those who voted chose to leave the European Union[footnote 6] |
| 29 March 2017 | Article 50 is triggered to commence the two-year countdown to the UK formally leaving the European Union (Brexit)[footnote 6] |
| March and October 2019 | UK firms stockpile goods ahead of Brexit deadlines in 2019 causing a spike in UK goods imports [footnote 7] |
| 31 January 2020 | The UK officially left the European Union and entered a transition period[footnote 6] |
| 16 March 2020 | The International Passenger Survey is suspended from operation due to travel restrictions caused by the coronavirus pandemic[footnote 4] |
| 31 December 2020 | The transition period ended and the United Kingdom left the European Union single market and customs union[footnote 6] |
| 1 January 2021 | GB goods exports to the EU are collected from customs export declarations. |
| 18 January 2021 | The International Passenger survey (IPS) was resumed after being suspended since March 2020 because of the coronavirus (COVID-19) pandemic. |
| 24 May 2021 | European Council welcomes entry into force of the EU-UK Trade and Cooperation Agreement |
9. Annex B: DCMS Sector overlaps
The DCMS sectors are not mutually exclusive; industries may contribute to and be classified as more than one sector. Due to these overlaps, summing of the value of goods or services traded by individual sectors would give a total greater than the actual value.
9.1 Sector overlaps for exports of goods in DCMS Sectors
Figure 11 below shows that the total value of DCMS Sector goods exports (£10.4bn) is not the sum of exports for the individual sectors. The amount of one bar that is vertically above another bar indicates the size of the overlap, for example, the fact that nearly all of the Cultural Sector bar is vertically above part of the Creative Industries bar indicates that the majority of the Cultural Sector is also within the Creative Industries.
Figure 11: Exports of goods of DCMS sectors as a percentage of total UK goods exports (%), 2021

9.2 Sector overlaps for imports of services in DCMS sectors
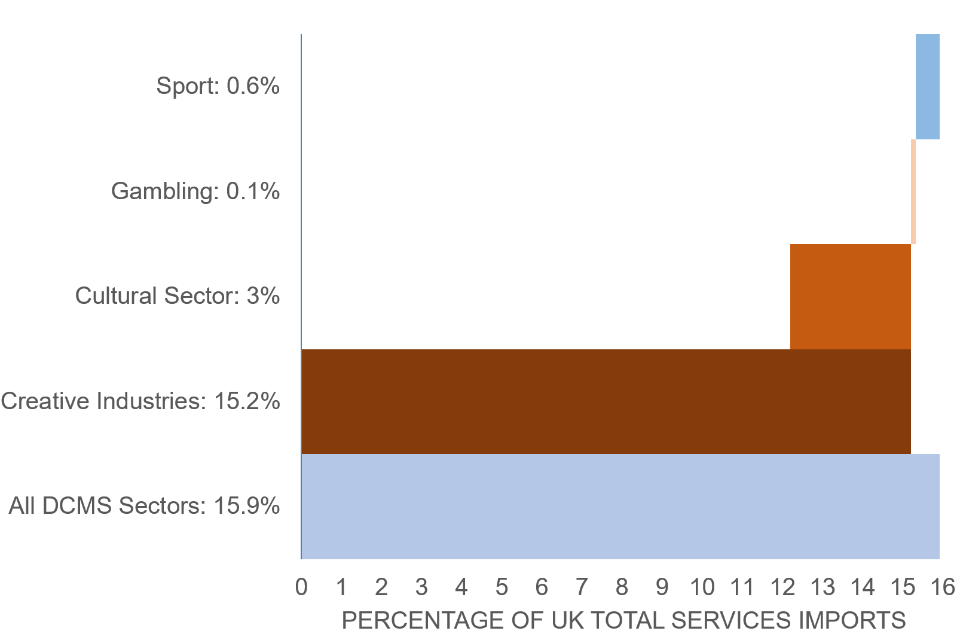
Figure 12 below shows that the total value of services imported by businesses in DCMS sectors (£28.1 billion) is not the sum of imports by businesses in the individual sectors. The amount of one bar that is vertically above another bar indicates the size of the overlap, for example, the cultural sectors is almost fully contained within the creative industries (but not vice versa).
Figure 12: Imports of services of DCMS sectors as a percentage of total UK service imports (%), 2021
-
(ONS): Impact of the coronavirus and EU exit on the collection and compilation of UK trade statistics ↩
-
Up to 31 December 2020, UK to EU export statistics were collected via the Intrastat statistical survey. For goods moving from 1 January 2021, GB to EU export statistics are compiled directly from customs export declarations made according to the requirements of the Taxation (Cross Border Trade) Act [footnote1]. As a result of the changes, there is a break in the time series for published UK to EU export statistics from January 2021. These will not be directly comparable to UK to EU export statistics published for previous months and years. UK imports from EU statistics are not impacted by this change as the Intrastat survey continues to operate for all UK (GB and NI) imports (arrivals) from the EU. ↩ ↩2
-
HMRC (2022): UK overseas trade in goods statistics: summary of 2021 trade in goods ↩ ↩2 ↩3 ↩4
-
(ONS): Overseas travel and tourism, 2020 ↩ ↩2
-
(House of Commons library): Brexit timeline: events leading to the UK’s exit from the European Union ↩ ↩2 ↩3 ↩4 ↩5
-
(ONS): Did UK firms stockpile items ahead of the Brexit deadline? ↩ ↩2