Cyber Security Breaches Survey 2021
Published 24 March 2021

© Crown copyright 2021
This publication is licensed under the terms of the Open Government Licence v3.0 except where otherwise stated. To view this licence, visit nationalarchives.gov.uk/doc/open-government-licence/version/3 or write to the Information Policy Team, The National Archives, Kew, London TW9 4DU, or email: psi@nationalarchives.gov.uk.
Where we have identified any third party copyright information you will need to obtain permission from the copyright holders concerned.
This publication is available at https://www.gov.uk/government/statistics/cyber-security-breaches-survey-2021/cyber-security-breaches-survey-2021
Summary
This sixth survey in the annual series continues to show that cyber security breaches are a serious threat to all types of businesses and charities. Among those identifying breaches or attacks, their frequency is undiminished, and phishing remains the most common threat vector.
Four in ten businesses (39%) and a quarter of charities (26%) report having cyber security breaches or attacks in the last 12 months. Like previous years, this is higher among medium businesses (65%), large businesses (64%) and high-income charities (51%)[footnote 1].
This year, fewer businesses are identifying breaches or attacks than in 2020 (when it was 46%), while the charity results are unchanged. This could be the result of a reduction in trading activity from businesses during the pandemic, which may have inadvertently made some businesses temporarily less detectable to attackers this year.
However, other quantitative and qualitative evidence from the study suggests that the risk level is potentially higher than ever under COVID-19, and that businesses are finding it harder to administer cyber security measures during the pandemic. For example, fewer businesses are now deploying security monitoring tools (35%, vs. 40% last year) or undertaking any form of user monitoring (32% vs. 38%). Therefore, this reduction among businesses possibly suggests that they are simply less aware than before of the breaches and attacks their staff are facing.
Among those that have identified breaches or attacks, around a quarter (27% of these businesses and 23% of these charities) experience them at least once a week. The most common by far are phishing attacks (for 83% and 79% respectively), followed by impersonation (for 27% and 23%). Broadly, these patterns around frequency and threat vectors are in line with the 2020 and 2019 results.
A sizeable number of organisations that identify breaches report a specific negative outcome or impact. On average, for those that do, the costs are substantial.
Among the 39 per cent of businesses and 26 per cent of charities that identify breaches or attacks, one in five (21% and 18% respectively) end up losing money, data or other assets. One-third of businesses (35%) and four in ten charities (40%) report being negatively impacted regardless, for example because they require new post-breach measures, have staff time diverted or suffer wider business disruption.
These figures have shifted gradually over time – the proportions experiencing negative outcomes or impacts in 2021 are significantly lower than in 2019 and preceding years. This is not due to breaches or attacks becoming less frequent, with no notable change in frequency this year. Instead, it may, in part, be due to more organisations implementing basic cyber security measures following the introduction of the General Data Protection Regulation (GDPR) in 2018. It could also reflect other trends such as the rising use of cloud storage and backups.
Nevertheless, where businesses have faced breaches with material outcomes, the average (mean) cost of all the cyber security breaches these businesses have experienced in the past 12 months is estimated to be £8,460. For medium and large firms combined, this average cost is higher, at £13,400. There are too few charities in the sample to report average costs in this way, but the overall costs recorded for businesses and charities follow a similar pattern.
Despite COVID-19 stretching many organisation’s cyber security teams to their limits, cyber security remains a priority for management boards. But it has not necessarily become a higher priority under the pandemic.
Three-quarters (77%) of businesses say cyber security is a high priority for their directors or senior managers, while seven in ten charities (68%) say this of their trustees. While there have been minor fluctuations in these findings over the past three years, cyber security remains a higher priority compared to when we first surveyed each group (i.e. 69% in 2016 for businesses and 53% in 2018 for charities).
Half of businesses (50%) and four in ten charities (40%) update their senior management teams about the actions taken on cyber security at least quarterly, in line with the 2020 results. However, the percentage of charities reporting that their senior managers are never updated on cyber security has increased since last year (to 23%, vs. 12% in 2020).
Overwhelmingly, businesses (84%) and charities (80%) say COVID-19 has made no change to the importance they place on cyber security. The qualitative research suggests that some organisations have increased their investment in IT and cyber security in response to the pandemic. Many organisations adopted new security solutions, including cloud security and multi-factor authentication, or new rules requiring VPN connections to access files.
These changes were often characterised as being about business and IT service continuity. However, in some cases, interviewees felt that management boards and end users did not fully appreciate the role of cyber security in facilitating long-term business continuity. In the immediacy of the pandemic, cyber security measures were sometimes viewed in the short term as being in conflict with business continuity, rather than complementing it.
The COVID-19 pandemic has led to significant changes in ways of working. This has made cyber security harder for many organisations.
In qualitative interviews, many organisations explained that COVID-19 and the ensuing move to home working initiated substantial changes in their digital infrastructure. Many issued laptops or tablets to staff, set up Virtual Private Networks (VPNs) or expanded existing VPN capacity, started using cloud servers and had to quickly approve new software. In a new question this year, the survey finds that a third of businesses (34%) and a fifth of charities (20%) have a VPN.
These changes have led to new challenges for organisations to contend with, as part of their cyber security management approaches:
-
Direct security and user monitoring have become harder in organisations where staff are working remotely. As previously noted, fewer businesses are deploying security monitoring tools than in 2020 (down from 40% to 35%). Fewer businesses (32%, vs. 38% in 2020) and charities (29% vs. 38%) are now undertaking any form of user monitoring.
-
Upgrading hardware, software and systems has also become more difficult. With staff working at home, there are more endpoints for organisations to keep track of. Fewer businesses (83%, vs. 88% in 2020) and charities (69% vs. 78%) report having up-to-date malware protection. Fewer businesses (78% vs. 83%) and charities (57% vs. 72%) have set up network firewalls. In large businesses in particular, having laptops with unsupported versions of Windows is a significant security risk (affecting 32% of large businesses).
-
More generally, the pandemic had stretched resources and led to competing priorities in IT and cyber security teams. In some cases, there was a perceived conflict between prioritising IT service continuity and maintenance work, and aspects of cyber security such as patching software.
COVID-19 has been an unexpected and unprecedented challenge for organisations. But in terms of cyber security, the findings highlight that there is more they can do to plan for, and ensure they are resilient to, future uncertainties.
The survey findings highlight that a minority of organisations overall have taken actions in the following areas – although they are far more common among medium and large businesses:
- taking out some form of cyber insurance (43% of businesses and 29% of charities) – this is up from 32 per cent for businesses in 2020
- undertaking cyber security risk assessments (34% and 32%)
- testing staff, such as through mock phishing exercises (20% and 14%)
- carrying out cyber security vulnerability audits (15% and 12%)
- reviewing cyber security risks posed by suppliers (12% and 8%).
As the UK emerges from the COVID-19 pandemic, organisations might also consider what more they can do to manage cyber security risks in a “blended” working environment (i.e. where staff are regularly working both in offices and at home):
- Three in ten businesses (31%) and slightly fewer charities (27%) have a business continuity plan that covers cyber security. This was a new question for 2021.
- A quarter of businesses and charities (23% of each) have cyber security policies that cover home working. A fifth of businesses (18%) and a quarter of charities (23%) have policies that cover the use of personal devices for work. The extent to which these areas feature in cyber security policies has not changed significantly since last year.
- Over four in ten businesses (46%) and three in ten charities (30%) are using smart (i.e. network-connected) devices in workplaces. This was also a new question for 2021, and highlights a potential new area of cyber risk for organisations to address.
The qualitative research also highlights organisations’ cyber security ambitions for the future and the broader challenges they expect to face. Many expect to make continuous improvements in their cyber security, which includes, for example, rolling out multi-factor authentication, or tweaking policies and processes to cover Software as a Service (SaaS). Some also expect to move further away from an approach of locking down user activity, towards one that prioritises functionality and flexibility. Cyber security teams may therefore need to realign themselves to wider strategic business needs in some cases, emphasising how staff can use new technologies, software and platforms securely rather than banning them.
Chapter 1: Introduction
1.1 Code of practice for statistics
The Cyber Security Breaches Survey is an official statistic and has been produced to the standards set out in the Code of Practice for Statistics.
1.2 Background
Publication date: March 2021
Geographic coverage: United Kingdom
The Department for Digital, Culture, Media and Sport (DCMS) commissioned the Cyber Security Breaches Survey of UK businesses, charities and education institutions as part of the National Cyber Security Programme. The findings help these organisations to understand the nature and significance of the cyber security threats they face, and what others are doing to stay secure. It also supports the Government to shape future policy in this area, in line with the National Cyber Security Strategy 2016–2021.
The latest survey was carried out by Ipsos MORI. It covers:
- awareness and attitudes towards cyber security, including the impact of COVID-19
- approaches to cyber security, including the technical and governance processes that organisations have in place to identify and manage cyber risks
- the nature and impact (including estimated costs) of cyber security breaches
- differences by size and sector.
This 2021 publication follows previous surveys in this series, published annually since 2016. In each publication year, the quantitative fieldwork has taken place in the winter of the preceding year (for example, in winter 2020/21, for this latest survey).
This Statistical Release focuses on the business and charity results. The results for educational institutions have been included in a separate Education Annex.
1.3 Methodology
As in previous years, there were two strands to the Cyber Security Breaches Survey:
- We undertook a random probability telephone survey of 1,419 UK businesses, 487 UK registered charities and 378 education institutions from 12 October 2020 to 22 January 2021. The data for businesses and charities have been weighted to be statistically representative of these two populations.
- We carried out 32 in-depth interviews in January 2021, to gain further qualitative insights from some of the organisations that answered the survey.
Sole traders and public-sector organisations were outside the scope of the survey. In addition, businesses with no IT capacity or online presence were deemed ineligible, which led to a small number of specific sectors (agriculture, forestry and fishing) being excluded. These exclusions are consistent with previous years, and the survey is considered comparable across years.
The educational institutions, covered in the separate Education Annex, comprise 135 primary schools, 158 secondary schools, 57 further education colleges and 28 higher education institutions.
More technical details and a copy of the questionnaire are available in the separately published Technical Annex.
1.4 Changes since the 2020 survey
The 2021 survey is methodologically consistent with previous years, in terms of the sampling and data collection approaches. This allows us to look at trends over time with confidence, where the same questions have been asked across years. However, this year’s study makes the following important changes:
- a small number of questionnaire changes to stay in line with DCMS policy objectives (e.g. new questions related to COVID-19 and managing supplier risks)
- a redesign in the way we collect data on the costs of breaches in the survey, as part of a reflection on findings from a separate 2020 DCMS research study on the full cost of cyber security breaches
- an increase in the sample sizes for charities, primary schools, secondary schools and further education colleges, allowing for a more statistically robust dataset for these groups.
This Statistical Release flags any changes that mean findings are no longer comparable with previous years (i.e. where the question wording has changed). A full list of these changes is in the Technical Annex. In particular, the changes to the cost data mean we can no longer make direct comparisons to previous years, but can still comment on whether the pattern of results is similar to previous years.
1.5 Interpretation of findings
How to interpret the quantitative data
The survey results are subject to margins of error, which vary with the size of the sample and the percentage figure concerned. For all percentage[footnote 2] results, subgroup differences by size, and sector, as well as changes since the previous surveys, have been highlighted only where statistically significant (at the 95% level of confidence)[footnote 3]. By extension, where we do not comment on differences across years, for example in line charts, this is specifically because they are not statistically significant differences.
There is a further guide to statistical reliability at the end of this release.
Subgroup definitions and conventions
For businesses, analysis by size splits the population into micro businesses (1 to 9 employees), small businesses (10 to 49 employees), medium businesses (50 to 249 employees) and large businesses (250 employees or more).
For charities, analysis by size is primarily considered in terms of annual income band. The sample size for charities (487) has increased this year compared to the smaller 2020 sample size (387). As a result, we have been able to highlight more income band differences this year, with the greatest focus being on the subgroups of high-income charities (with £500,000 or more in annual income) and those with very high incomes (of £5 million or more).
Due to the relatively small sample sizes for certain business sectors, these have been grouped with other similar sectors for more robust analysis. Business sector groupings referred to across this report, and their respective SIC 2007 sectors, are:
- administration and real estate (L and N)
- construction (F)
- education (P)
- health, social care and social work (Q)
- entertainment, service and membership organisations (R and S)
- finance and insurance (K)
- food and hospitality (I)
- information and communications (J)
- utilities and production (including manufacturing) (B, C, D and E)
- professional, scientific and technical (M)
- retail and wholesale (including vehicle sales and repairs) (G)
- transport and storage (H).
1.6 Acknowledgements
Ipsos MORI and DCMS would like to thank all the organisations and individuals who participated in the survey. We would also like to thank the organisations who endorsed the fieldwork and encouraged organisations to participate, including:
- the Association of British Insurers (ABI)
- the Charity Commission for England and Wales
- the Charity Commission for Northern Ireland
- the Confederation of British Industry (CBI)
- the Institute of Chartered Accountants in England and Wales (ICAEW)
- Jisc, a not-for-profit company that provides digital infrastructure, services and guidance for UK further and higher education institutions.
Chapter 2: Profiling UK businesses and charities
Some organisations may be more at risk of cyber security breaches given their reliance on digital services or e-commerce, or employees’ use of personal devices in the workplace. This brief chapter covers the types of organisations that tend to be more exposed to risks in this way. It helps to contextualise some of the sector differences evidenced in later chapters.
2.1 The digital footprint of different organisations
Almost all organisations have some form of digital exposure. Over nine in ten businesses (96%) and nine in ten charities (88%) have at least one of the items listed in Figure 2.1. These are in addition to the number that will have their own websites and staff email accounts – something we have recorded as being near-universal in previous years of the survey.
Moreover, most organisations have multiple exposure points. Six in ten businesses (59%) and half of charities (50%) have at least three of the items mentioned.
Only a minority of businesses and charities take payments or bookings online. However, medium (42%) and large (44%) businesses are more likely than average (30%) to have such payment capabilities, as high-income charities (42% of those with £500,000 or more, vs. 29% overall).
Network-connected devices (sometimes called smart devices) were a new answer option for the first time this year. These can be devices such as TVs, building controls, alarms or speakers, among others. These are more commonplace in businesses than charities (46% vs. 30%). Larger organisations also report using these devices more often (68% of medium firms, 77% of large firms and 52% of high-income charities do so).
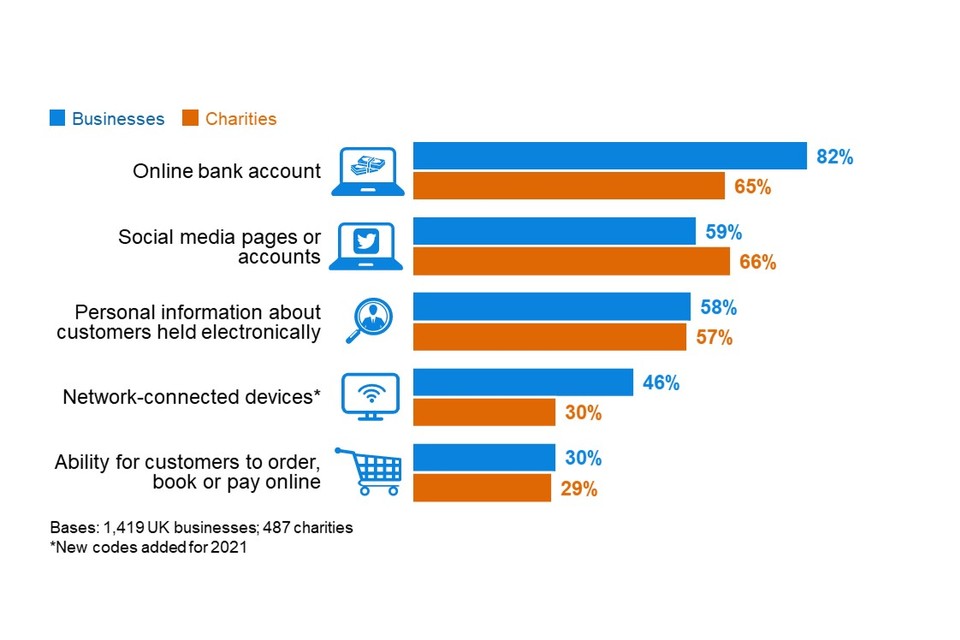
Figure 2.1: Percentage that currently have or use the following digital services or processes
We also continue to ask charities separately about two types of online activity that might affect them, over and above private sector businesses:
- Over four-in-ten charities (45%) allow people to donate to them online.
- Four-in-ten (39%) have beneficiaries that can access services online.
It is more common for high-income charities to allow people to donate to them online (55% of those with £500,000 or more) and to have beneficiaries that can access services online (59%) when compared to charities overall.
Sector differences
Among private businesses, the sectors that are most likely to hold personal data about customers include:
- finance and insurance (82%, vs. 58% overall)
- health, social work and social care (80%)
- administration and real estate (67%).
The sectors where it is most common for customers to book or pay online are, as might be expected, the food and hospitality sector (57%, vs. 30% overall) and the retail and wholesale sector (40%).
All these sectoral differences are broadly in line with what we have found in previous years.
Food and hospitality firms are also more likely than others to use network-connected devices (59%, vs. 46% overall).
Trends over time
This year sees a significant increase in businesses dealing with finances online, both in terms of having an online bank account (82%, vs. 75% in 2020) and accepting online payments (30%, vs. 23% in 2020). Both these indicators had previously remained consistent since 2016.
There is a similar trend for charities. Compared to 2019, a greater proportion now have online bank accounts (65%, vs. 54% in 2019), provide an ability for people to donate online (45% vs. 24%) and allow beneficiaries or service users to access services online (39% vs. 29%). Since 2018, there has also been an increase in charities offering customers the ability to pay online (29%, vs. 20% in 2018).
This could indicate an increase in organisations moving their business or services online during the COVID-19 pandemic, when face-to-face dealings have become more restricted.
2.2 Use of industrial control systems
An industrial control system (ICS) is a digital control system used to control industrial processes such as manufacturing, raw materials and energy production, distribution and telecommunications. Our survey asks the specific sectors that are likely to carry out these processes whether they have an ICS. Our estimates suggest that even in these sectors, ICS is a relatively niche process. This includes:
- utilities and production (9% use ICS)
- information and communications (7%)
- construction (6%).
There are too few transport and storage firms in the sample to report separately this year, but the combined data across the past three years of the survey suggests around five per cent of the businesses in this sector also use ICS.
These results are, broadly, consistent with previous years. The proportions are expected to be considerably higher in large businesses in these sectors, particularly the utilities sector, where most businesses are thought to have some sort of ICS. However, our sample sizes within these sectors do not allow results to be split by size. It is also worth noting that our sector grouping for this report includes manufacturing businesses alongside utilities.
2.3 Use of personal devices
Using a personal device, such as a personal non-work laptop, to carry out work-related activities is known as bringing your own device (BYOD). Around half of businesses (47%) and two-thirds of charities (67%) say that staff in their organisation regularly do this, as Figure 2.2 shows.
BYOD has historically been more prevalent in charities than in businesses (since charities were first included, in the 2018 survey). DCMS’s 2017 qualitative research with charities suggested that this behaviour was especially common among smaller charities. It found that they often have lower budgets for IT equipment or do not have their own office space, so have previously been more likely to encourage home working.
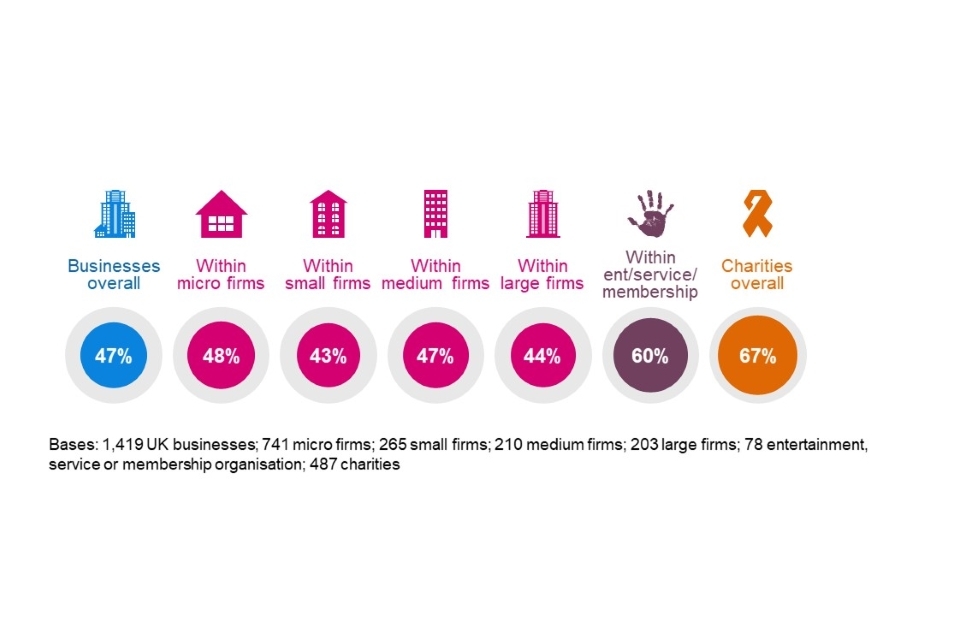
Figure 2.2: Percentage that have any staff using personally owned devices to carry out regular work-related activities
This behaviour is more common among entertainment, service and membership organisations.
The business findings show a small decrease in reported BYOD this year (47%, vs. 53% in 2020). However, this could be a reporting issue rather than a true change in the use of personal devices – organisations may have less oversight of how staff working from home are accessing their files or network, for example.
In addition, this small decrease is counter to the longer-term trend, which suggests little change over the last six years – the business result was 45 per cent in 2016. The charity results have also been relatively consistent since they were first surveyed (in the 2018 study). This suggests that the COVID-19 pandemic has not necessarily caused a sustained rise in the use of personally owned devices – although, as noted, organisations might also have less oversight of this issue than before.
By contrast, in Section 4.3 in the next chapter, we outline that fewer organisations than last year are banning the use of personal devices as a rule. Therefore, more organisations than before are having to plan for the possibility of staff using personal devices.
2.4 Older versions of Windows
This year, we asked organisations for the first time if they had computers with old versions of Windows installed (i.e. Windows 7 or 8). The National Cyber Security Centre (NCSC) and others have previously highlighted how some older software versions (pre-Windows 8.1) have stopped being supported, so may be more vulnerable to cyber security breaches.
As Figure 2.3 shows, one in five businesses (20%) and a similar proportion of charities (17%) say they still have older versions of Windows installed.
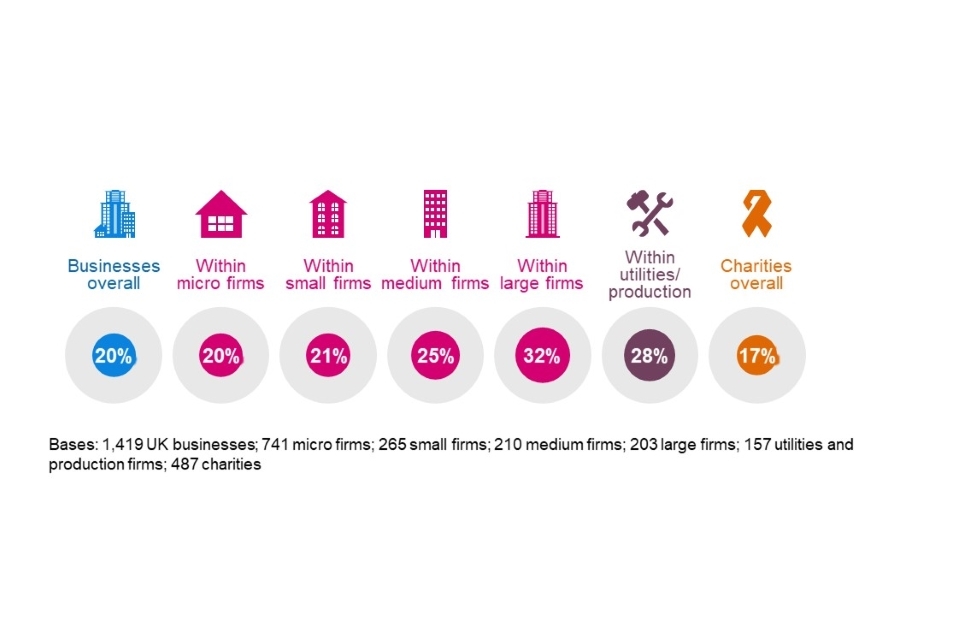
Figure 2.3: Percentage or organisations that have older versions of Windows installed
Having older versions of Windows is more common among large businesses (32%, vs. 20% overall) and those in the utilities and production sector (28%). It is less common in the finance and insurance sector (8%), with other sectors being relatively close to the average.
The qualitative evidence suggests that COVID-19 and the ensuing shift towards home working have made it more challenging for large organisations in particular to deal with legacy hardware and software – there are more endpoints for them to cover, upgrades have to be done remotely, and IT and cyber teams are dealing with competing priorities. This potentially helps to explain why older versions of Windows are more prevalent among larger businesses, even though larger firms tend to have more sophisticated cyber security approaches than smaller ones. The cyber security challenges presented by COVID-19 are covered in more depth in Section 4.9.
Chapter 3: Awareness and attitudes
This chapter starts by exploring how much of a priority cyber security is to businesses and charities, and how this has changed over time. It also looks at where organisations get information and guidance about cyber security, and how useful this is for them. In the qualitative research, we gained feedback on specific government guidance packages as well.
This year’s study is the first to take place since the start of the COVID-19 pandemic and ensuing national restrictions. The quantitative survey covers whether businesses think the COVID-19 pandemic has impacted their prioritisation of cyber security. The qualitative research also explored this topic, as well as broader shifts in attitudes to cyber security.
3.1 Perceived importance of cyber security
Three-quarters of businesses (77%) and seven in ten charities (68%) say that cyber security is a high priority for their senior management. For both groups, there is a relatively equal split between those that say it is a very or fairly high priority, as Figure 3.1 shows.
It is important to note that our survey is carried out with the individual within each organisation who is most responsible for cyber security. In smaller organisations, this is likely to be someone in the senior management team, who can answer this question first-hand. In larger organisations, these individuals may not be senior managers, and their answers will reflect their own perceptions of their senior management teams.
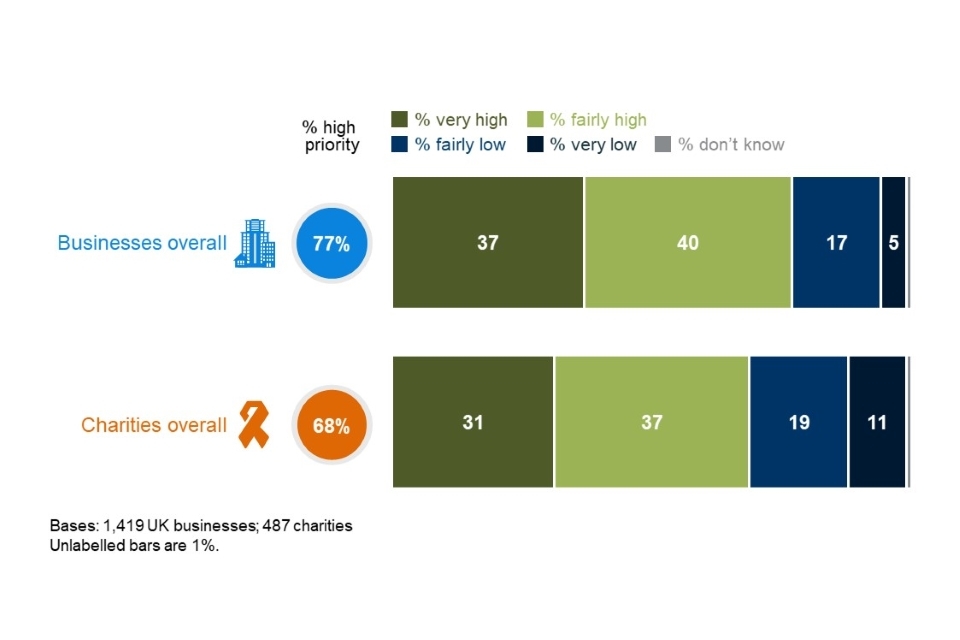
Figure 3.1: Extent to which cyber security is seen as a high or low priority for directors, trustees and other senior managers
It is more common for larger businesses to say that cyber security is a high priority (95% of medium businesses and 93% of large businesses, vs. 77% overall). The same is true for high-income charities (96% of those with £500,000 or more, vs. 68% of charities overall).
The business sectors that attach a higher priority to cyber security are:
- finance and insurance (72% say it is a very high priority, vs. 37% of all businesses)
- information and communications (62%)
- health, social work and social care (56%).
These three sectors have consistently treated cyber security as a higher priority in previous years as well. By contrast, but also in line with last year, the food and hospitality sector and construction sector both tend to treat cyber security as a lesser business priority (only 62% and 64% say it is a high priority, vs. 77% of businesses overall).
The impact of COVID-19 on attitudes towards cyber security
This year, we also explored whether cyber security was felt to have become a higher or lower priority for organisations specifically since the start of the first UK lockdown in March 2020. Overwhelmingly, businesses (84%) and charities (80%) say that it has made no change for their organisation. Among the remainder, hardly any (2% of businesses and 3% of charities) say that it has become a lower priority. This leaves 14 per cent of businesses and 16 per cent of charities saying, instead, that it has become a higher priority.
The qualitative interviews offer further insights into these responses. Among the organisations saying cyber security had become a higher priority under the pandemic, there were those that said that, in their case, the frequency of attacks had increased since March 2020 – especially phishing attacks. Others giving this response felt their organisations were more exposed to cyber risks now that their staff were working from home, because there were more endpoints to deal with and because they had less oversight of staff outside the office. In some cases where organisations had moved online to a greater extent following the lockdown, management boards had started paying more attention to cyber security as a business risk.
“I think senior management have realised that because we are doing so much business online, the volume holds up to having more information about people, and being more vulnerable because of that.” - Small business
However, where the pandemic had not led to this kind of change in business operations, there was a sense that senior management attitudes had not hugely shifted, or at least that any senior focus on cyber security was temporary. Moreover, while some interviewees mentioned that IT and cyber security investment had increased early on in the pandemic, these increases were often framed more in terms of business continuity than cyber security. These interviews suggest that senior managers often view business continuity and cyber security as distinct aims, rather than viewing them as complementary.
There were broadly two types of organisations saying their prioritisation was unchanged. Firstly, there were those that felt they already treated cyber security as a high priority before the pandemic. Secondly, there were some who did not believe that COVID-19 had increased their cyber risk, because they already had staff working at home before the pandemic. The latter group tended to have taken little to no action to adapt cyber security policies and processes to COVID-19, even if more of their staff were now working at home on a regular basis.
The handful of interviewees saying cyber security had become a lower priority under COVID-19 sometimes did not have clear reasons for this. However, one admitted that they simply had not had time to review their approach to cyber security since the first lockdown. Another mentioned that other aspects business continuity was a much greater priority for them in the early stages.
“The priority for us as a business was survival, making sure that we felt our staff were safe, that they had enough room to socially distance and that we were able to carry on providing the service to our customers … It was more about survival than anything else from March 2020 until June 2020.” - Small business
Cyber security was a lower priority at the beginning because … from the other directors’ perspective, it’s their job to keep the business running at whatever cost. My role is to fight against that a little bit. It’s not at any cost. There still has to be a layer of security and we still need to be confident that whatever we do isn’t going to make us any more vulnerable. But it wasn’t the time to say, ‘I think we should start making things more secure’.” - Medium business
Trend over time
Figure 3.2 shows how the prioritisation score has actually changed over a longer period of time. For both businesses and charities, the fluctuations from 2019 to 2021 are not statistically significant . Ultimately, this supports the notion that, for most organisations, cyber security remains highly important to senior managers in the wake of the COVID-19 pandemic, as it was before the pandemic. However, the qualitative findings discussed in the previous section add a great deal of nuance to this, highlighting that service continuity and flexibility have been viewed as competing priorities with cyber security since the first UK lockdown.
The proportion saying cyber security is a high priority in 2021 remains higher than when we first measured this for businesses (2016) and charities (2018). As noted in previous years, the more substantial rise for charities between 2018 and 2019 is likely to have been driven by the introduction of the General Data Protection Regulation (GDPR) in early 2018.
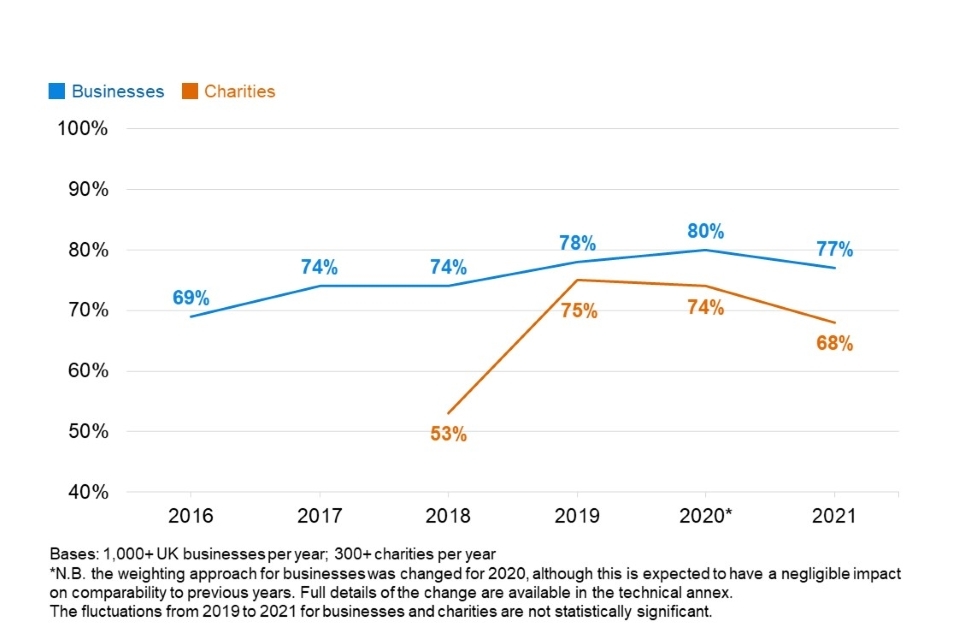
Figure 3.2: Percentage of organisations over time where cyber security is seen as a high priority for directors, trustees and other senior managers
3.2 Involvement of senior management
How often are senior managers updated on cyber security?
Figure 3.3 breaks down how often senior managers get updates on the state of cyber security and any actions being taken. It shows that updates tend to be more frequent in businesses than in charities, continuing a trend from previous years.
Two-thirds of businesses (64%) and six in ten charities (61%) say senior managers are updated at least once a year[footnote 4]. This is in addition to the four per cent in each case that say they are updated every time there is a breach (which may vary in regularity).
On average, businesses update their senior managers more often than charities. Half of businesses (50%) update them at least quarterly, while four in ten charities (40%) do this.
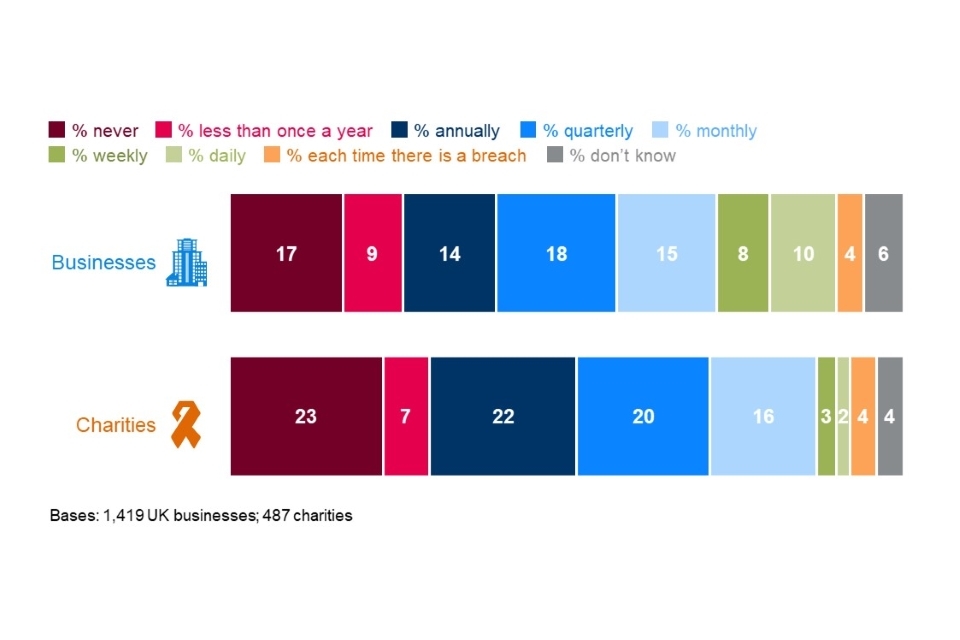
Figure 3.3: How often directors, trustees or other senior managers are given an update on any actions taken around cyber security
As in previous years, this varies greatly by the size of the organisation. Medium and large businesses tend to have very similar behaviours in this respect. For example, three-quarters of medium businesses (74%) and large businesses (73%) have senior managers updated at least quarterly, compared to just over half of small businesses (54%) and half of micro businesses (48%). Two-thirds (67%) of high-income charities provide quarterly updates to their trustees. These results are in line with the 2020 survey.
Entertainment, services or membership organisations are more likely than average to say their senior managers are never given any updates on cyber security (36%, vs. 17% overall).
Board responsibilities
Around two-fifths of businesses and one-third of charities have board members or trustees with a cyber security brief (Figure 3.4). As might be expected, this is much more common in larger organisations, where the management board is likely to be larger.
This is not the case in charities with higher incomes – under two-fifths of high-income charities (36% of those with £500,000 or more) and those with very high incomes (37% of those with £5 million or more) have a trustee with responsibility for cyber security, close to the average.
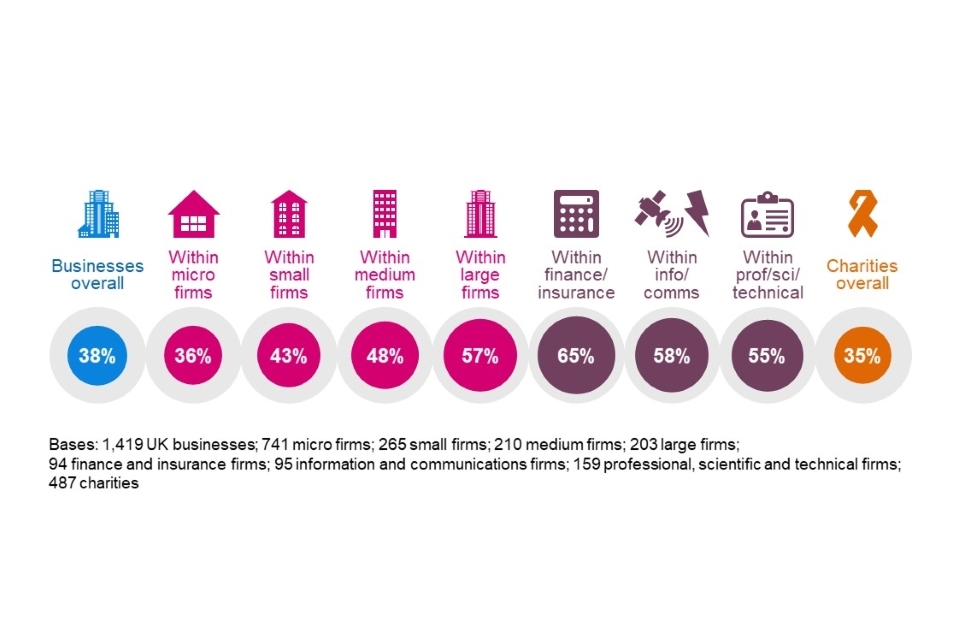
Figure 3.4: Percentage of organisations with board members or trustees that have responsibility for cyber security
Finance and insurance firms, information and communications firms, and professional, scientific and technical firms are all more likely than average to have board members taking on this kind of responsibility. The first two of these sectors were also above the average at this question in previous years. At the other end of the scale, construction firms (20%), food and hospitality firms (24%), and entertainment, service or membership organisations (24%) are among the least likely to have board members assigned this role.
Trends over time
The proportion of businesses saying that senior managers are never updated on cyber security has remained stable for the past three years (Figure 3.5). This means that cyber security is still being discussed more in boardrooms than it was in 2016 and 2017.
For charities, the results are expected to be more erratic given the lower sample size. The proportion of charities now saying they never update senior managers on cyber security is up from 2020, and is closer to the 2019 level. This might, however, mean that the 2020 result was an outlier. In the longer term, the result is still more positive than the (pre-GDPR) 2018 survey.
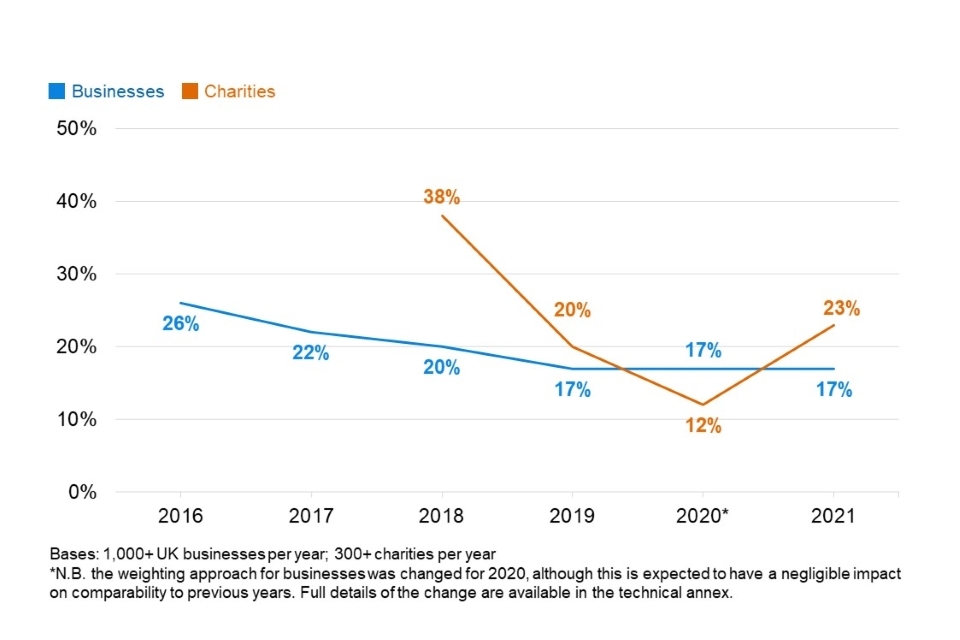
Figure 3.5: Percentage of organisations over time that never update senior managers on any actions taken around cyber security
Figure 3.6 shows the trend over time for board members taking on cyber security responsibilities. This shows a similar pattern – it has been relatively flat for businesses over the past three years, but it is still more likely that board members are taking on such a role than it was in 2016 and 2017. For large businesses, this proportion has dropped since 2020, but remains in line with the 2018 and 2019 results.
In charities, the 2021 result remains higher than it was in 2018, suggesting an ongoing legacy from GDPR implementation. The 2020 result is, by contrast, far higher than this year and the preceding year. As such, it may be an outlier in terms of the long-term trend.
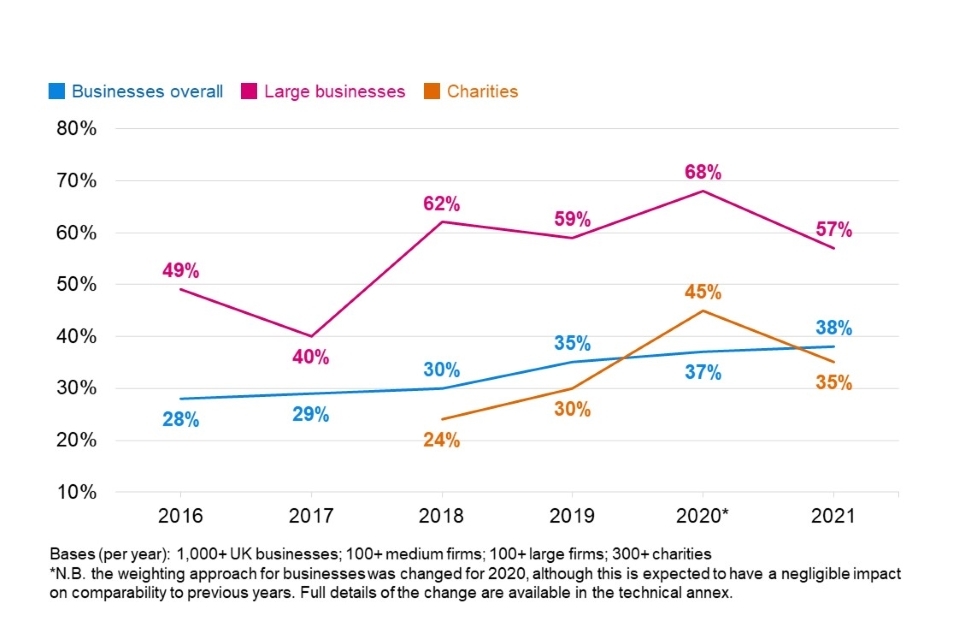
Figure 3.6: Percentage of organisations over time with board members or trustees with responsibility for cyber security
3.3 Sources of information
Overall proportion seeking cyber security information or guidance
The quantitative survey shows that around half of businesses (53%) and over four in ten charities (45%) report actively seeking information or guidance on cyber security from outside their organisation in the past year.
For businesses overall, this result is lower than its peak in in 2018 and 2019 (59%), which was seen in the lead up to, and aftermath of GDPR implementation. However, for large businesses specifically, the 2021 result (75%) is higher than in 2020 (57%) and 2019 (64%). This indicates an increase in information seeking for the largest organisations during the COVID-19 pandemic.
For charities, the result has been less constant over time, but has typically hovered around five in ten or just under.
External information seeking continues to be more common among small, medium and large businesses than micro ones, as Figure 3.7 shows. The sectors where firms are most likely to seek out external information are finance and insurance, and information and communications.
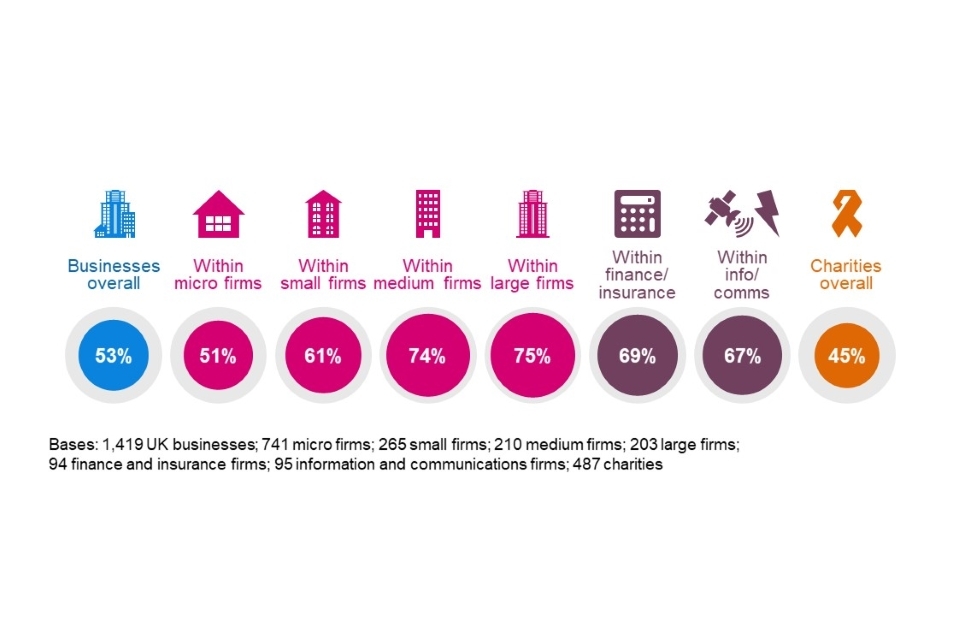
Figure 3.7: Proportion of organisations that have sought external information or guidance in the last 12 months on the cyber security threats faced by their organisation
A minority of businesses and charities seek information internally within their organisations (3% of businesses and 7% of charities), which is in line with previous years.
Where do organisations get information and guidance?
The results in Figure 3.7 combine all the individual, unprompted responses that organisations give in the survey. The most common individual sources of information and guidance are:
- external cyber security consultants, IT consultants or IT service providers (mentioned by 26% of all businesses and 13% of all charities)
- general online searching (9% of businesses and 3% of charities)
- any government or public sector source, including government websites, regulators and other public bodies (8% of businesses and 13% of charities).
These have also been the most frequently mentioned sources in previous years. The relatively low proportions for each of these highlights that there is still no commonly agreed information source when it comes to cyber security. For example, just one per cent of businesses overall, and three per cent of large businesses, mention the National Cyber Security Centre (NCSC) by name. Among charities, just six per cent mention charity-specific sources such as their country’s charity regulator[footnote 5].
Awareness of government guidance, initiatives and communications
The unprompted question around information sources tends to underrepresent actual awareness of government communications on cyber security, as people do not necessarily recall the specific things they have seen and heard. We therefore asked organisations whether they have heard of specific initiatives or communications campaigns before. These include:
- the national Cyber Aware communications campaign, which offers tips and advice to protect individuals and organisations against cybercrime
- the 10 Steps to Cyber Security guidance, which aims to summarise what organisations should do to protect themselves
- the government-endorsed Cyber Essentials scheme, which enables organisations to be certified independently for having met a good-practice standard in cyber security.
This year, we also included two new sets of guidance that the NCSC issued in response to the COVID-19 pandemic:
- guidance on home working and video conferencing services
- guidance on moving business online.
Figure 3.8 illustrates that it is still a minority of businesses and charities that are aware of each of these schemes or sets of guidance. Nevertheless, the relatively new guidance on home working and video conferencing appears to have made a strong impact, with a fifth of businesses and a quarter of charities recalling seeing this guidance.
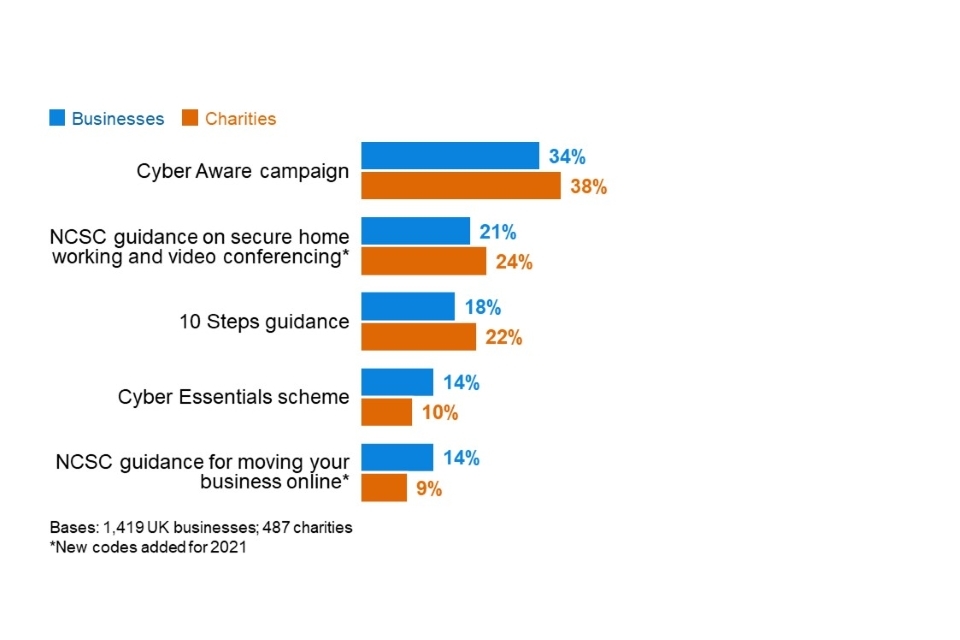
Figure 3.8: Percentage of organisations aware of the following government guidance, initiatives or communication campaigns
Information and communications firms, and professional, scientific and technical firms both tend to be more aware of several of these schemes or sets of guidance. This includes the new guidance on home working and video conferencing (of which 33% and 32% are aware respectively, vs. 21% of businesses overall). Medium and large firms are also substantially more aware of all these guidance packages, breaking down as follows:
- Cyber Aware (38% of medium firms and 48% of large firms)
- NCSC home working and video conferencing guidance (39% and 38% respectively)
- 10 Steps guidance (34% and 41%)
- Cyber Essentials (45% and 50%)
- NCSC guidance for moving business online (19% and 26%).
This year’s results continue to show a slow, gradual rise in awareness of government initiatives:
- For businesses, awareness of Cyber Aware is now 13 percentage points higher than in 2017 (when this question was first asked). For charities, it has increase by eight percentages points since 2018 (when charities were first included in the survey).
- Compared to the 2016 results, business awareness of the 10 Steps has increased by seven points and awareness of Cyber Essentials by eight points.
Guidance targeted at specific types of organisations
We also asked again this year about NCSC guidance that is specifically directed at smaller or larger businesses, as well as at charities. This includes:
- the NCSC’s Small Business Guide and Small Charity Guide, which outline more basic steps that these smaller organisations can do to protect themselves
- the NCSC’s Board Toolkit, which helps management boards to understand their obligations and to discuss cyber security with the technical experts in their organisation.
For these sets of guidance, we find that:
- 18 per cent of micro and small firms respectively have heard of the Small Business Guide
- 15 per cent of charities have heard of the Small Charities Guide
- 18 per cent of medium businesses (up from 11% in 2020) and 24 per cent of large businesses have heard of the Board Toolkit.
Impact of government information and guidance
This year, we asked an unprompted follow-up question for the first time to all those that recall seeing any of the government communications or guidance covered in the previous section, exploring whether this has led to them making changes to their cyber security. In total, just under four in ten businesses (37%) and charities (38%) report making changes to their cyber security measures as a direct response to seeing this government guidance.
Across businesses, this does not vary greatly by size. However, among charities that have seen these government communications, those with very high incomes are more likely than the average charity to say they have made changes in response (54% of those with £5 million or more say this).
In terms of the specific changes made, there are a wide variety of responses given, and no single response appears especially frequently.
- 21 per cent of all businesses and 17 per cent of all charities report making changes of a technical nature (e.g. to firewalls, malware protections, user access or monitoring).
- 12 per cent of businesses and 15 per cent of charities say they have made changes to do with staffing (e.g. employing new cyber security staff), outsourcing or training. Indeed, the most common single response is to say they have implemented new staff training or communications (in 8% of businesses and 12% of charities). *12 per cent of businesses and 16 per cent of charities have made governance changes in response, drafting or updating documentation or checks in place.
Qualitative insights on NCSC cyber security guidance for COVID-19
Before the qualitative interviews, we asked interviewees to look at one of a handful of NCSC guidance designed to support organisations dealing with COVID-19. These included the guidance on home working, guidance on video conferencing services and guidance on moving business online covered in the quantitative survey, as well as an NCSC blog post on personal devices.
This was not detailed user testing. In some cases, interviewees had just briefly reviewed the guidance. Therefore, the findings reported here are very broad.
In general, all the guidance was well received. Interviewees felt the pages were easy to navigate, user-friendly and applicable to a range of organisations. Some highlighted that the guidance was helpful to reassure them that they were taking the right approach, and they would cross-reference any recommendations against what their organisation was already doing.
“You are reading through it and it did make you think – have we done that? Can I be sure about that? The patching, the backups and the access, it was just a good opportunity to go back over those things.” - Small business
There was some uncertainty around who the guidance was aimed at. Some felt it was more for business owners as it was considered too basic for IT staff. However, in instances where we interviewed a director, some said they would simply forward it on to their IT lead. Others noted that it was generally very difficult to get board members in large organisations to read through technical guidance like this, but that IT staff could use the guidance to raise awareness among board members and wider staff. On this point, one interviewee said it would be useful to have PowerPoint versions of the guidance to present to their board.
There was a sense that the video conferencing guidance would have been most useful at the start of the pandemic (around when the NCSC originally released it) and its usefulness might now start to wane. However, it might still be useful for new organisations.
“I think that it is very, very detailed and I think that is really helpful particularly for people who are in the infancy of this kind of a journey. We use Microsoft Teams, so it pretty much does all that, but that’s not available to everybody.” - High-income charity
There were suggestions that this specific guidance could also be more effective if it told organisations how to go about choosing the best video conferencing service for them.
3.4 Cyber security priorities and drivers of change
The qualitative research identified some broad shifts in cyber security priorities. Our focus here was among the larger organisations that tended to already have more sophisticated approaches to cyber security, to get a sense of their direction of travel.
- There was a greater emphasis on continuous improvement and integration of new technologies, as opposed to the step change that GDPR had brought about in 2018. Various organisations said they would focus the next 12 months on, for example, rolling out multi-factor authentication, tweaking policies and processes to cover Software as a Service (SaaS), improving monitoring and generally upgrading IT infrastructure.
- Some interviewees said they were gradually moving away from an approach of locking down user activity, towards one that prioritised functionality and flexibility. There was a sense that staff increasingly expected access to new technologies, software and platforms (e.g. SharePoint) to stay productive, and cyber teams would need to try to find ways for wider staff to use these platforms securely rather than banning their use. A couple of interviewees also mentioned that staff would necessarily have to take on more personal responsibility for cyber security if continuing to work from home post-pandemic.
“My task list in my security programme is pretty much the same. Just maturing as you would expect. People want to use technology more. The more systems, the more tech we use – we need to make sure it is being used securely.” - Medium business
We also explored the drivers of change in attitudes towards cyber security in interviews. The following drivers meant that cyber security was considered a business risk, rather than simply an IT risk, which led to boards paying more attention to it:
- As in previous years, experiencing a cyber security incident was a big driver of change. For instance, one medium information and communications business had devices stolen in 2019, and realised they had no facility to remotely wipe these devices. One of their main focuses in 2019 was therefore on securing and tracking devices outside the office.
- Similarly, competitors experiencing cyber security breaches could grab the attention of board members and lead to significant action.
“An agency in the same industry as our organisation was attacked and breached recently, and this gained attention at all levels, including the board. This meant that we had to issue a report that compared our cyber security against theirs, to reassure people and to point out where we’d need to change things over the next six to twelve months.” - Large business
- Some mentioned increasing cyber security demands from clients, or requirements written into contracts, as drivers of changes in attitudes. In one case, this had led to a construction business applying for ISO 27001 certification to circumvent paperwork with clients (covered again in Section 4.8).
Chapter 4: Approaches to cyber security
This chapter looks at the various ways in which organisations are dealing with cyber security. This covers topics such as:
- risk management (including supplier risks)
- cyber insurance
- technical controls
- training and awareness raising
- staffing and outsourcing
- governance approaches and policies.
We then cover the extent to which organisations are meeting the requirements set out in government-endorsed Cyber Essentials scheme and the government’s 10 Steps to Cyber Security guidance.
The qualitative research explored five specific topics this year – cyber security risk assessments, audits, supplier risks, cyber insurance, and accredited cyber security standards – which are covered across this chapter alongside the relevant quantitative survey findings.
As noted earlier in this report, this is the first study in this series to take place during the COVID-19 pandemic. As such, an important part of this year’s survey and qualitative interviews, has been to explore organisations’ cyber resilience under the pandemic and the impact it has had on approaches to cyber security. These findings are included at the end of this chapter.
4.1 Identifying, managing and minimising cyber risks
Actions taken to identify risks
The survey covers a range of actions that organisations can take to identify cyber security risks, including monitoring, risk assessment, audits and testing. Organisations are not necessarily expected to be doing all of these things – the appropriate level of action depends on their own risk profiles.
Figure 4.1 shows the full list from the survey. Around half of businesses and charities have taken at least one of these actions in the last 12 months – although this means that around half have done none of these things. Taken individually, only a minority of organisations are carrying out each of these actions.
The most common actions are around deploying security monitoring tools and undertaking risk assessments. By contrast, threat intelligence remains a relatively niche undertaking. These results are mostly consistent with previous years, although fewer businesses are carrying out security monitoring this year than in 2020 (down from 40% to 35%).
The new categories covered for the first time this year – mock phishing exercises, vulnerability audits and penetration testing – are also relatively uncommon, undertaken by around one to two in ten organisations. While the survey has asked about audits in previous years, the significant change to the question wording here means this result is not comparable with previous years.
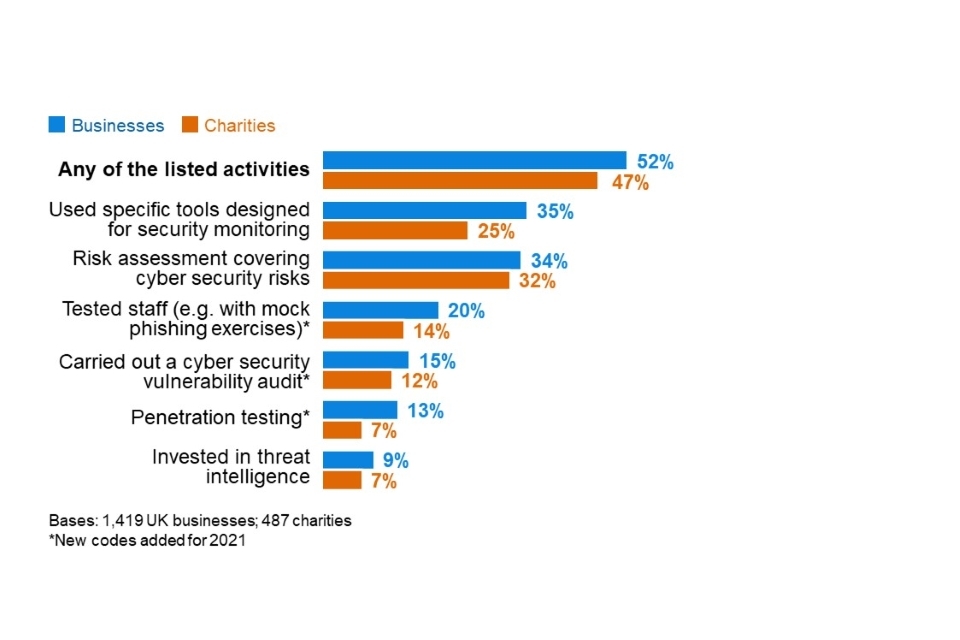
Figure 4.1: Percentage of organisations that have carried out the following activities to identify cyber security risks in the last 12 months
As has been established in previous years, each of these actions are more common in medium and large businesses, as well as high-income charities (with £500,000 or more).
Finance and insurance firms (76%), and information and communications firms (69%) are also more likely than average (52%) to have taken any of these actions. At the other end, construction firms (35%) are less likely to have done any of these things. These sectoral differences are similar to previous years.
Looking specifically at the new answer options this year, these are also more commonly carried out by large businesses and high-income charities – although even among these populations, it is not necessarily a clear majority undertaking each individual action:
- 52 per cent of large businesses and 23 per cent of high-income charities carry out penetration testing.
- 49 per cent and 37 per cent respectively have tested their staff response, with mock phishing or similar exercises.
- 48 per cent and 26 per cent respectively undertake cyber security vulnerability audits.
Approaches to cyber security risk assessments
In the qualitative research, we found that approaches to risk assessments varied considerably. Some organisations carried them out on a project-by-project basis, some undertook them as regular scheduled activities, and some had done them reactively in response to breaches.
In addition to their core purpose of identifying key risks, risk assessments were often viewed as a good way to produce evidence for management boards, which could be used to justify proposed cyber security actions or investment, or to show trends over time and whether things had improved. For example, one medium business carried out a mock phishing exercise as part of their risk assessment – they found that 15 per cent of staff responded to the mock phishing email, and presented these findings to the management board. This led to new user training on phishing emails, as well as other technical rule changes.
Furthermore, some interviewees considered risk assessments as a way of raising the profile of cyber security with staff. In their view, the risk assessment exercise demonstrated the importance the organisation was placing on cyber security internally.
One large business also highlighted the external reputational benefits of carrying out cyber security risk assessments, to support bids for new work with corporate clients, or to show regulators that cyber security was being taken seriously.
Many interviewees noted that there was no standard approach for doing a cyber security risk assessment, as far as they knew. Some used specialist software like the Cyber Security Assessment Tool (CSAT), or employed a traffic lights system. Some carried out penetration testing or mock phishing exercises as part of the risk assessment. Others admitted that their approach might be outdated or too informal, but were uncertain about best practice and how they could improve it.
“If you have five different IT managers, you will get a different approach [to risk assessment] due to their own personal experience.” - High-income charity
The approach often depended on who was conducting the assessment. Those led by IT teams tended to be more focused on technical IT issues and improvements. In one instance, the assessment was purely technical and did not cover areas such as user awareness and training. By contrast, assessments undertaken outside of IT teams had often been instigated in response to the General Data Protection Regulation (GDPR), and were therefore more focused on things like adherence to data storage policies and GDPR checks for suppliers.
In a handful of instances, organisations had arranged for external risk assessments. These tended to be far more comprehensive and wide-ranging than internal assessments. For example, one university had contracted an external supplier to carry out a cyber security risk assessment, which came back with around 200 recommendations to be implemented over the next three to five years.
Risk assessment findings were typically reported to management boards in some form, for example with a presentation of findings. In some cases, they fed into updates to corporate risk registers, which also fed into actions taken by the board.
How organisations undertake audits and implement their findings
In a new question this year, we asked organisations that have undertaken cyber security vulnerability audits if these were internal or external. Among the 15 per cent of businesses that have done so, similar proportions of businesses undertook internal audits (36% of businesses), external audits (32%) or do both (29%). This is strongly linked to the size of the organisation:
- Micro businesses are most likely to solely use internal staff to undertake audits (43% of the micro firms undergoing any type of audit).
- Small and medium businesses have the greatest tendency to only use external contractors (51% and 40% respectively).
- Large businesses, likely having greater resources, are most likely to state that audits have been undertaken both internally and externally (50%).
A total of 12 per cent of charities have carried out cyber security vulnerability audits. Due to the lower overall sample size for charities, this leaves too few charities in the sample to split out by the type of audit undertaken.
In the qualitative interviews, we found that internal audits tended to be less formal and take place more frequently than external ones – sometimes taking place continuously, to:
- keep abreast of new technologies, threats or vulnerabilities
- spot check patching, encryption and malware on devices
- check whether staff are adhering to existing policies and rules.
These internal audits were typically a way for organisations to proactively monitor risks and quickly identify weaknesses in staff behaviour.
“It’s an ongoing process. We are evolving as we go along, getting better and better. As new technologies come along, you change.” - Large business
By contrast, external audits were carried out where organisations wanted independent assurance that they were following the right course of action, or independent recommendations. These external audits were much less frequent, taking place annually or as one-off exercises. They tended to be more comprehensive, with results and follow-up actions being reported to the board. In one instance, the external audit took four months. In several cases, they involved penetration testing, which was another reason for hiring an external contractor – as organisations did not have the skills to carry out such tests internally.
“Sometimes it’s great, and we get a pass. Pass or fail, it will go to the board. It’s like a MOT. Some of the recommendations, we may put into a change log of work. Sometimes we fail and have to change right away and rescan until we pass.” - Large business
Reviewing supplier risks
Suppliers can pose various risks to an organisation’s cyber security, for example in terms of:
- third-party access to an organisation’s systems
- suppliers storing the personal data or intellectual property of a client organisation
- phishing attacks, viruses or other malware originating from suppliers.
As Figure 4.2 shows, the majority of organisations of all sizes have not formally reviewed the risks posed by their immediate suppliers and wider supply chain. Even among charities with very high incomes (of £5 million or more), only 36 per cent have reviewed risks posed by immediate suppliers or partners and nine per cent report looking at wider supply chain risks.
This is broadly in line with the 2020 results (when these questions were first asked), but it is worth noting that the proportion of businesses saying they have reviewed wider supply chain risks is lower this year (at 5%, vs. 9% in 2020) – a statistically significant albeit small difference.
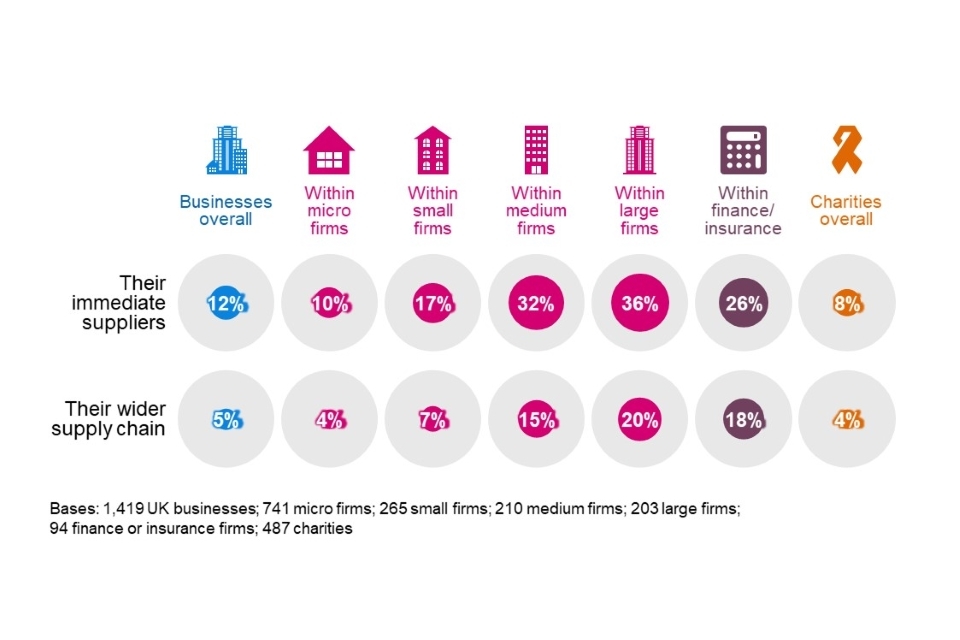
Figure 4.2: Percentage of organisations that have carried out work to formally review the potential cyber security risks presented by the following groups of suppliers
Businesses in the finance and insurance sector (26%), and information and communications sector (26%) are more likely than average (12%) to monitor immediate supplier risks. Finance and insurance businesses are also more likely than average to have reviewed their wider supply chains (18%). However, it is still a minority of the businesses in these sectors that do so, despite tending to have more sophisticated approaches to cyber security overall.
Barriers to addressing supplier risks
This year’s survey asked a new question to explore whether there were any major barriers that prevented staff from understanding their supply chain risks. As Figure 4.4 shows, among the businesses that have attempted to review such risks, there is no single standout barrier. Instead, there are roughly equal proportions suggesting that a lack of time, information or knowledge to look into supply chain risks are issues for them. Not knowing which suppliers to check seems, on the other hand, to be a lesser problem for businesses.
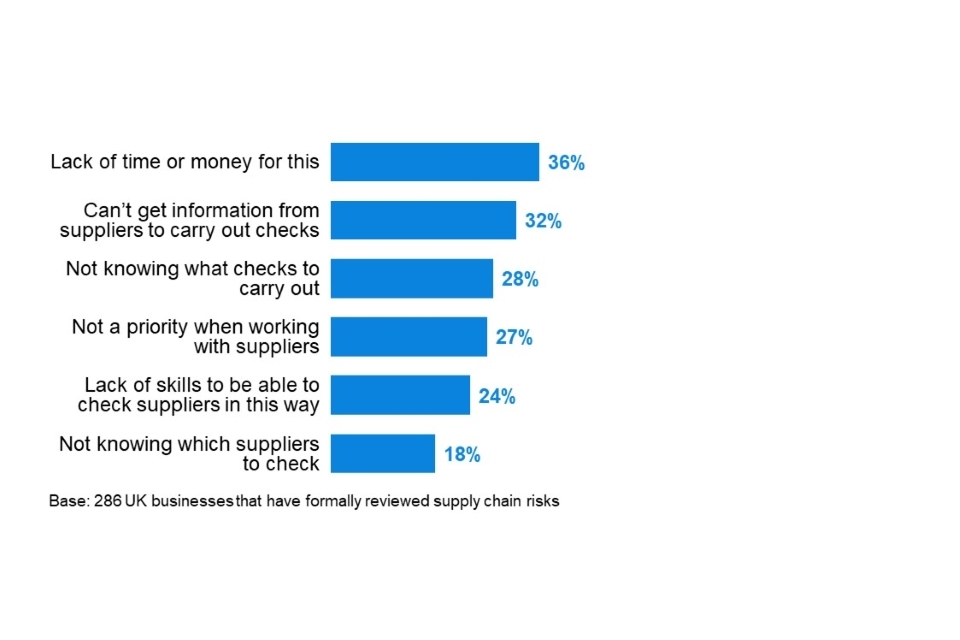
Figure 4.3: Barriers to businesses undertaking formal review of supplier or supply chain risks
With the overall smaller sample size for charities, and the fact that under one in ten have reviewed supply chain risks, there are too few charities to analyse the barriers at this question.
Qualitative insights on supply chain risk management
Supply chain risks were explored in the qualitative interviews. We mainly discussed this topic with organisations that had attempted to review supply chain risks in some way, although we also spoke to a handful that had not made any efforts in this area. The latter group offered various reasons for this, some of which have emerged in previous years of this study:
- Some were uncertain about the questions they should ask suppliers and what good would look like in terms of suppliers’ cyber security.
- This uncertainty around the approach was a bigger issue when it came to wider supply chain monitoring. There was a sense that organisations would not be privy to information about suppliers’ suppliers. One interviewee had attempted to circumvent this by adding a contractual requirement for their immediate suppliers to take responsibility for monitoring their own supply chain cyber security. This would allow them to trace any issues up the chain if they arose.
- Some interviewees assumed that larger suppliers or partners, or ones with a high profile (e.g. a Local Authority working with a charity), would have stringent cyber security standards that did not require checking.
- A couple of interviewees highlighted that procurement was dealt with by a different team or carried out on a project-by-project basis, so IT teams did not have oversight of suppliers.
- A new issue raised this year was concern about the burden placed on smaller suppliers if they were made to adhere to cyber security standards. One interviewee indicated that they had previously lost suppliers due to the compliance demands they put in their contracts.
“A lot of suppliers operate at fine margins, and if we start imposing standards that we think they should be operating at, that could make the work they’re doing with us unsustainable, or they may pass the costs onto us.” - Large business
- Linked to this, some organisations noted a lack of choice among suppliers, and that it could be hard to find any supplier meeting cyber security standards in certain markets.
Among those that had reviewed these risks, several organisations said they treated every supplier the same. On the other hand, it was also common for organisations to have stricter standards for IT suppliers, suppliers that dealt with payroll data and those that dealt with any personal data. The latter was explicitly linked to the need to be GDPR-compliant.
“There are minimum criteria suppliers need to adhere to depending on the sensitivity of information they are processing. It may well be the organisation having their own Cyber Essentials accreditation, but if the information is not so sensitive, then that may be a nice to have as opposed to an essential … This is part of the award of the contract for them.” - Large business
There were also cases where smaller suppliers or those with which organisations already had long-term relationships were more likely to be given the benefit of the doubt and not subject to checks, as the existing relationship was based on trust.
Two relatively common ways of managing supplier risks included writing cyber security requirements or service-level agreements into contracts, and requiring suppliers to adhere to an external standard, like the Cyber Essentials standard (covered in Section 4.8). The latter was considered a relatively straightforward way to ensure that suppliers took cyber security seriously without having to collect lots of specific information.
We spoke to one university that had around 400 major suppliers and did not have the time to review each of their cyber security approaches individually. In this case, the university had experienced a supplier-related cyber security incident – one of their building management contractors had their systems compromised – but were uncertain what they could feasibly do to monitor all their suppliers. During the interview, they suggested that it might be feasible to have all suppliers adhere to Cyber Essentials, but this was not currently a requirement.
We also came across more bespoke ways of dealing with suppliers. One organisation had a three strikes policy and had dismissed a supplier on this basis. Some checked that suppliers had cyber security and GDPR policies in place. Some asked for more technical information or specified encryption standards.
4.2 Insurance against cyber security breaches
Which organisations are insured?
Over four in ten businesses (43%) and three in ten charities (29%) report being insured against cyber risks in some way. As Figure 4.4 shows, across all size bands, this is more likely to be through a broader insurance policy, rather than one that is cyber-specific. Specific policies are more prevalent among medium and large firms.
The proportion of businesses with insurance has increased by 11 percentage points since last year (when this version of the question was first asked). This is mainly due to a greater proportion of micro and small firms now reporting that they have cyber insurance as part of wider policy. The proportion for charities is in line with last year.
It is worth noting the high level of uncertainty remains at this question. Among those responsible for cyber security in the private sector, one-fifth (18%) do not know if their employer has any form of cyber security insurance. In charities, this increases to one-quarter (25%).
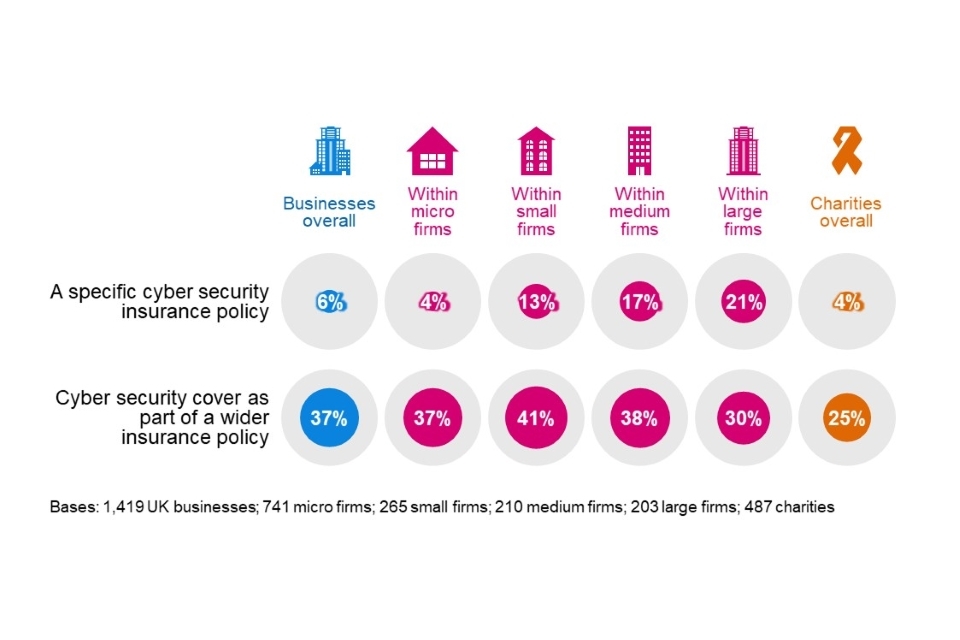
Figure 4.4: Percentage of organisations that have the following types of insurance against cyber security risks
As might be expected, insurance cover is more prevalent in the finance and insurance sector itself. Six in ten finance and insurance firms have some sort of coverage against cyber security breaches (60%, vs. 43% overall). Even here, this is not a specific cyber security insurance policy in most cases (only 18% of these firms have a specific policy). Other sectors where over half reported some form of cyber insurance were:
- information and communications (57%)
- health, social care and social work (53%)
- professional, scientific and technical firms (53%).
Higher-income charities (with £500,000 or more) are more likely than others to have cyber security cover (56%), either as part of a generally insurance policy (42% vs. 25% overall) or in specific policy (13% vs. 4% overall). This becomes a much clearer majority among the very high-income charities (68% among those with £5 million or more).
Making an insurance claim
Of those have some form of cyber insurance, a very small proportion of businesses and charities report having made an insurance claim to date (less than 1% in each case). Large businesses are more likely to have made a claim (7%), but this remains a small minority.
Qualitative insights around cyber security insurance
In the qualitative research, the organisations that had taken out some form of cyber insurance had done so for a range of reasons. One common thread among larger organisations was that a significant cyber security breach could be an existential threat – it could shut down an organisation that did not have enough money in the bank to fund a recovery, or the specialist skills to deal with incident response and potential reputational damage. As such, the access to post-breach services was a particularly important aspect of cyber insurance policies, with interviewees mentioning things like access to a helpdesk to deal with ransomware attacks, forensic analysis experts and communications support.
This also guided organisations’ approaches to making a claim. Various organisations said they would always expect to make a claim for any breaches that they could not resolve within their own means. One charity also said they would alert their insurer to any breaches covered under the policy, and would still enquire about any post-breach services they could access under alternative arrangements, even if they did not intend to make a claim.
One large recruitment business also mentioned that they wanted to be covered financially for any fines that might be levied for personal data breaches. They also said that having some form of cyber insurance was increasingly a client requirement in contracts.
“We thought it was important to have insurance, because of the essential scope of the fines we were at risk of, if we were found to have lost data … The Information Commissioner’s Office could fine up to four per cent of turnover and we wanted to cover that.” - Large business
It was typical for organisations to have to lay out their cyber security approaches and standards when applying for cyber insurance. Generally, the organisations we interviewed already met these minimum requirements. Nevertheless, in one instance, this had led a small business to raise their standards to qualify for the insurance. This involved them establishing a secure area on their website, buying their own domain and having their own email server.
One higher education institution mentioned that their insurance provider often gave them informal threat intelligence, for example by highlighting software that might have security issues based on claims made by their other cyber insurance clients. They speculated that this type of threat intelligence could, if scaled up and made a formal part of the insurance package, become a major incentive for large organisations to purchase cyber insurance in the future.
4.3 Technical cyber security controls
Each year, the survey has asked whether organisations have a range of technical rules and controls in place to help minimise the risk of cyber security breaches. The full list is shown in Figure 4.5. Many of these are basic good practice controls taken from government guidance such as the 10 Steps to Cyber Security or the requirements of Cyber Essentials. Towards the end of this chapter, we map survey responses to these schemes to estimate how many organisations are operating in line with the guidance.
As Figure 4.5 indicates, a clear majority of businesses and charities have a range of basic rules and controls in place, covering aspects such as malware protection, password policies, network firewalls and restricted IT admin rights. By contrast, rules around personal data storage and transfer, and attempts to monitor user activity, are far less common. Businesses remain more likely than charities to have many of the full list of technical controls in place.
Backing up of data is also extremely common among businesses – nine in ten (88%) have backups either on cloud servers or elsewhere – but this is again less common for charities (68%). This specific result has also fallen for charities since 2020 (when it was 77%).
This year’s survey covered three new areas for the first time:
- Six in ten businesses (58%) have an agreed process for staff around phishing attacks, but only four in ten charities (43%) do. This is more common among medium (88%) and large (85%) businesses, high-income charities (76% of those with £500,000 or more) and businesses in the finance and insurance (83%), and health, social care and social work (71%) sectors.
- Just over four in ten businesses (43%) and around a quarter of charities (27%) report having a policy to apply software updates within 14 days, which is noted as an appropriate timeframe for patching in the 10 Steps guidance on secure configurations.
- The use of Virtual Private Networks (VPNs) is relatively uncommon across both businesses (34%) and charities (20%), although this might be expected to rise over time as organisations become more accustomed to remote working. This is more common among larger organisations (74% of medium businesses and 83% of large businesses) and charities with very high incomes (72% of those with £5 million or more).
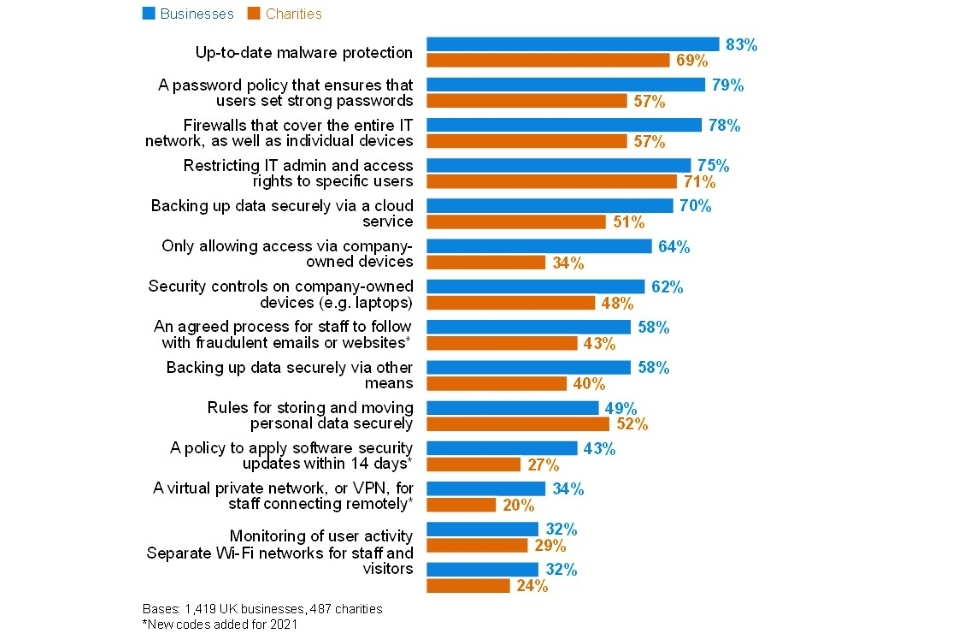
Figure 4.5: Percentage of organisations that have the following rules or controls in place
Businesses in three sectors stand out as being among the least likely to have many of these rules or controls in place:
- the food and hospitality sector
- the construction sector
- entertainment, services and membership organisations.
The first two of these are also less likely to have senior management teams who consider cyber security as a priority (as discussed in Chapter 3). As an illustration, food and hospitality firms are less likely than others to report having up-to-date malware protection (71%, vs. 83% overall) or network firewalls in place (66%, vs. 78% overall). Construction firms are less likely to have restricted IT access (61%, vs. 75% overall) or to have an agreed process around phishing attacks (39%, vs. 58% overall). Businesses in the entertainment, services and membership sector are also less likely to have updated malware protection (73%) or network firewalls (61%).
Trend over time
Where it is possible to track changes over time in previous years (i.e. where the response wording has stayed the same), this year has seen drops in various areas for both businesses and charities. Each of the following are less prevalent than in the 2020 survey:
- up-to-date malware protection (down 5 percentage points for businesses and 9 points for charities)
- network firewalls (down 5 points for businesses and 15 points for charities)
- restricting IT access (down 5 points for businesses and 11 points for charities)
- only allowing access via the organisation’s devices (down 5 points for businesses and 8 points for charities)
- rules around personal data storage and transfer (down 8 points for businesses and 14 points for charities)
- user monitoring (down 6 points for businesses and 9 points for charities).
These changes are in contrast to the relative stability of these scores for businesses in previous years of the survey, and the steady improvements seen among charities in many areas. The qualitative research suggests that they are linked to the upheaval caused by the COVID-19 pandemic. As more organisations have pivoted to allow home working, the feedback from the qualitative strand suggests that this has made it harder for organisations to centrally implement and manage technical controls covering all their users.
Where the proportions have fallen for each of these technical controls, these falls have most typically been among micro businesses and low-income charities. However, when it comes to user monitoring and the rules around personal data, the pattern of the data suggests that these particular rules and controls have become less common across the board.
4.4 Staff training and awareness raising
This survey does not explore cyber security skills and training in detail, given that there is another annual DCMS study dealing with this topic – the UK cyber security labour market series – the latest of which is the 2021 Cyber Security Labour Market Report. Nevertheless, this year, we have recorded the proportion of organisations that have undertaken training or awareness raising activities around cyber security in the past year, as this is an important aspect of the 10 Steps to Cyber Security guidance.
Our results (Figure 4.6) are very closely matched to the DCMS labour market study, although we record slightly higher proportions offering staff training in this area (it was 10% of businesses and 12% of charities doing so in the labour market study).
Both the labour market study and this Cyber Security Breaches Survey find this sort of training to be more commonplace in larger organisations. Among charities, high-income charities as a whole are more closely matched with medium businesses – around a third (35% of those with £500,000 or more) offer training.
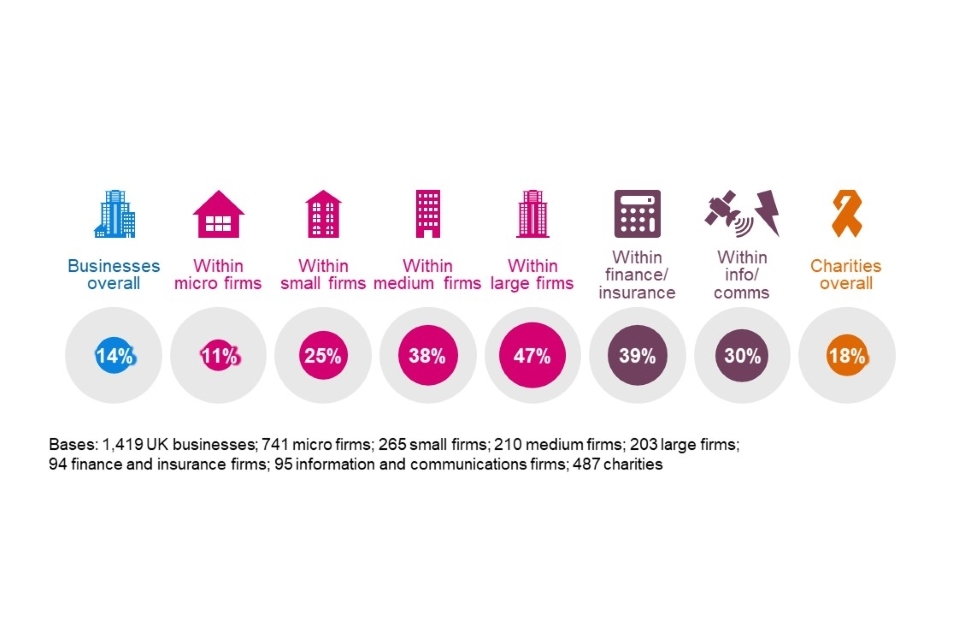
Figure 4.6: Percentage of organisations that have had training or awareness raising sessions on cyber security in the last 12 months
Finance and insurance businesses, and information and communications businesses are most likely to offer such training to staff. The sectors where training is very uncommon include entertainment, service and membership organisations (4%), construction (5%), utilities and production (6%) and retail and wholesale (9%). These are sectors where it is perhaps less commonplace for staff in manual occupations to use company devices (e.g. laptops), but this question indicates that the overwhelming majority of businesses in these sectors are not offering cyber security training to any of their staff.
4.5 Responsibility for cyber security
For the first time this year, we recorded the job titles of the survey respondents, who were identified as being most responsible for cyber security within their organisations. This provides an insight as to the likely seniority and influence of these individuals.
However, we suggest caution when interpreting these results – they do not necessarily show the definitive proportion of organisations that have a Chief Information Officer (CIO) or Chief Information Security Officer (CISO), for example. In these organisations, we may have been directed to another senior individual with more day-to-day responsibility for cyber security, such as a senior IT colleague.
- In micro and small businesses, as might be expected, it is most likely to be the business owner (16%), Chief Executive (26%) or another director outside of IT (29%) that takes on this responsibility. Just one in ten of these businesses (10%) have someone specifically in an IT role taking on the cyber security function.
- In medium and large businesses, having this function within the IT department is more common. This is, broadly, equally split between senior IT roles such as IT Directors (21% mention this or an equivalent role) and non-senior IT roles (25%). In a third of cases (34%), someone else from the board of directors, such as the Chief Executive, Chief Finance Officer or Chief Operations Officer.
- The pattern of results, and differences by size, is relatively similar across charities. In a third of cases (33%), a trustee performs this function, although this drops to just four per cent among high-income charities (with £500,000 or more).
4.6 Outsourcing of cyber security functions
Around four in ten businesses (38%) and around three in ten charities (28%) have an external cyber security provider. As Figure 4.7 shows, outsourcing of cyber security tends to increase substantially among non-micro businesses. The same is true for high-income charities, with two-thirds (66% of those with £500,000 or more) saying they outsource.
In other words, it is micro businesses and low-income charities that are least likely to be getting any external support with their cyber security.
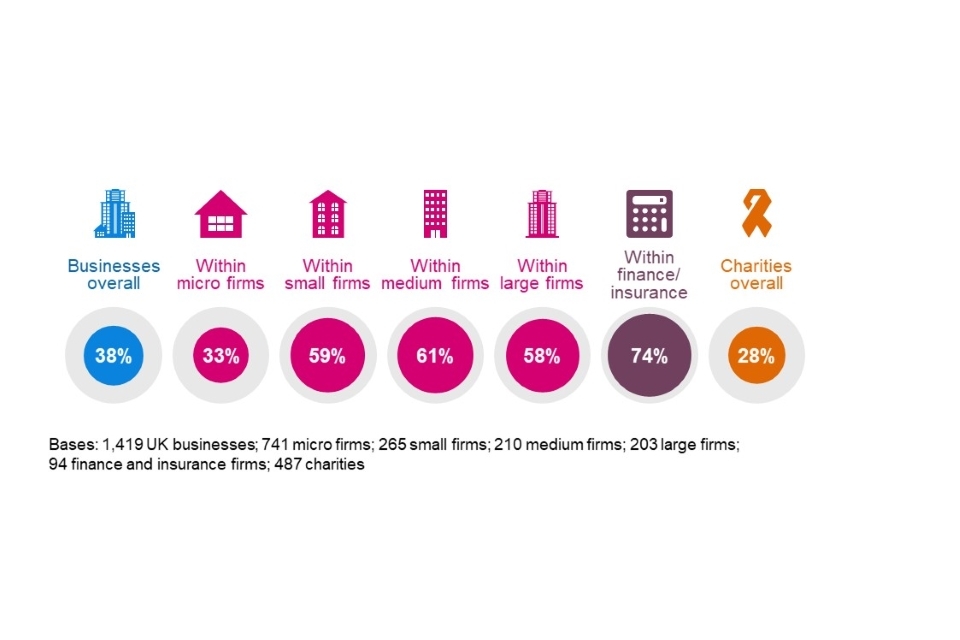
Figure 4.7: Percentage of organisations that have an external cyber security provider
The overall proportions for businesses and charities are consistent with last year.
4.7 Cyber security policies and other documentation
Do organisations formally document their approaches?
The survey has for several years asked whether organisations have cyber security policies in place. From 2018 to 2020, this increased from 27 per cent to 38 per cent across businesses, with a similar increase for charities. However, this year, the result has reverted closer to the levels seen in 2019, for both businesses and charities, with the shifts primarily being among micro and small businesses, and low-income charities. The 2021 results are in Figure 4.8.
The closeness to the 2019 results may indicate that last year’s results were outliers in the long-term trend. And for both businesses and charities, these results remain significantly higher than in 2018 (when 27% of businesses and 21% of charities reported that they had policies). However, the results could also suggest a weakening of overall governance approaches. This interpretation matches our qualitative evidence, which suggests that some organisations have overlooked proactive cyber security planning when focusing, in the short term, on other aspects of business continuity and flexibility during the COVID-19 pandemic. Our qualitative findings at the end of this chapter explore this in more depth.
In previous years, we have asked about the existence of business continuity plans, but this year’s survey strengthens this question to specifically ask about plans that cover cyber security. This is particularly important in the context of COVID-19 and the need for businesses to react quickly to changes in work patterns. Around three in ten businesses and charities have such plans, as Figure 4.8 shows. Among medium and large businesses, around three in ten do not have these kinds of plans in place. A third (34%) of high-income charities also do not have a business continuity plan that explicitly covers cyber security.
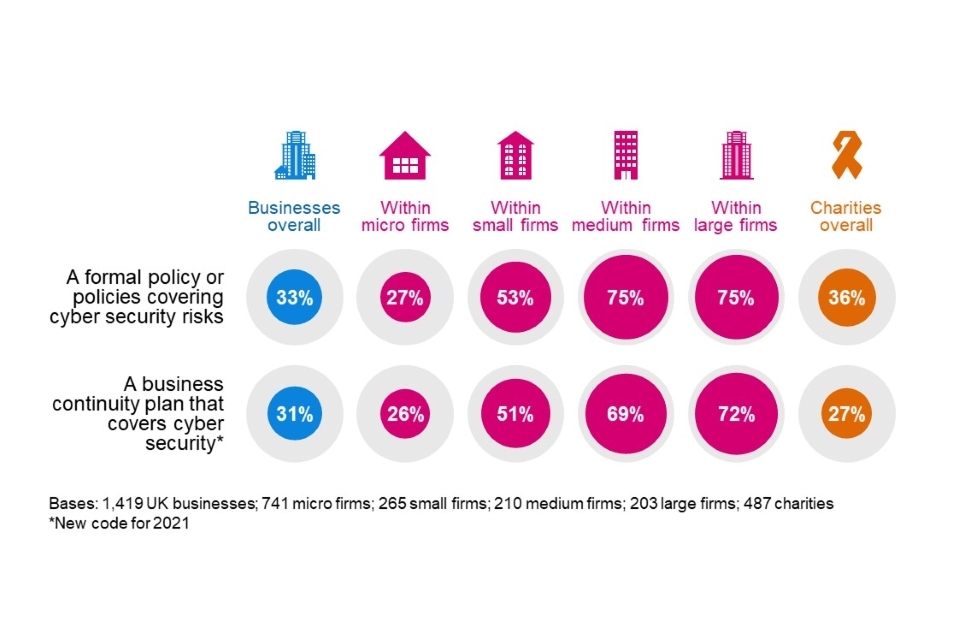
Figure 4.8: Percentage of organisations that have the following kinds of documentation
The finance and insurance sector far outpaces other sectors in terms of this documentation. Three-quarters (76%) have business continuity plans covering cyber security risks, and seven in ten (69%) have cyber security policies. The next best sectors in each case are the information and communications sector (55% have business continuity plans of this kind) and the health, social care and social work sector (65% have policies).
When were policies last reviewed?
Of the 33 per cent of businesses and 36 per cent of charities that have cyber security policies in place, four in ten (42% and 40% respectively) reviewed these policies within the last six months (Figure 4.9).
For businesses, these findings are down from the previous (pre-pandemic) year, where 52 per cent had reviewed policies or documentation. This lends evidence to the idea that documentation has not been as much of a priority under the COVID-19 pandemic.
When looking at the proportions undertaking a review of policies at least annually, the picture is more in line with the previous survey, with a clear majority of both businesses (82%) and charities (76%) having done so.
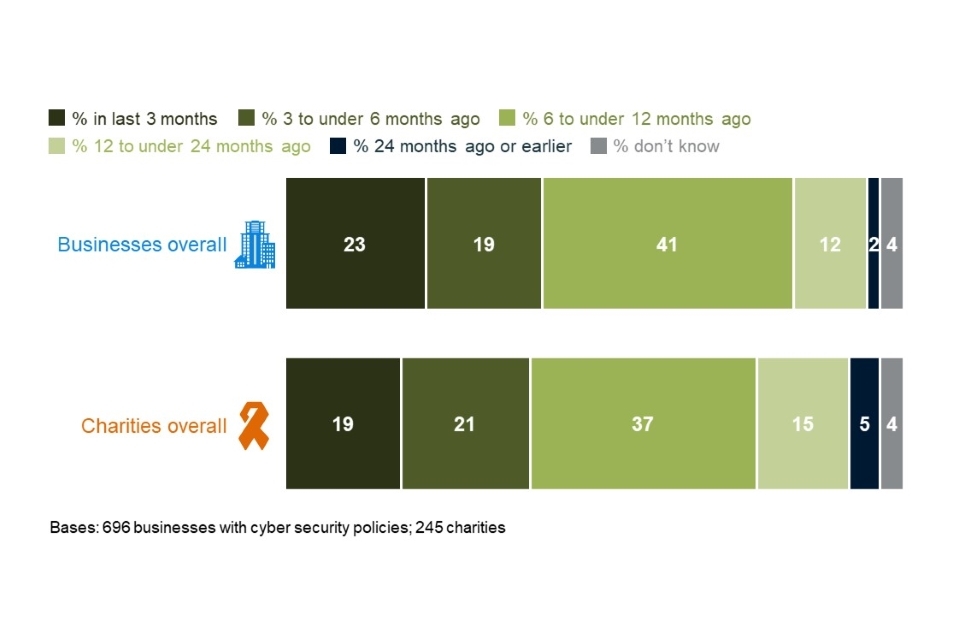
Figure 4.9: When organisations last created, updated or reviewed their cyber security policies or documentation
What is covered in cyber security policies?
Where they have policies, organisations tend to cover various aspects of cyber security within them. The most common themes to be captured are data storage, appropriate use of IT and remote working (Figure 4.10).
This year, for the first time, we asked about network-connected (i.e. smart) devices and the use of Software as a Service (SaaS). The former tends to be covered in around six in ten cases (63% of businesses and 62% of charities), whereas the latter is much less common (36% and 39% respectively). Medium (56%) and large businesses (63%) are more likely to cover SaaS in their cyber security policies.
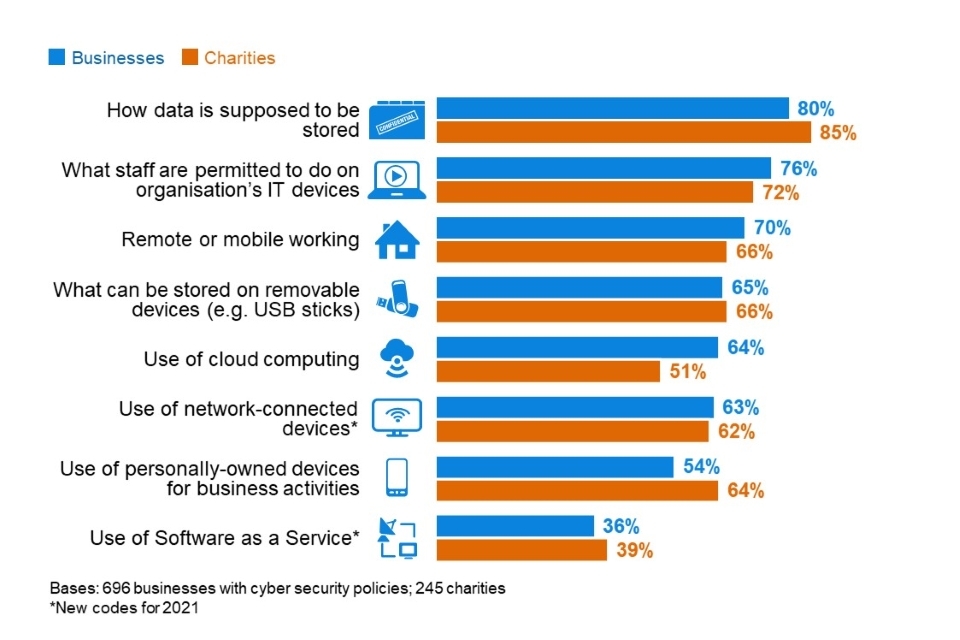
Figure 4.10: Percentage of organisations that have each of the following features in their cyber security policies
Remote working has become far more prevalent during the COVID-19 pandemic. However, the extent to which this aspect features in organisations’ cyber security policies has not notably changed between the 2020 (pre-pandemic) and 2021 surveys. The proportions discussing the use of personal devices in policies has also not significantly changed since last year.
Cloud computing continues to be increasingly covered in cyber security policies – this was at 52 per cent in 2016, up to 60 per cent in 2020, and is up to 64 per cent this year.
4.8 Cyber accreditations and government initiatives
This section looks at both government and external cyber accreditations and initiatives. It looks at which organisations adhere to specific accreditations. It then combines some of the individual results covered earlier in this chapter, to provide estimates showing how many businesses and charities are fulfilling the range of requirements laid out in two government initiatives: Cyber Essentials and the 10 Steps to Cyber Security.
Cyber Essentials
The government-endorsed Cyber Essentials scheme enables organisations to be independently certified for having met a good-practice standard in cyber security. Specifically, it requires them to enact basic technical controls across five areas:
- boundary firewalls and internet gateways
- secure configurations
- user access controls
- malware protection
- patch management (i.e. applying software updates).
Chapter 3 highlighted that there is an overall low awareness of Cyber Essentials among both the business (14%) and charity (10%) populations. Nevertheless, a higher proportion of organisations do have technical controls in these five areas.
Our survey maps the five areas to individual questions, covered earlier in this chapter (Figure 4.5). In total, 29 per cent of businesses and 20 per cent of charities report having technical controls in all five areas[footnote 6]. As might be expected, this is considerably higher for medium businesses (54%) and large businesses (60%). The charities with very high incomes are closest to large businesses (62% of those with incomes of £5 million or more have all these controls).
These figures are not comparable to previous years, given the significant wording changes at the patch management question. However, as discussed in Section 4.3, fewer organisations this year are applying technical controls around network firewalls, user access controls and malware protection, so more of them may be overlooking the basic Cyber Essentials areas.
In a separate question, we also asked organisations for the first time this year if they recognise adhering to either the Cyber Essentials or Cyber Essentials Plus standards. Both ask organisations to implement cyber security measures in the same areas, but the latter includes an external technical assessment. Only a small minority of businesses (4%) and charities (4%) report adhering to Cyber Essentials and just one per cent in each case say they have the Cyber Essentials Plus standard. Among large businesses, this rises to 29 per cent for Cyber Essentials and nine per cent for Cyber Essentials Plus.
This highlights that, across organisations of all sizes, there are many organisations that may have a relatively straightforward path towards Cyber Essentials certification, but have not pursued this yet. The qualitative findings at the end of this section highlight the numerous benefits that organisations see in this scheme, both in terms of providing reassurance to board members and customers, and spurring organisations to maintain cyber security standards.
Other accreditations
For the first time this year, we also asked organisations if they adhere to any of the following standards or accreditations:
- ISO 27001 – an international standard for an Information Security Management System
- The Payment Card Industry Data Security Standard (PCI DSS)
- Any National Institute of Standards and Technology (NIST) standards
Of these, the PCI DSS standard is the most widespread, with three in ten businesses (28%) adhering to this, rising to four in ten large businesses (42%). A quarter of large businesses (24%) adhere to ISO 27001. However, outside the large business population, it is very uncommon for organisations to adhere to any external standards – even charities with very high incomes tend to be behind large businesses in this regard (e.g. just 16% adhere to ISO 27001). The full list is in Figure 4.11.
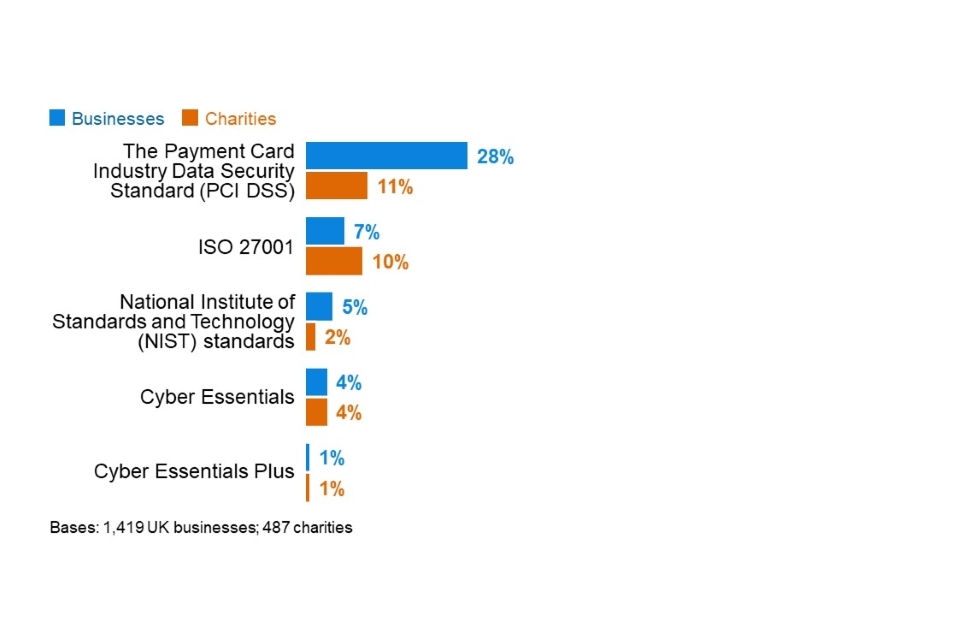
Figure 4.11: Percentage of organisations adhering to various cyber security standards or accreditations
There are some notable differences across different sectors:
- Food and hospitality businesses (54%) and retail and wholesale businesses (50%) are more likely than average (28%) to adhere to PCI DSS, reflecting the higher propensity to take online payments in these sectors (as noted in Chapter 2).
- Health, social care and social work businesses (19%), and finance and insurance businesses (16%) are more likely than average (7%) to adhere to ISO 27001.
- Finance and insurance businesses are also more likely to say they adhere to any NIST standards (10%, vs. 5% overall).
10 Steps to Cyber Security
The government’s 10 Steps to Cyber Security guidance sets out a comprehensive risk management regime that both businesses and charities can follow to improve their cyber security standards. It is not, however, an expectation that organisations fully apply all the 10 Steps – this will depend on each organisation’s ways of working.
These steps have been mapped to several specific questions in the survey (in Table 4.1), bringing together findings that have been individually covered across the rest of this chapter. This is not a perfect mapping – many of the steps are overlapping and require organisations to undertake action in the same areas – but it gives an indication of whether organisations have taken relevant actions on each step.
As previously noted, there have been reductions this year in the proportion of organisations implementing various risk management measures and technical controls.
Table 4.1: Percentage of organisations undertaking action in each of the 10 Steps areas
| Step description - and how derived from the survey | Businesses | Charities | |
|---|---|---|---|
| 1 | Information risk management regime – have formal cyber security policies and the board are kept updated on actions taken | 30% (vs. 35% in 2020) | 33% |
| 2 | Secure configuration – organisation has a policy to apply software updates within 14 days (definition changed in 2021) | 43% | 27% |
| 3 | Network security – network firewalls | 78% (vs. 83% in 2020) | 57% (vs. 72% in 2020) |
| 4 | Managing user privileges – restricting IT admin and access rights to specific users | 75% (vs. 80% in 2020) | 71% (vs. 82% in 2020) |
| 5 | User education and awareness – have formal policy covering what staff are permitted to do on the organisation’s IT devices and carry out cyber security training for staff (definition changed in 2021) | 9% | 11% |
| 6 | Incident management | 64% | 59% (vs. 73% in 2020) |
| 7 | Malware protection – up-to-date malware protection | 83% (vs. 88% in 2020) | 69% (vs. 78% in 2020) |
| 8 | Monitoring – monitoring user activity or using security monitoring tools | 49% (vs. 57% in 2020) | 42% |
| 9 | Removable media controls – have formal policy covering what can be stored on removable devices | 21% | 24% |
| 10 | Home and mobile working – have formal policy covering remote or mobile working | 23% | 24% |
Half of businesses (50%) and under half of charities (45%) have taken action on five or more of the 10 Steps as Figure 4.14 shows. Fewer than one in ten businesses and charities (4% in each case) have undertaken action on all 10 Steps. Large businesses are the most likely to have implemented all 10 Steps (25%). The scores in this year’s report are lower, but this is primarily because of the more stringent definition for Step 5, which now includes staff training (which is relatively uncommon and especially rare in smaller organisations).
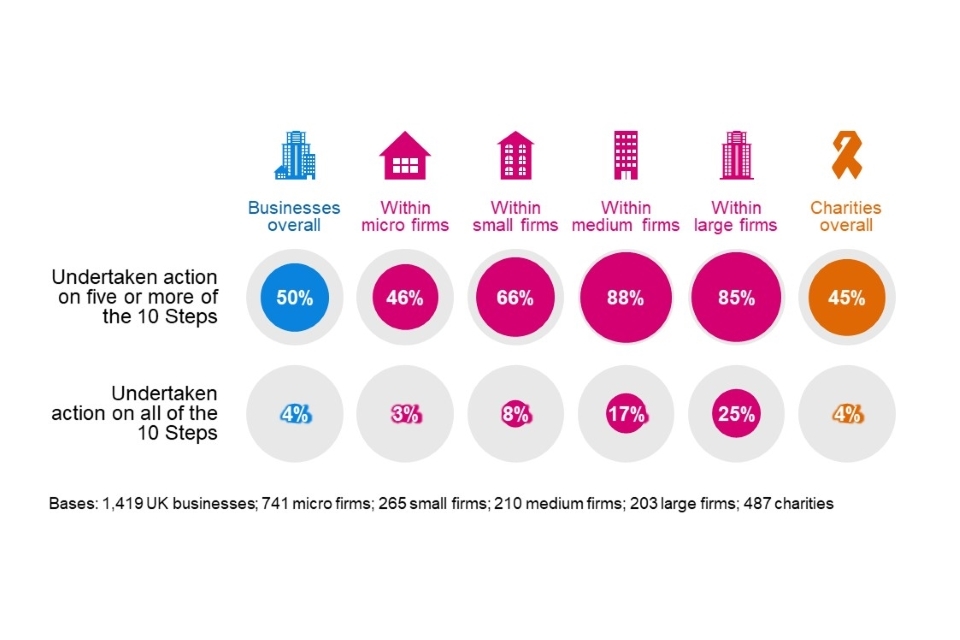
Figure 4.12: Percentage of organisations that have undertaken action in half or all the 10 Steps guidance areas
Qualitative insights on cyber security accreditations
The qualitative research highlighted the various motivations that organisations have for seeking external cyber security accreditations:
- For some organisations, it was mainly about reassuring themselves internally that they were following best practice. This was also considered a relatively straightforward way of reassuring management boards without having to provide technical details.
“Knowing we are PCI compliant and pass assessments – it adds a layer of internal trust in what we’re doing as a technical department.” - Medium business
- In other cases, the main motivation was to increase trust among clients and provide them with quality assurance. Accreditations were felt to be an external signal that organisations took cyber security seriously and could also signal that they are industry leaders.
- There were cases where it was helpful or even essential for contractual purposes to have accreditations. Some clients, for example, public sector clients, insisted on contractors having Cyber Essentials. One medium construction business had the Cyber Essentials Plus accreditation and was looking to acquire ISO 27001, because it would cut down the administrative and technical data that they had to provide in tenders with Housing Associations. This was expected to save time and money when bidding for new work.
- In the specific case of PCI DSS, one interviewee noted that they received a lower card transaction fee if they complied with the standard. Therefore, it made financial sense to become accredited. On the flipside, this accreditation was viewed as less cyber-specific – some organisations did not feel it led to any changes in their approach to cyber security.
Across interviews, there was a general sense that ISO 27001 was an especially comprehensive accreditation, since it involved being audited. On the other hand, some felt that this was less appropriate for smaller organisations, because it was too onerous or restrictive. Cyber Essentials was seen more as being about getting the basics right.
Having cyber security accreditations like these was considered to have various impacts. One higher education institution said that they had carried out penetration testing as part of the process to become Cyber Essentials-accredited. This had revealed vulnerabilities with their server and website which were then patched. A couple of organisations noted that accreditations can help raise standards across the organisation, in different teams and departments, as there needs to be evidence that everyone is complying.
Another university noted that there was a ratchet effect – once organisations have the standard, they are unlikely to want to lose it, meaning they work to maintain it.
4.9 Dealing with COVID-19
As a reminder, the survey findings covered across this chapter suggest that many organisations are not necessarily set up in the most secure manner for home working, which has increased drastically since the start of the COVID-19 pandemic.
- A third of businesses (34%) and a fifth of charities (20%) have a VPN. This is higher among medium businesses (74%) and large businesses (83%). High-income charities are behind the larger business population (56% of those with £500,000 or more have one).
- A third of businesses (32%) and three in ten charities (29%) monitor user activity on their networks. This rises for medium businesses (68%) and large businesses (72%). Again, high-income charities are behind the larger business population in this regard (56%).
- Three in ten businesses (31%) and slightly fewer charities (27%) have a business continuity plan that covers cyber security. This is much more prevalent among medium firms (69%), large firms (72%) and high-income charities (66%).
- A quarter of businesses and charities (23% of each) have cyber security policies that cover home working. This rises among medium businesses (62%), large businesses (72%) and high-income charities (60%).
- A fifth of businesses (18%) and a quarter of charities (23%) have such policies that cover the use of personal devices for work. Just half of medium businesses (53%), two-thirds of large businesses (66%) and half of high-income charities (48%) have these.
The qualitative interviews also explored how the pandemic affected organisations’ approaches to cyber security. Across the board, it had led to significant changes in ways of working. This included home working, video conferencing, moves from paper to digital filing and record keeping, and in some cases increased use of social media, for example for marketing or recruitment. This required swift changes in digital infrastructure, such as issuing laptops or tablets to staff, setting up VPNs or expanding existing VPN capacity, using cloud servers and approving new software (e.g. home learning software for education institutions).
Alongside these changes, many organisations adopted new security solutions, including cloud security and multi-factor authentication, or new rules requiring VPN connections to access files. Some changes, particularly around moves to the cloud and multi-factor authentication, had been planned ahead of the pandemic, but were greatly accelerated as a result of it.
The driving force behind all these changes was typically business continuity – allowing staff to keep working – rather than cyber security. Nevertheless, in some organisations, senior managers’ singular focus on service continuity at the start of the first UK lockdown had allowed cyber leads to secure increased investment in IT and cyber security.
Some organisations adopted new policies or updated existing ones to cover the use of video conferencing, or how to store data when working remotely. However, the survey shows that this updating of documentation is not as common as in previous years (see Section 4.7).
Moreover, some organisations, typically smaller ones, said they had not felt it necessary to make any changes to cyber security in response to the pandemic, because they did not see any increased risk. Across the organisations that had access to external IT support, it was often the case that they relied on this support to guide them on any changes needed. In one example, an interviewee from one small global procurement business said that, despite staff now working from home, they had not made any changes to IT or cyber security since their IT was dealt with by an external company and none of their staff had raised any issues since March 2020.
“We rely heavily on our IT supplier, who we have an annual contract with. … to ensure the firewalls and protections are up to date and in place. They tell us when things need updating. When all the software was upgraded, the IT supplier was responsible for that.” - Small business
Among the organisations that had made changes, we found three sets of challenges relating to cyber security under COVID-19:
- Direct user monitoring was much harder where staff were working remotely. This potentially delayed organisations from catching and dealing with cyber attacks. Some interviewees noted that, in this context, it was increasingly important for staff to be vigilant and to adhere to the organisation’s cyber security policies. However, they said that it was impossible to know if staff were following procedures at home. One mentioned the difficulties of carrying out cyber security training remotely (echoing findings from separate 2021 research on cyber security skills for DCMS). Another noted that the licencing cost of remote user monitoring software was too high for them to install it for all staff.
“We could miss an email that is dodgy … It’s harder because people aren’t in the office. We’ve let it slip. We don’t have the resource to remind them. We had one where someone was impersonating the Managing Director.” - Small business
- Dealing with hardware and software changes and upgrades was more difficult, particularly for large organisations. With staff working at home, there were more endpoints to keep track of. Supplying and retrieving hardware (e.g. new laptops) to staff was an issue for two of the higher education institutions we interviewed. Another large organisation mentioned around 70 of their staff using laptops with Windows 7, which they had not been able to retrieve and upgrade as a result of the pandemic.
- The pandemic had stretched resources and led to competing priorities. In some cases, there was a perceived conflict between prioritising IT service continuity and maintenance work, and aspects of cyber security such as patching. A lack of time and personnel also made it harder to carry out cyber security training and awareness raising. While the resource bottlenecks had eased in some cases over the course of the pandemic, business continuity was typically considered to be the ongoing top priority for senior management. Alongside this, there was sometimes a lack of acknowledgement that cyber security could itself be a key enabler of business continuity.
“There has been a shortage of operational IT people who can help … We don’t have a big team, but we’ve had to increase it by a third from two to three, and we’re buying in consultancy support. We had nothing like this before – we might have had it for an individual application, a new finance system or something like that, but nothing like this.” - Charity
Chapter 5: Incidence and impact of breaches or attacks
This chapter explores the nature, extent and impact of cyber attacks and other cyber security breaches on organisations over the past year. We also provide broad estimates of the financial cost of these breaches and attacks.
Across these findings, the survey aims to account for all the types of breaches or attacks that organisations might face. This includes accidental breaches, as well as ones perpetrated intentionally. It also includes recorded cyber attacks that did not necessarily get past an organisation’s defences (but attempted to do so). We do, nevertheless, isolate and discuss the cases that had a material outcome, such as a loss of money, assets or other data.
It is important to remember that the survey can only measure the breaches or attacks that organisations have themselves identified. There are likely to be hidden attacks, and others that go unidentified, so the findings reported here may underestimate the full extent of the problem. This year, this issue may have been exacerbated by the COVID-19 pandemic, which has potentially reduced the oversight that organisations have over their staff and devices – this is something we expand on in section 5.1.
Note on comparability to previous years
The findings across this chapter are not comparable with those from the 2016 survey, due to significant changes in the types of breaches or attacks being recorded from 2017 onwards.
In addition, this year we substantially changed the way we capture the cost of cyber security breaches within the survey, in order to get more accurate estimates. Therefore, we do not make direct comparisons to previous years, but do comment on the broad pattern of the data in relation to previous years. The changes are summarised in Section 5.5.
5.1 Identified breaches or attacks
Four in ten businesses (39%) and a quarter of charities (26%) report having any kind of cyber security breach or attack in the last 12 months (Figure 5.1). We calculate these percentages by merging together the proportions that identified any of the different types of breaches or attacks mentioned in the survey (listed in Figure 5.2).
Larger businesses are more likely to identify breaches or attacks than smaller ones – this has been a consistent pattern in each year of the survey. This year’s results show a particularly stark gap between micro and small firms on one hand, and medium and large ones on the other. Among charities, half of all high-income charities (51% of those with £500,000 or more) and seven in ten with very high incomes (68% of those with £5 million or more) record any breaches or attacks.
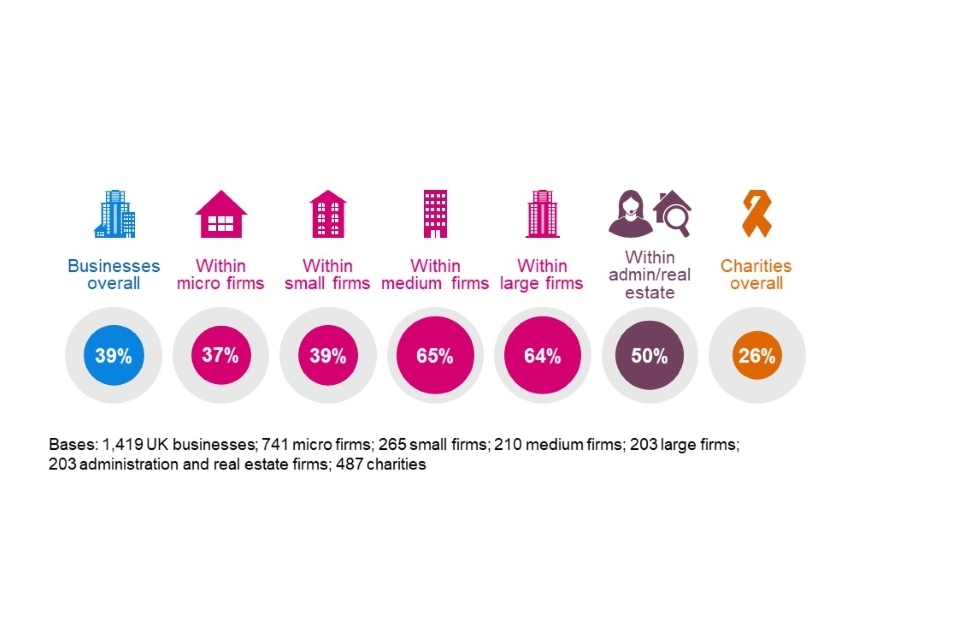
Figure 5.1: Percentage of organisations that have identified breaches or attacks in the last 12 months
Administration and real estate firms are more likely than average to have identified breaches or attacks, which was also the case last year.
In previous years, the information and communications sector has consistently stood out as more likely to identify breaches. This year’s figure is also higher for this sector (at 47%), but the difference is not statistically significant.
As in previous years, businesses that hold personal data are more likely than average to have reported breaches or attacks (43%, vs. 39% overall), and the same applies to charities (34%, vs. 26% overall). These findings highlight the importance of protecting this information.
Types of breaches or attacks identified
Figure 5.2 shows the types of breaches and attacks that organisations report having, among those that have identified any in the last 12 months. The most common by far is phishing – staff receiving fraudulent emails or being directed to fraudulent websites. This is followed, to a much lesser extent, by impersonation and then viruses or other malware.
One of the consistent lessons across this series of surveys has been the importance of staff vigilance, given that the vast majority of breaches and attacks being identified are ones that will come via staff members’ user accounts.
At the same time, among the organisations identifying any breaches or attacks, only half (48% of businesses and 51% of charities) say they have only experienced phishing attacks and no other kinds of breaches or attacks. In this sense, cyber security is generally not a one-dimensional issue for organisations.
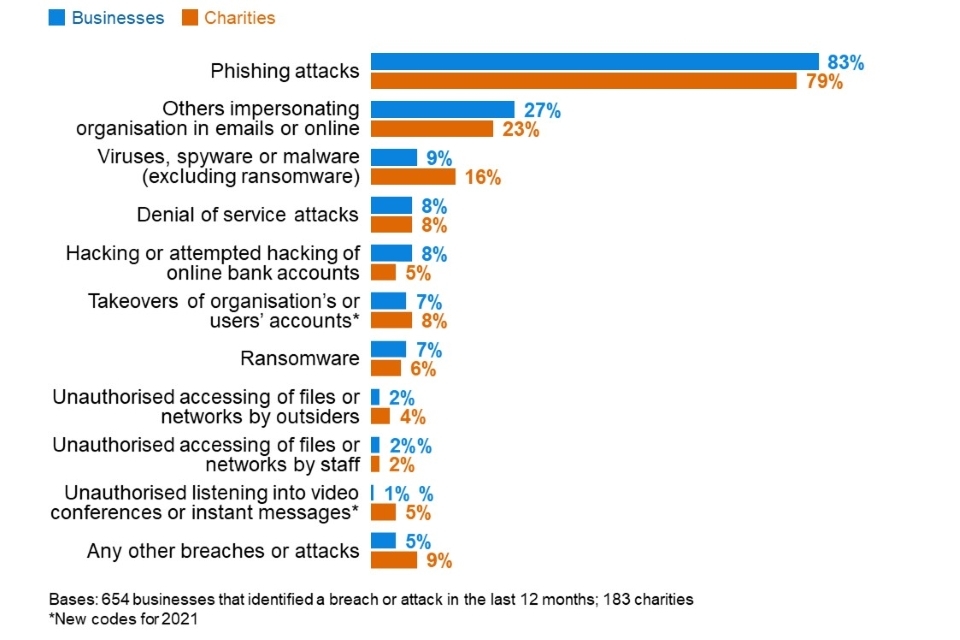
Figure 5.2: Percentage that have identified the following types of breaches or attacks in the last 12 months, among the organisations that have identified any breaches or attacks
This broad pattern is similar across size bands and sectors. However, large businesses that have identified any breaches or attacks are more likely to report a wider range of types. For example, they are more likely to pick three or more categories from Figure 5.2 (31%, vs. 13% of businesses overall). Specifically, they are more likely to report:
- phishing attacks (91% of large firms, vs. 83% overall)
- impersonation (63%, vs. 27% overall)
- unauthorised use of computers or networks by staff (15%, vs. 2% overall).
The top three types of attacks have remained consistent since 2017 (i.e. since the question was first asked in this form), in line with Figure 5.2. However, as noted in last year’s report, the pattern of responses is now very different from the 2017 survey, indicating an evolution of the types of breaches that organisations are facing – moving away from direct malware and more towards phishing. For example, among the businesses identifying any breaches or attacks, from 2017 to 2021 there has been:
- a rise in phishing attacks (from 72% to 83%)
- a fall in viruses or other malware (from 33% to 9%)
- a fall in ransomware (from 17% to 7%).
Trend over time
The proportion of businesses reporting any breaches or attacks has fallen since last year (from 46% to 39%). This fall is greatest among small businesses (down from 62% to 39%) and large businesses (down from 75% to 64%). The charities result is unchanged since 2020, including within the broad income subgroups.
The long-term trend is shown in Figure 5.3. The result for businesses has typically been slightly above four in ten since 2017, with 2019 and 2021 being exceptions. For charities, the 2021 result remains higher than in 2018, which may reflect the increased awareness of cyber security breaches following the introduction of the General Data Protection Regulation (GDPR), shortly after the 2018 survey.
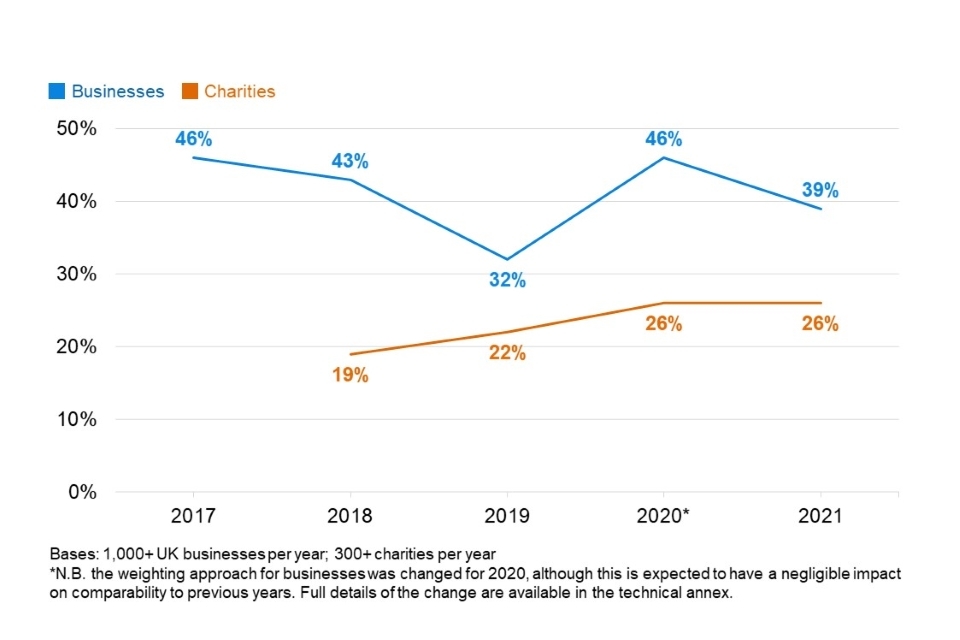
Figure 5.3: Percentage of organisations over time identifying any breaches or attacks
It is difficult to pinpoint a single reason for the change from 2020 to 2021. A range of possible factors and explanations must be considered, including the following:
- The other survey results do not indicate an increase in defensive behaviours. In fact, Chapter 4 highlights that, compared to 2020, fewer organisations are deploying various technical controls. Moreover, the qualitative findings from Chapter 4 suggest that organisations are commonly finding it harder to monitor their employees during the COVID-19 pandemic. Therefore, the fall in identified breaches possibly reflects that organisations are simply less aware of the breaches and attacks their staff are facing.
- There may have been a change in attacker behaviour, with cyber attacks becoming more focused on mid-sized organisations. However, the survey cannot directly evidence this, and the lack of equivalent shifts in the charity population makes it more doubtful. The qualitative findings covered in Chapter 3 show that organisations instead expect things like phishing to be a greater risk now than before, due to the high number of employees working from home during the pandemic.
- Another possible external factor is the reduced trading activity of many businesses during the COVID-19 pandemic. The Office for National Statistics has been conducting the fortnightly Business Impact of Coronavirus (COVID-19) Survey since March 2020. The 3 December 2020 release of the Business Impact of Coronavirus Survey, at roughly the midpoint of fieldwork for the Cyber Security Breaches Survey, shows that 77 per cent of businesses were trading and 47 per cent had experienced a decrease in turnover compared to normal expectations. This reduced activity may have inadvertently made some businesses temporarily less detectable to attackers this year and, therefore, less prone to cyber attacks.
- We made minor changes to clarify the wording of some of the answer options at Figure 5.2 this year. For example, we explicitly added the words “phishing attacks” to the respective option, while maintaining the previous wording alongside it. The proportion of businesses selecting that answer option has declined, but so have the proportions selecting other answer options that have not changed this year. Therefore, questionnaire changes are unlikely to fully explain any drop[footnote 7].
The fact that the charity results are stable also lacks a clear explanation. As Chapter 4 covers, fewer charities in 2021 are implementing various technical controls, including monitoring of users. However, it is important to note that charities have a longer history of allowing home working, and of staff using personal devices for work. As such, despite the drop in technical controls, their staff may have experienced less upheaval from the move to home working.
5.2 The breaches and attacks considered most disruptive
Among the organisations that report having had breaches or attacks in the past 12 months, phishing attacks are most commonly considered the most disruptive types of attack that organisations face (by 62% of these businesses and 65% of these charities). This is unsurprising, given that around half of these businesses and charities only recall experiencing phishing attacks and not any other kinds of cyber security breaches.
It is therefore worth looking specifically at the organisations that report any other breaches in addition to phishing attacks, and what these organisations consider to be the most disruptive types of breaches or attacks they have faced. Figure 5.4 shows that, even among this group, phishing attacks are still considered as being the most disruptive to the business, but this is closely followed by impersonation attacks. It also suggests that denial of service attacks have been more disruptive for charities than for businesses.
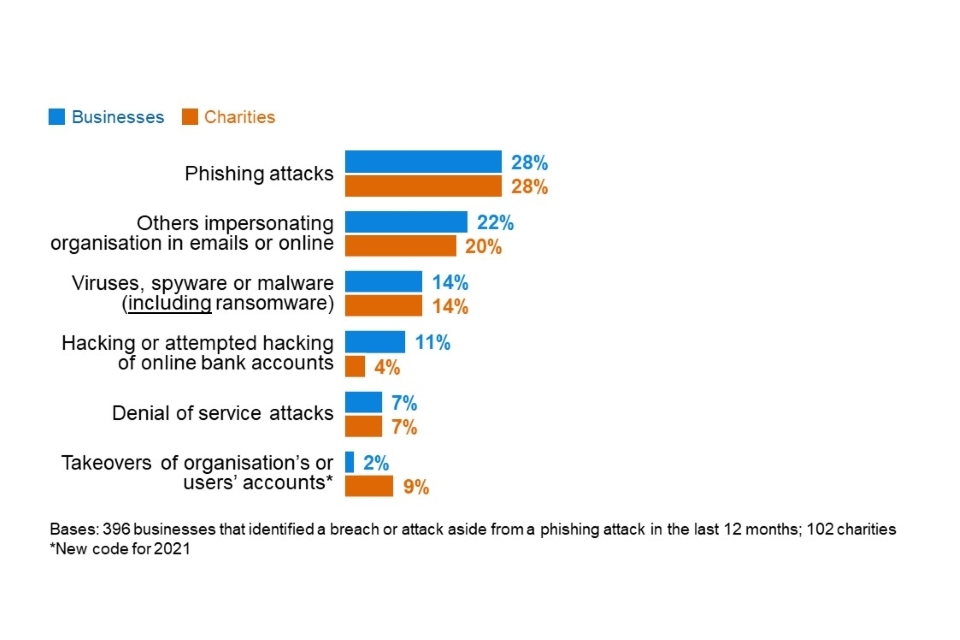
Figure 5.4: Percentage that report the following types of breaches or attacks as the most disruptive, excluding the organisations that have only identified phishing attacks in the last 12 months
5.3 Frequency of breaches or attacks
Among those identifying any breaches or attacks, half of businesses (49%) and almost half of charities (44%) say this happens once a month or more often. Around a quarter (27% of businesses and 23% of charities) say they experience breaches or attacks at least once a week. The overall pattern of the frequency, shown in Figure 5.5, is similar to 2020.
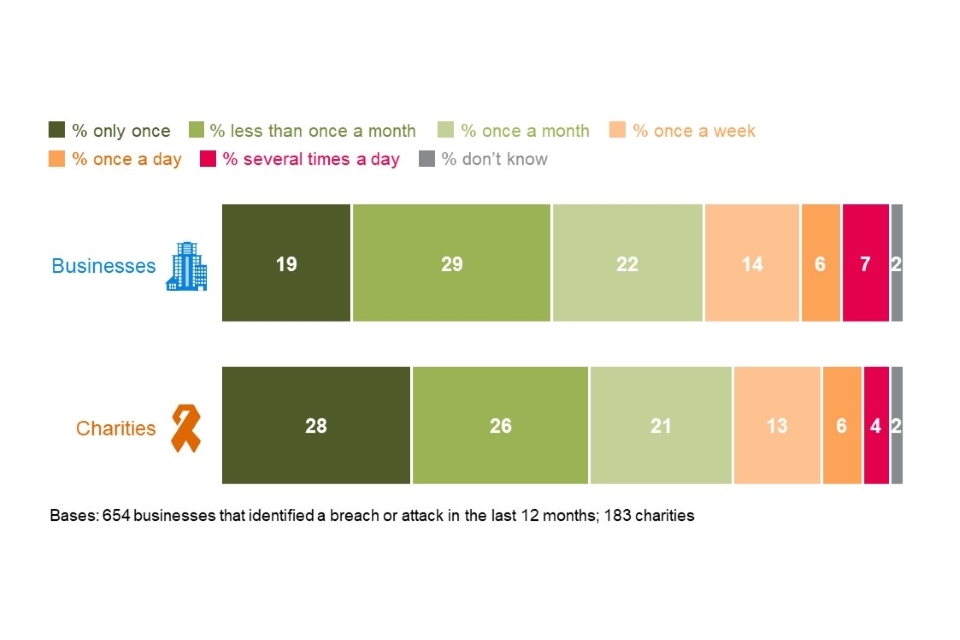
Figure 5.5: How often organisations have reported breaches or attacks in the last 12 months
Looking at the longer-term trend, it remains the case that fewer businesses and charities are reporting breaches or attacks as one-off events over the course of a year than before:
- In 2017, 37 per cent of the businesses identifying breaches or attacks could only recall one instance in the previous 12 months. This has fallen in each successive survey and is now at 19 per cent.
- There is a similar pattern over time for charities. In 2018 (when we first started surveying this group) 36 per cent said they only recalled experiencing a single breach over the year, compared with 28 per cent now.
5.4 How are businesses affected?
Outcomes of breaches or attacks
Not all breaches or attacks lead to a negative outcome, in terms of a loss of money or data. As Figure 5.6 illustrates, among the 39 per cent of businesses that identify breaches or attacks, one in five (21%) experience such an outcome. Among the 26 per cent of charities identifying breaches or attacks, a similar proportion (18%) have these kinds of outcomes.
Temporary loss of access to files or networks and disruption to websites, applications or online services are the most commonly reported outcomes – although, as Figure 5.6 indicates, organisations can experience a very wide array of outcomes.
A permanent loss of data is much less common, which might be expected given that 88 per cent of businesses and 68 per cent of charities back up their data in some way (see Chapter 4).
As in previous years, organisations that face non-phishing breaches or attacks, for example viruses or ransomware, account takeovers, hacking attempts or other unauthorised access, are much more likely than average to experience a negative outcome as a result (34% vs. 21% overall for businesses and 32% vs. 18% overall for charities). This means that while these kinds of breaches are rarer, the damage they can inflict on organisations is often more substantial. They still, therefore, represent a significant threat for all organisations to consider, alongside more common threats like phishing emails.
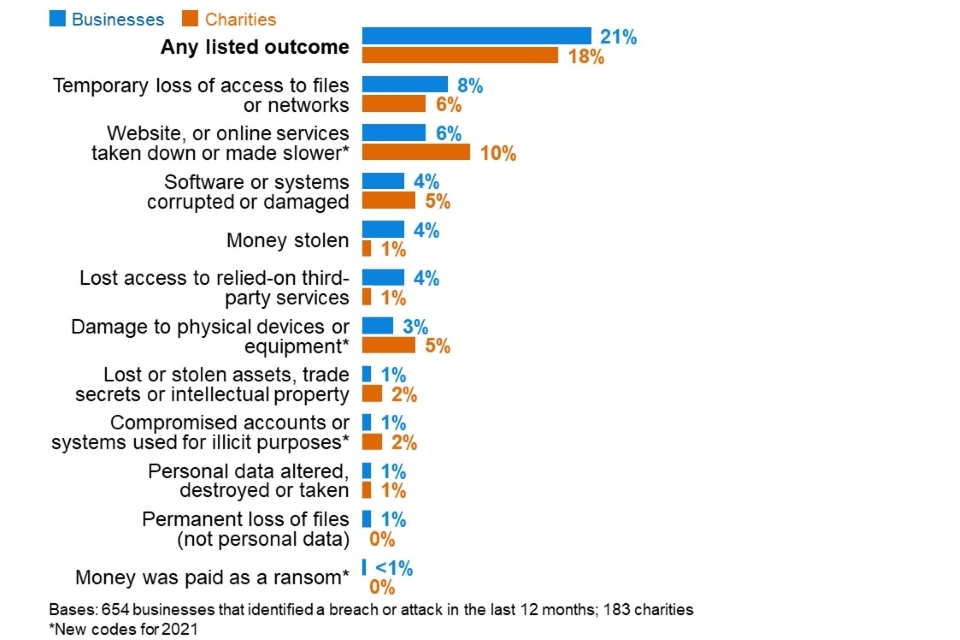
Figure 5.6: Percentage that had any of the following outcomes, among the organisations that have identified breaches or attacks in the last 12 months
These outcomes are all more prevalent among large businesses. Among those that have identified any breaches or attacks, 35 per cent of large businesses had some sort of negative outcome from these (vs. 21% overall).
Nature of the impact
Even breaches that do not result in negative financial consequences or data loss can still have an impact on organisations. One-third of businesses (35%) and four in ten charities (40%) that have had breaches or attacks report being impacted in one of the ways noted in Figure 5.7.
Most commonly, breaches or attacks lead to organisations having to take up new measures to prevent or protect against future cases, or staff resources being redirected to deal with the breach.
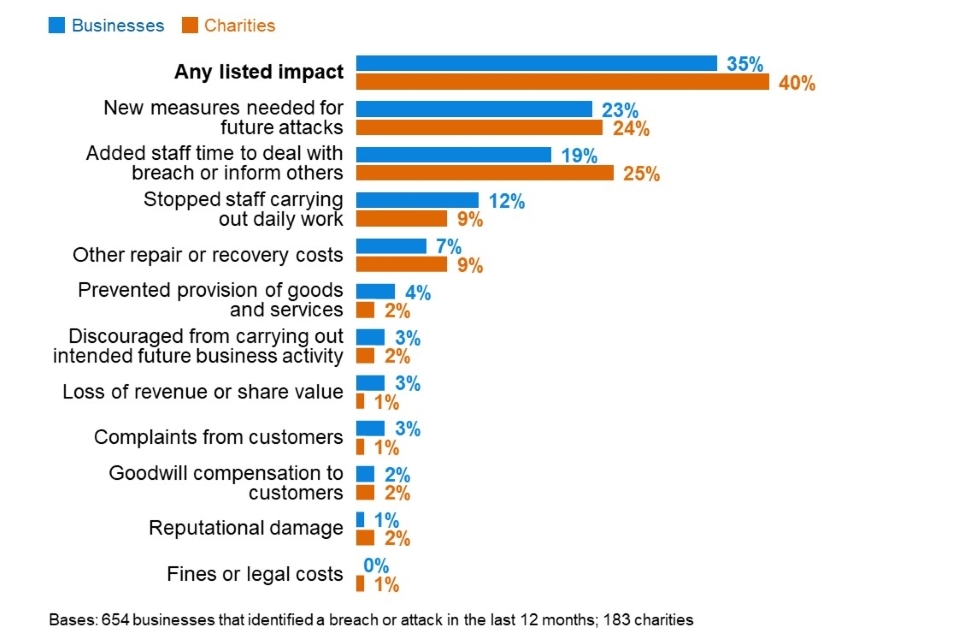
Figure 5.7: Percentage that were impacted in any of the following ways, among the organisations that have identified breaches or attacks in the last 12 months
As in previous years, the impact is most substantial for large businesses – for example, 43 per cent of large businesses say they have had to take up new measures to prevent or protect against future cases (vs. 23% of all businesses facing breaches or attacks) and 37% say they needed extra staff time to deal with breaches (vs. 19% overall).
Time taken to recover from the most disruptive breach or attack
The vast majority of businesses (89%) and charities (86%) restore operations from their most disruptive breach or attack within 24 hours. Furthermore, seven in ten businesses (71%) and charities (67%) say it took no time at all to recover, shown in Figure 5.8.
However, for businesses that report breaches or attacks with a material outcome (as discussed at the start of this section), the situation is different. In these cases, a third (34%) of businesses take a day or more to recover (vs. 10% of businesses having any kinds of breaches or attacks, including those without outcomes). There is a broadly similar pattern in the charities data, although the sample of charities that report breaches or outcomes is too small to report here.
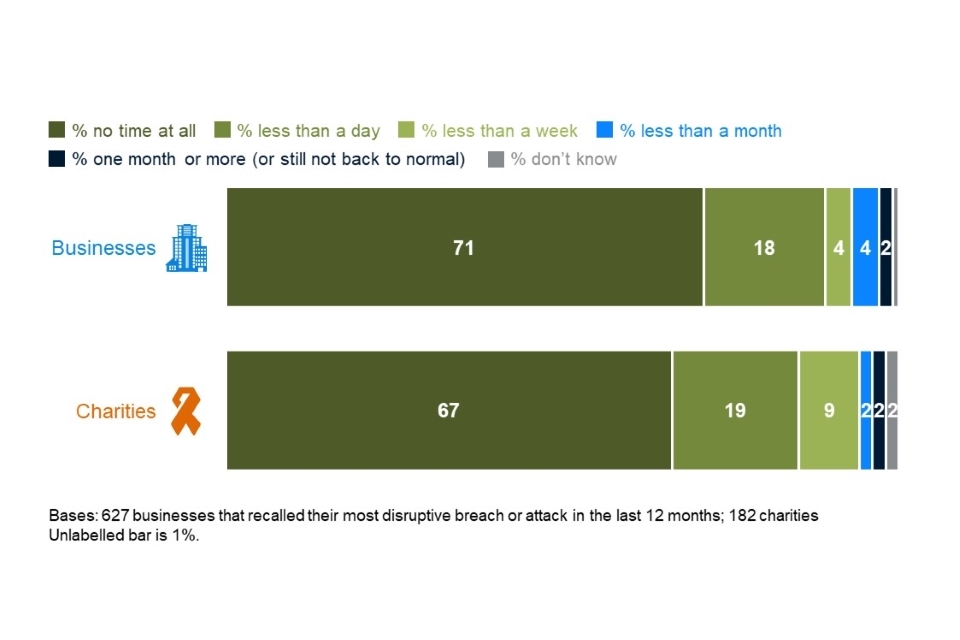
Figure 5.8: How long it took organisations to restore operations back to normal after their most disruptive breach or attack was identified
Changes over time
The 2020 report noted that resilience to cyber security breaches appeared to be increasing over time, based on the trends for outcomes, impacts and the time taken dealing with breaches or attacks. For businesses, this trend for outcomes and time taken to restore operations appears to have levelled off this year (Figure 5.9). This may reflect the qualitative findings – that organisations have focused more on immediate service continuity than on their proactive cyber security planning and defences in the wake of the COVID-19 pandemic, and have not necessarily perceived both these areas to be complementary.
There is still an overall downward trend for impacts, but the difference between the 2020 and 2021 results is not statistically significant. For consistency, the analysis in Figure 5.9 excludes the four new answer options added this year in terms of breach outcomes.
The trends in Figure 5.9 are not due to breaches or attacks becoming less frequent. As covered earlier in this chapter, there has been no notable change in frequency this year.
The survey cannot definitively say what has caused the shifts seen in the chart. Nevertheless, it could indicate that the average organisation’s cyber security defences have improved since 2017. This could, in part, be a legacy of GDPR – we noted in the 2019 Cyber Security Breaches Survey that more organisations started taking various basic steps to improve their cyber security following the introduction of GDPR (after the 2018 survey). It may also reflect other, pre-GDPR broad trends, such as the increasing move towards cloud storage and backups.
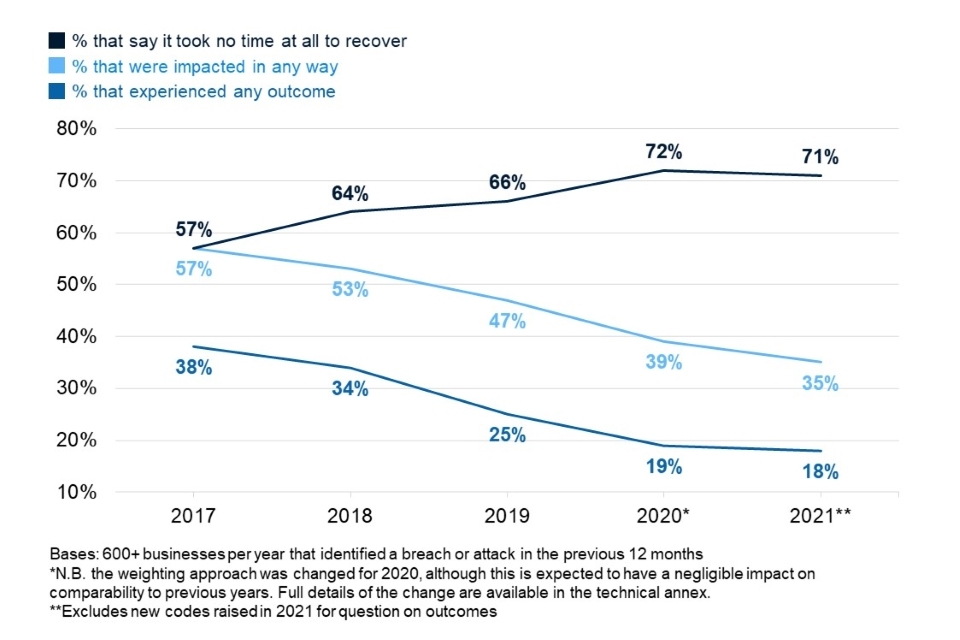
Figure 5.9: Percentage of businesses over time that have been affected by breaches or attacks in the following ways, among those that have identified any breaches or attacks in the last 12 months
Fewer charities this year report breaches or attacks impacting them (40%, vs. 56% in 2020) – and this is a statistically significant change, unlike businesses. Specifically, just 24 per cent this year say they needed new measures for future attacks, compared with 42 per cent in 2020. This takes the charity results closer to what they were in 2019.
5.5 Financial cost of breaches or attacks
Each year, this survey series has attempted to capture the cost of cyber security breaches or attacks on organisations. This includes an overarching question covering the cost of all breaches or attacks faced in the last 12 months, and more granular questions breaking down different aspects of the cost of the single most disruptive breach or attack that organisations recall facing in this period.
This year, we made significant changes to the wording and ordering of these questions in the survey, in order to improve the accuracy of the data. These improvements included:
- redesigning the granular cost questions to follow the cost mapping laid out in a separate 2020 DCMS research study on the full cost of cyber security breaches
- moving the order of the overarching cost question to be after these more granular ones
- allowing respondents to change or revalidate their responses (e.g. after further consultation with colleagues), in a follow-up online survey.
In previous years, while we aimed to be comprehensive in the costs we collected, the questions did not specifically split out direct costs (where there was a transfer of cash involved, like a ransom payment) and indirect costs (like the staff time cost). Some aspects of the cost data in previous years were also more speculative, for example covering long-term costs that might occur in the future. The new questions are more distinct and more refined. They avoid organisations making gross oversimplifications or inaccurate guesses with the more speculative aspects, or underestimating their costs by omitting a major cost category like staff time.
These changes are substantial, so we cannot make direct comparisons between this year’s data and previous years. We do, however, comment on the broad patterns of the data, for example the differences between smaller and larger businesses, as well as charities.
Overall cost of breaches or attacks
Table 5.1 shows the estimated costs organisations incurred from all the identified breaches or attacks over the past 12 months. When considering the cost, organisations are asked to bear in mind all the potential impacts mentioned in Figure 5.6.
When filtering down only to breaches with a material outcome, median costs tend to be higher.
Table 5.1: Average cost of all breaches or attacks identified in the last 12 months[footnote 9]
| All businesses | Micro/small businesses | Medium/large businesses | All charities | |
|---|---|---|---|---|
| Across organisations identifying any breaches or attacks | ||||
| Mean cost | £2,670 | £2,600 | £3,930 | £2,110 |
| Median cost | £0 | £0 | £96 | £0 |
| Base | 623 | 360 | 263 | 171 |
| Only across organisations identifying breaches with an outcome | ||||
| Mean cost | £8,460 | £8,170 | £13,400 | - |
| Median cost | £500 | £500 | £2,280 | - |
| Base | 143 | 74 | 69 | too few charities to analyse |
Costs associated with the most disruptive breaches
Tables 5.2 to 5.5 show cost estimates for the single most disruptive breach that organisations have identified in the last 12 months. Again, these are presented for all breaches, as well as those with an actual outcome, such as a loss of assets or data.
In the survey, we defined short-term direct costs as being any external payments that were made when the breach was being dealt with. This includes, as examples offered to respondents:
- any payments to external IT consultants or contractors to investigate or fix the problem
- any payments to the attackers, or money they stole.
Table 5.2: Average short-term direct cost of most disruptive breach or attack from the last 12 months
| All businesses | Micro/small businesses | Medium/large businesses | All charities | |
|---|---|---|---|---|
| Across organisations identifying any breaches or attacks | ||||
| Mean cost | £398 | £390 | £530 | £126 |
| Median cost | £0 | £0 | £0 | £0 |
| Base | 611 | 355 | 256 | 173 |
| Only across organisations identifying breaches with an outcome | ||||
| Mean cost | £1,740 | £1,740 | £1,870 | - |
| Median cost | £0 | £0 | £0 | - |
| Base | 143 | 74 | 69 | Too few charities to analyse |
We defined long-term direct costs as external payments in the aftermath of the breach incident. The examples included in the survey were:
- any payments to external IT consultants or contractors to run cyber security audits, risk assessments or training
- the cost of new or upgraded software or systems
- recruitment costs if you had to hire someone new
- any legal fees, insurance excess, fines, compensation or PR costs related to the incident.
Table 5.3: Average long-term direct cost of most disruptive breach or attack from the last 12 months
| All businesses | Micro/small businesses | Medium/large businesses | All charities | |
|---|---|---|---|---|
| Across organisations identifying any breaches or attacks | ||||
| Mean cost | £861 | £835 | £1,320 | £57 |
| Median cost | £0 | £0 | £0 | £0 |
| Base | 604 | 349 | 255 | 172 |
| Only across organisations identifying breaches with an outcome | ||||
| Mean cost | £4,010 | £3,960 | £4,780 | - |
| Median cost | £0 | £0 | £0 | - |
| Base | 141 | 72 | 69 | Too few charities to analyse |
We also asked about the costs of any staff time (i.e. indirect costs of the breach). This includes, for instance, how much staff would have got paid for the time they spent investigating or fixing any problems caused by the breach. We explicitly asked respondents to include the cost of this time regardless of whether this duty was part of the staff member’s job function or not.
Table 5.4: Average staff time cost of the most disruptive breach or attack from the last 12 months
| All businesses | Micro/small businesses | Medium/large businesses | All charities | |
|---|---|---|---|---|
| Across organisations identifying any breaches or attacks | ||||
| Mean cost | £740 | £758 | £416 | £756 |
| Median cost | £0 | £0 | £27 | £0 |
| Base | 624 | 360 | 264 | 178 |
| Only across organisations identifying breaches with an outcome | ||||
| Mean cost | £2,670 | £2,770 | £1,100 | - |
| Median cost | £100 | £100 | £268 | - |
| Base | 148 | 77 | 71 | Too few charities to analyse |
Finally, we asked about other indirect costs related to breaches, including the following areas (offered as examples to respondents):
- the cost of any time when staff could not do their jobs
- the value of lost files or intellectual property
- the cost of any devices or equipment that needed replacing.
Table 5.5: Average indirect cost of the most disruptive breach or attack from the last 12
months
| All businesses | Micro/small businesses | Medium/large businesses | All charities | |
|---|---|---|---|---|
| Across organisations identifying any breaches or attacks | ||||
| Mean cost | £654 | £638 | £926 | £44 |
| Median cost | £0 | £0 | £0 | £0 |
| Base | 609 | 350 | 259 | 172 |
| Only across organisations identifying breaches with an outcome | ||||
| Mean cost | £3,020 | £2,950 | £4,060 | - |
| Median cost | £0 | £0 | £0 | - |
| Base | 141 | 71 | 70 | Too few charities to analyse |
Commentary on the financial costs
The following key findings can be gleaned from these cost tables:
- The overall costs reported here (in Table 5.1) are considerably higher than those reported in previous years. We believe these figures to be more accurate than before. This highlights that cyber security breaches and attacks can do substantial financial damage, to smaller businesses as well as larger ones.
- The costs in the aftermath of a cyber security incident (Table 5.3) tend to end up being much higher than the immediate direct costs faced by the organisation (Table 5.2). Recency bias – the tendency to reflect more on recent events than older ones – may mean that organisations do not reflect as much on these long-term costs as they do on the short-term ones.
- The indirect costs of breaches (Tables 5.4 and 5.5) are on a par with the direct costs. The 2020 study on the full cost of cyber security breaches showed that organisations find it harder to consider the indirect costs. Therefore, this may be another area where organisations are significantly undervaluing the overall cost of breaches and attacks.
- While not directly comparable to previous years, there is a similar pattern to this year’s findings, in that businesses tend to identify higher costs than charities on average, and smaller organisations generally report higher costs than larger ones. This does not necessarily mean that charities face a lower risk – it could be that they tend to have a less comprehensive understanding of the cost implications, so report lower costs.
- The median cost is typically £0 across businesses and charities – also a similar pattern to previous years. This reflects the fact that most breaches or attacks do not have any material outcome (a loss of assets or data), so do not always need a response. By contrast, the typical organisation that has dealt with a negative outcome from breaches or attacks does report non-negligible costs (a median cost across the year of £500 for businesses overall, and £2,280 for larger businesses). Organisations that are breached, but are fortunate enough not to lose data or assets, therefore run the risk of systematically under-appreciating the seriousness of cyber security breaches and attacks.
Chapter 6: Dealing with breaches or attacks
This chapter explores how well businesses and charities deal with breaches or attacks, including identification, response, reporting and adaptation to prevent future cases.
In the survey, questions on this topic were generally framed in terms of the most disruptive breach or attack an organisation had faced in the last 12 months. These questions are asked of the 39 per cent of business and 26 per cent of charities that have identified breaches or attacks, rather than the full sample. The size and sector subgroups therefore tend to have very small sample sizes. As such, subgroup analysis does not tend to show statistically significant differences and is featured much less in this chapter.
The questions on incident response in the first section are, however, asked of the full sample.
6.1 Incident response
Figure 6.1 shows the actions organisations typically say they take in response to a cyber security incident. Most organisations (66% of businesses and 59% of charities) do report having some sort of formalised incident response process, i.e. doing at least one of the things mentioned here.
However, approaches to incident response are often not very comprehensive. Just under two fifths of businesses (37%) and two-fifths of charities (41%) say they take at least four of the listed actions in the chart when they experience a cyber security incident.
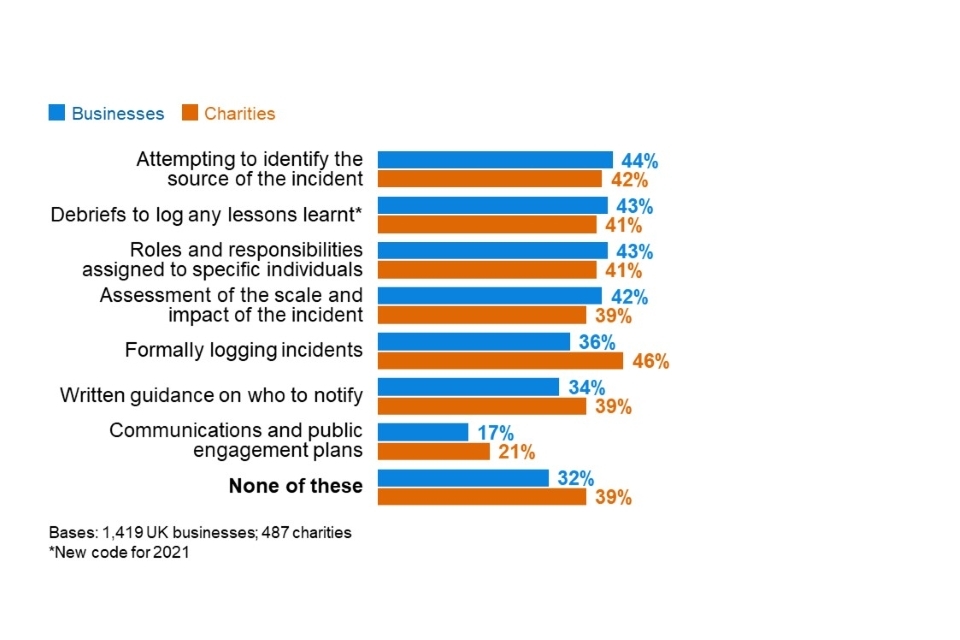
Figure 6.1: Percentage of organisations that take the following actions, or have these measures in place, for when they experience a cyber security incident
Formalised and multifaceted incident response processes are much more the norm among larger organisations. A clear majority of medium businesses, large businesses and high-income charities (with £500,000 or more) do all the processes listed in the chart, with the exception of communications and public engagement plans. For example, similarly high proportions of large businesses (75%), medium businesses (68%) and high-income charities (73%) say they formally log cyber security incidents.
Communications and public engagement plans are far less widespread than the other actions, even among large businesses (45% have plans of this sort). They are more common in three sectors – the ones in which boards tend to place the highest priority on cyber security:
- Information and communications (36%, vs. 17% overall)
- finance and insurance (35%)
- health, social care and social work (28%).
Alongside these standout sectors, businesses in the administration and real estate sector are also more likely than average to have certain processes in place, including debriefs to log lessons learnt (55%, vs. 43% overall) and formal logging of cyber security incidents (47%, vs. 36% overall).
6.2 Reporting breaches or attacks
Internal reporting to senior managers
Among the businesses that identified any breaches or attacks, the vast majority (93% of businesses) informed their senior managers or directors of their most disruptive breach. When excluding micro and small firms, where senior managers are more likely to have been aware in any case given the smaller working environment, this remains at only a slightly lower level for medium businesses (87%) and large businesses (83%).
A much lower proportion of charities (59%) informed their senior management or trustees in cases where they were breached. In high-income charities, fewer than half (47%) say that senior managers or trustees were informed.
These findings are very similar to those obtained in 2020, reflecting an ongoing disparity between businesses and charities in how their boards engage with cyber security.
External reporting
In contrast to internal upwards reporting, which is very common in businesses, external reporting of breaches has historically been very rare. Only two-fifths of businesses (37%) and three in ten charities (28%) reported their most disruptive breach outside their organisation.
For businesses, many of these cases – as in previous years – simply involve businesses reporting breaches to their external cyber security providers and no one else. When excluding these cases, we find that businesses reported externally only in three in ten cases (29%), and charities in roughly a quarter of cases (23%). The business figure has been relatively consistent since the 2017 survey, and this is also the case for charities, other than an unusually high figure in 2020 (38% – although the difference from the 2021 score is not statistically significant).
Among the 29 per cent of businesses that have reported externally, the top (unprompted) organisations that they tend to report to are banks, internet service providers, the police and clients, as Figure 6.2 shows. These findings are largely consistent with previous years, with few mentions of specific organisations like the National Cyber Security Centre (NCSC) or Action Fraud.
There are too few charities in the sample (ones that have reported breaches externally) to analyse in this way.
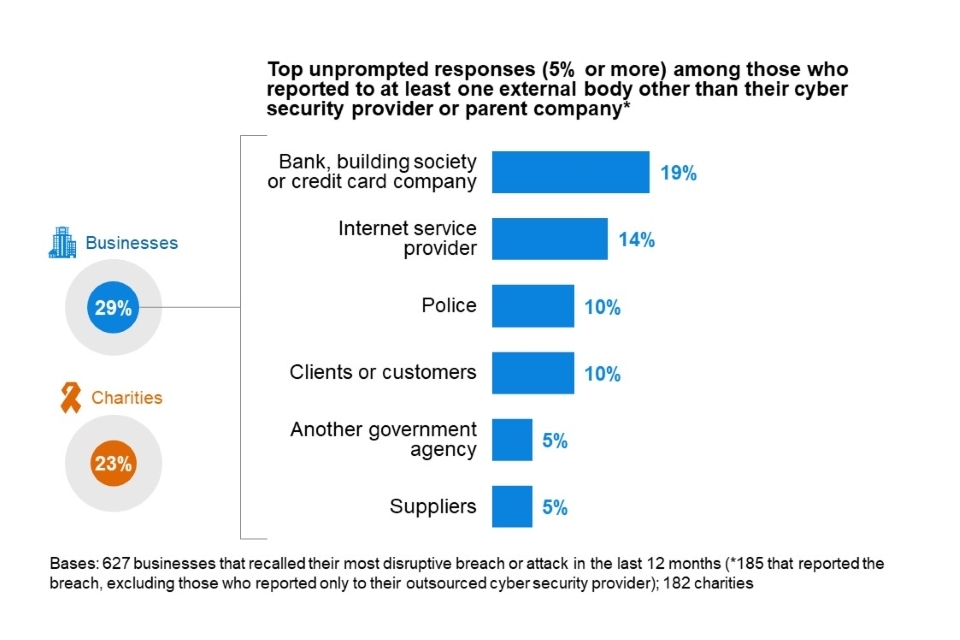
Figure 6.2: Percentage of organisations that report their most disruptive breach or attack of the last 12 months, excluding those that only report to their outsourced cyber security provider
6.3 Actions taken to prevent future breaches or attacks
Among those that have identified any breaches or attacks, most businesses (62%) and charities (69%) take action to prevent further breaches. Around one-third of businesses (36%) and onequarter of charities (28%) have taken no action since their most disruptive breach. These findings are similar to previous surveys in this series.
As Figure 6.3 shows, the most common (unprompted) actions taken are a mixture of additional staff training or communications, and new technical controls.
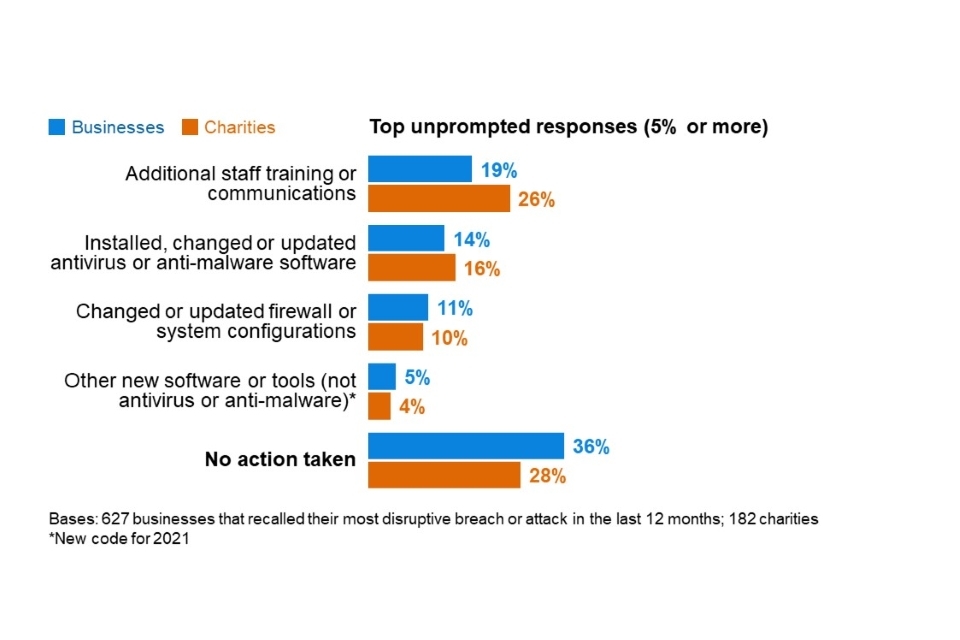
Figure 6.3: Percentage of organisations that have done any of the following since their most disruptive breach or attack of the last 12 months
We can further categorise the answers into changes of a technical nature, people-related changes (e.g. to training or staffing) and governance changes (e.g. updates to policies or other documentation). When viewed in this way, a greater proportion of businesses have made technical changes (36%) compared to people-related changes (23%). In charities, this is more evenly balanced (31% report making technical changes and 33% say they made people-related changes). For both groups, fewer decided to made changes to their governance processes (10% of businesses and 11% of charities).
Medium firms (78%) and large firms (79%) are the most likely to have taken any actions to prevent further breaches or attacks (vs. a 62% average).
As may be expected, the picture in Figure 6.3 changes slightly when looking only at businesses whose most disruptive breach resulted in a material outcome (e.g. the loss of files, money or other assets). This is shown in Figure 6.4. In these cases, businesses are even more likely to focus on technical changes, and fewer say they took no action at all.
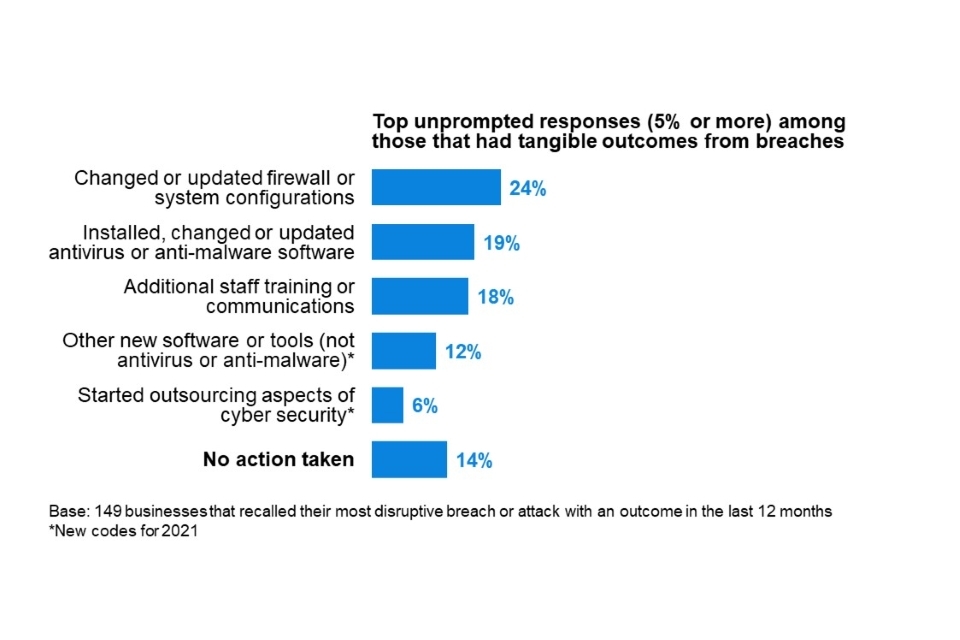
Figure 6.4: Percentage of organisations that have done any of the following since their most disruptive breach or attack of the last 12 months, in cases where breaches had material outcomes
There are too few charities in our sample that identified breaches with material outcomes to break down at this question.
Chapter 7: Conclusions
This is the first Cyber Security Breaches Survey to take place since the start of the COVID-19 pandemic. As such, it presents a unique opportunity to see how organisations’ cyber security has fared under the pandemic, which has brought about significant changes in ways of working. This includes home working, video conferencing, moves from paper to digital filing and record keeping, and, in some cases, increased use of social media.
Considering these trends, there are several encouraging results in the survey:
- The prioritisation of cyber security has held steady across the last three years. Management boards in businesses and charities continue to place more importance on cyber security than they did in the baseline surveys for both groups (in 2016 and 2018 respectively). The frequency with which boards receive cyber security updates has also been, broadly, steady this year, though there has been an increase in charities that say they never updated their boards on cyber security in the last 12 months.
- There is evidence from the qualitative interviews that the pandemic has sometimes spurred investment in cyber security and led to planned security upgrades being accelerated. The separate 2021 DCMS research on cyber security skills reported similar findings, with some IT and cyber leads using the pandemic to make the case for extra recruitment.
- This year, there has been an increase in the proportion of businesses with some form of cyber insurance. The qualitative research highlights that one of the drivers behind this uptake is the framing of cyber security breaches as an existential threat to organisations – they recognise that they may not have enough money in the bank to fund a recovery, or the specialist skills to deal with incidents or reputational damage on their own.
- The prevalence of many other positive cyber security practices remains above the baseline results for businesses (in 2016) and charities (first surveyed in 2018) respectively. This includes, for instance, having cyber security policies in place and carrying out cyber security risk assessments.
However, the results also clearly show the challenges raised by the pandemic. In many cases, COVID-19 seems to have made cyber security harder for organisations:
- Fewer businesses this year have identified cyber security breaches or attacks. This could be a temporary situation, reflecting the reduction in trading activity during the COVID-19 pandemic. The findings from the rest of the study indicate that it is unlikely to be due to an increase in defensive behaviours or a reduction in the overall frequency of attacks.
- Moreover, under the pandemic, organisations are perhaps less aware of the breaches and attacks they are facing. This narrative aligns with the falls in the proportion of organisations carrying out security monitoring and user monitoring. A key finding in the qualitative research is that direct monitoring has become more difficult in organisations where staff are working remotely – it is harder for organisations to know if staff are following the agreed policies and processes.
- Upgrading hardware, software and systems has also become more difficult. With staff working at home, there are more endpoints for organisations to keep track of. In this environment, we have seen falls in the proportions of businesses and charities taking more basic actions like updating their anti-malware across devices and setting up network firewalls. The qualitative research highlights the logistical issues that large organisations in particular face when trying to patch hardware and software remotely.
- The emphasis on more immediate service continuity needs at the outset of the pandemic has left a backlog of cyber security tasks and projects in some organisations. This has led to cyber security teams facing competing priorities. In some cases, organisations have had to choose between prioritising IT service continuity and maintenance work, and aspects of cyber security such as patching software. Moreover, the study highlights that in a new “blended” working environment post-pandemic, end users may be less receptive to any cyber security approaches that involve locking down user activity, and instead expect IT and cyber security staff to place more emphasis on functionality and flexibility.
Finally, the qualitative research finds that organisations are keen to make continuous improvements to their approach to cyber security management. They are also open to government guidance on the steps they can take and what good looks like.
As in previous years, there are several areas where organisations of all sizes could potentially take more action, including around supply chain risk management, and staff awareness and training. There are also emerging technologies and approaches that more organisations are engaging with, including multi-factor authentication, Software as a Service (SaaS) and smart devices. These are all areas where organisations may benefit from specific cyber security guidance or incentives in the future.
Moreover, it is important for organisations, management boards and IT teams to recognise that good cyber security facilitates better business resilience. This has not always been appreciated during the pandemic, when the focus on short-term business and IT service continuity has sometimes overshadowed discussions on cyber security. When emerging from the pandemic, there may be an opportunity for cyber security teams to reframe these discussions, to show that cyber security is an integral component of business resilience.
Annex A: Further information
The Department for Digital, Culture, Media and Sport would like to thank the following people for their work in the development and carrying out of the survey and for their work compiling this report.
- Harry Williams, Ipsos MORI
- Orla Leggett, Ipsos MORI
- Nick Coleman, Ipsos MORI
- Jayesh Navin Shah, Ipsos MORI
- Professor Steven Furnell, University of Nottingham.
The Cyber Security Breaches Survey was first published in 2016 as a research report, and became an Official Statistic in 2017. The previous reports can be found at www.gov.uk/government/collections/cyber-security-breaches-survey. This includes the full report, infographics and the technical and methodological information for each year.
The responsible DCMS analyst for this release is Emma Johns. The responsible statistician is Harry Smart. For enquiries on this release, from an official statistics perspective, please contact Harry at evidence@dcms.gov.uk.
For general enquiries contact:
Department for Digital, Culture, Media and Sport
100 Parliament Street
London
SW1A 2BQ
Telephone: 020 7211 6000
For media enquiries only (24 hours) please contact the press office on 020 7211 2210.
DCMS statisticians can be followed on Twitter at @DCMSinsight.
The Cyber Security Breaches Survey is an official statistics publication and has been produced to the standards set out in the Code of Practice for Official Statistics. For more information, see www.statisticsauthority.gov.uk/code-of-practice. Details of the prerelease access arrangements for this dataset have been published alongside this release.
This work was carried out in accordance with the requirements of the international quality standard for Market Research, ISO 20252, and with the Ipsos MORI Terms and Conditions which can be found at www.ipsos-mori.com/terms.
Annex B: Guide to statistical reliability
The final data from the survey are based on weighted samples, rather than the entire population of UK businesses or charities. Percentage results are therefore subject to margins of error, which vary with the size of the sample and the percentage figure concerned.
For example, for a question where 50% of the 1,419 businesses sampled in the survey give a particular answer, the chances are 95 in 100 that this result would not vary more or less than 3.5 percentage points from the true figure – the figure that would have been obtained had the entire UK business population responded to the survey. The margins of error that are assumed to apply in this report are given in the following table[footnote 10].
Margins of error (in percentage points) applicable to percentages at or near these levels
| 10% or 90% | 30% or 70% | 50% | |
|---|---|---|---|
| 1,419 businesses | ±2.0 | ±3.0 | ±3.3 |
| 741 micro firms | ±2.8 | ±3.5 | ±3.8 |
| 265 small firms | ±3.9 | ±6.0 | ±6.5 |
| 210 medium firms | ±4.3 | ±6.5 | ±7.1 |
| 203 large firms | ±4.3 | ±6.6 | ±7.2 |
| 487 charities | ±3.3 | ±5.1 | ±5.5 |
There are also margins of error when looking at subgroup differences. A difference from the average must be of at least a certain size to be statistically significant. The following table is a guide to these margins of error for the subgroups that we have referred to several times across this report.
Differences required (in percentage points) from overall (business or charity) result for significance at or near these percentage levels
| 10% or 90% | 30% or 70% | 50% | |
|---|---|---|---|
| 741 micro firms | ±1.2 | ±1.8 | ±2.0 |
| 265 small firms | ±3.5 | ±5.3 | ±5.9 |
| 210 medium firms | ±3.8 | ±5.8 | ±6.3 |
| 203 large firms | ±3.9 | ±6.0 | ±6.5 |
| 160 high-income charities | ±4.4 | ±6.7 | ±7.1 |
| 94 finance and insurance firms | ±6.7 | ±10.3 | ±11.2 |
© Crown copyright 2021
You may re-use this information (not including logos) free of charge in any format or medium, under the terms of the Open Government Licence.
To view this licence, visit www.nationalarchives.gov.uk/doc/open-government-licence/ or write to the Information Policy Team, The National Archives, Kew, London TW9 4DU, or email psi@nationalarchives.gsi.gov.uk.
Footnotes
-
For businesses, analysis by size splits the population into micro businesses (1 to 9 employees), small businesses (10 to 49 employees), medium businesses (50 to 249 employees) and large businesses (250 employees or more). For charities, we look at annual income bands, with high income being £500,000 or more. ↩
-
Where subgroup mean scores are compared, the large variation in the data often means that these differences are not statistically significant – this is made clear throughout. However, looking at the pattern of mean scores across subgroups, and the direction of travel since the 2016 and 2017 surveys, can still generate valuable insights in these instances. ↩
-
Subgroup differences highlighted are either those that emerge consistently across multiple questions or evidence a particular hypothesis (i.e. not every single statistically significant finding has been commented on). ↩
-
These aggregated results (for organisations updating managers at least annually or quarterly) across this section exclude the four per cent of businesses and charities that say they update senior managers each time there is a breach (although these are still included in the base). ↩
-
The charities mentioning their country’s charity regulator are also included in the 13 per cent mentioning a government or public sector information source. ↩
-
This is the percentage of businesses and charities that say they have all the following rules or controls: having network firewalls, security controls on company-owned devices, restricting IT admin and access rights to specific users, up-to-date malware protection, and a policy to apply software updates within 14 days. ↩
-
There are other questionnaire changes since 2020. The 2020 survey did not include the response options related to denial of service attacks, takeovers of user accounts and illicit listening into video conferences or chats. However, both the 2020 and 2021 surveys did still include an “any other cyber security breaches or attacks” option, and only a handful of respondents, if any, selected one of the three new answer options on their own. As such, these changes alone are expected to have had a negligible impact on any comparison between 2021 and 2020. ↩
-
We have combined the ransomware and other malware response options from Figure 5.2 for this chart. ↩
-
The cost estimates in this section are presented to three significant figures, or to the nearest whole number (if under 100). The mean and median scores exclude “don’t know” and “refused” responses. They merge together the answers from respondents who gave a numeric value as well as those who gave only a banded value (because they did not know the exact answer). For the latter, we have imputed numeric values from the given banded values. For this overall cost question, we opted to remove two outlier values for businesses from the calculations. We lay out this approach in detail in the Technical Annex. ↩
-
In calculating these margins of error, the design effect of the weighting has been taken into account. This lowers the effective base size used in the statistical significance testing. The overall effective base size was 901 for businesses (vs. 763 in 2020) and 312 for charities (vs. 181 in 2020). ↩