Cyber Security Breaches Survey 2020
Updated 26 March 2020

© Crown copyright 2020
This publication is licensed under the terms of the Open Government Licence v3.0 except where otherwise stated. To view this licence, visit nationalarchives.gov.uk/doc/open-government-licence/version/3 or write to the Information Policy Team, The National Archives, Kew, London TW9 4DU, or email: psi@nationalarchives.gov.uk.
Where we have identified any third party copyright information you will need to obtain permission from the copyright holders concerned.
This publication is available at https://www.gov.uk/government/statistics/cyber-security-breaches-survey-2020/cyber-security-breaches-survey-2020
The Cyber Security Breaches Survey is a quantitative and qualitative study of UK businesses and charities. It helps these organisations understand the nature and significance of the cyber security threats they face, and what others are doing to stay secure. It also supports the government to shape future policy in this area.
For this latest release, the quantitative survey was carried out in winter 2019 and the qualitative element in early 2020.
Summary
The extent of cyber security threats has not diminished. In fact, this survey, the fifth in the series, shows that cyber attacks have evolved and become more frequent.
Almost half of businesses (46%) and a quarter of charities (26%) report having cyber security breaches or attacks in the last 12 months. Like previous years, this is higher among medium businesses (68%), large businesses (75%) and high-income charities (57%)[footnote 1].
The business findings are in line with those in 2017 (when the question was first asked). The charity findings show a rising incidence, from 19 per cent in 2018 (when charities were first surveyed) and 22 per cent in 2019, to 26 per cent in 2020. This may mean that more charities are being targeted but could also mean that they are better at identifying breaches than before.
Among this 46 per cent of businesses that identify breaches or attacks, more are experiencing these issues at least once a week in 2020 (32%, vs. 22% in 2017). There is a similar pattern over time for charities, although the changes across years are not statistically significant. In 2020, a fifth of these charities (22%) say they experience breaches at least once a week.
The nature of cyber attacks has also changed since 2017. Over this period, there has been, among those identifying any breaches or attacks, a rise in businesses experiencing phishing attacks (from 72% to 86%), and a fall in viruses or other malware (from 33% to 16%).
Organisations have become more resilient to breaches and attacks over time. They are less likely to report negative outcomes or impacts from breaches, and more likely to make a faster recovery. However, breaches that do result in negative outcomes still incur substantial costs.
Among the 46 per cent of businesses that identify breaches or attacks, one in five (19%) have experienced a material outcome, losing money or data. Two in five (39%) were negatively impacted, for example requiring new measures, having staff time diverted or causing wider business disruption. Similarly, among the 26 per cent of charities reporting breaches or attacks, a quarter (25%) had material outcomes and over half (56%) were negatively impacted.
Since 2017, the proportion of these businesses listing any outcome has fallen by 19 percentage points and the proportion being negatively impacted has fallen by 18 percentage points. For charities, there is also a downward trend for each of these measures since 2018 although the changes are not statistically significant. It is also more common for businesses to immediately recover from breaches or attacks in 2020 than in 2017 (72% vs. 57%).
Where businesses have faced breaches with material outcomes, the average (mean) cost of all the cyber security breaches these businesses have experienced in the past 12 months is estimated to be £3,230. For medium and large firms, this average cost is higher, at £5,220.
Over the last five years, there has been greater board engagement in cyber security and increased action to identify and manage cyber risks. These improvements may underpin the fact that organisations have become more resilient.
Board engagement has increased over time among both businesses and charities:
- eight in ten businesses say that cyber security is a high priority for their senior management boards (80%, up from 69% in 2016). Three-quarters of charities say this about their senior management (74%, up from 53% in 2018).
- half of businesses (51%) and four in ten charities (38%) update their senior management on cyber security at least quarterly. The proportions that say they never update them have steadily declined, both for businesses (from 26% in 2016 to 17% in 2020) and charities (from 38% in 2018 to 12% in 2020).
- around two-fifths of businesses have board members with a cyber security brief (37%, up from 28% in 2016). Over two-fifths of charities have responsible board members or trustees (45%, up from 24% in 2018).
Improvements over time, in terms of identifying and managing risks, include:
- more businesses seeking out information and guidance (54%, vs. 44% in 2016)
- more businesses (35%, vs. 23% in 2016) and charities (37%, vs. 20% in 2018) carrying out cyber security risk assessments
- more businesses (43%, vs. 34% in 2016) and charities (53%, vs. 38% in 2018) having staff whose job role includes information security and governance
- more businesses (38%, vs. 29% in 2016) and charities (42%, vs. 21% in 2018) having written cyber security policies
- more businesses (69%, vs. 58% in 2018 – when this was first asked) and charities (61%, vs. 32% in 2018) backing up their data on cloud servers.
Across all these findings, organisations appear to have maintained, but not necessarily enhanced, the technical controls and governance processes they introduced for the General Data Protection Regulation (GDPR). While the overall trends since 2016 are positive and significant, the changes since the 2019 survey specifically are relatively modest.
However, there is still more that organisations might do on a range of diverse topics such as audits, cyber insurance, supplier risks and breach reporting. Organisations may be confused about how they should be considering these topics and what best practice is.
Half of businesses (50%) and charities (49%) say they have carried out an internal or external audit in the last 12 months. However, our qualitative research indicates that the quality of these audits varies greatly. In some cases, external audits were broader financial audits that covered aspects of cyber security but did not focus on the topic.
A minority of organisations:
- report being insured against cyber risks (32% of businesses and 31% of charities)
- have reviewed the cyber security risks presented by suppliers (15% of all businesses, 43% of large businesses specifically, and 13% of charities)
- have reported cyber security breaches to anyone beyond their IT or cyber security providers (27% of businesses and 38% of charities, among those that identified any breaches or attacks).
The qualitative research also suggests that current communications, both around supplier risks and reporting of breaches, can be confusing for organisations.
- some interviewees considered supplier risks only in terms of IT providers, internet service providers and other digital service providers – not wider non-digital service suppliers. On the other hand, for charities, the term “supplier risks” can be too narrow, as it does not encompass the wider network of partner organisations that they interact with digitally.
- reporting meant different things in different contexts – reporting to IT or cyber security providers as part of incident response, reporting financial losses to banks and insurance companies, public declarations to customers or suppliers, or reporting to wider authorities. Organisations were also unclear on who to report to, and the impact of reporting.
Finally, our findings also highlight opportunities and channels to spread good practice. In the qualitative interviews, banks, insurance companies and accountants often played a major role in guiding organisations on cyber security. We also found that organisations are often primed to think about cyber security during financial audits, when filing tax returns, in meetings with insurance brokers and when undergoing broader technological changes, for example upgrades to operating system or moving to a cloud server.
Chapter 1: Introduction
1.1 Code of practice for statistics
The Cyber Security Breaches Survey is an official statistic and has been produced to the standards set out in the Code of Practice for Statistics.
1.2 Background
Publication date: March 2020 Geographic coverage: United Kingdom
The Department for Digital, Culture, Media and Sport (DCMS) commissioned the Cyber Security Breaches Survey of UK businesses and charities as part of the National Cyber Security Programme. The findings help these organisations to understand the nature and significance of the cyber security threats they face, and what others are doing to stay secure. It also supports the Government to shape future policy in this area, in line with the National Cyber Security Strategy 2016–2021.
The latest survey was carried out by Ipsos MORI. It covers:
- awareness and attitudes towards cyber security
- approaches to cyber security, including the technical and governance processes that organisations have in place to identify and manage cyber risks
- the nature and impact (including estimated costs) of cyber security breaches
- differences by size and sector.
This 2020 publication follows previous surveys in this series, published annually since 2016. In each publication year, the quantitative fieldwork has taken place in the winter of the preceding year (for example, in winter 2019, for this latest survey).
1.3 Methodology
As in previous years, there were two strands to the Cyber Security Breaches Survey:
- we undertook a random probability telephone survey of 1,348 UK businesses and 337 UK registered charities from 9 October 2019 to 23 December 2019. The data have been weighted to be statistically representative of these two populations.
- we carried out 30 in-depth interviews in January and February 2020, to gain further qualitative insights from some of the businesses and charities that answered the survey.
Sole traders and public-sector organisations were outside the scope of the survey. In addition, businesses with no IT capacity or online presence were deemed ineligible, which led to a small number of specific sectors (agriculture, forestry and fishing) being excluded. These exclusions are consistent with previous years, and the survey is considered comparable across years[footnote 2].
More technical details and a copy of the questionnaire are available in the separately published Technical Annex.
A separate annex, available on the same GOV.UK page, summarises the results from a smaller survey of 287 education institutions, carried out for the first time this year.
1.4 Changes since the 2019 survey
The 2020 survey is also methodologically consistent with previous years. However, this year’s study makes the following changes:
- a reduction in sample sizes, to allow for the separate sample of education institutions
- removing questions on investment in cyber security and training, and various other changes to the questionnaire to stay in line with DCMS policy objectives
- a change to the weighting approach to more accurately reflect the balance of micro vs. small firms in the weighted data (which has a negligible impact on trends)
- two script omissions meaning that denial-of-service attacks have not been recorded this year – which we address in Chapter 5.
The report flags any changes that mean findings are no longer comparable with previous years (i.e. where the questionnaire has changed or where certain codes were omitted). A full list of these changes is in the Technical Annex.
1.5 Interpretation of findings
How to interpret the quantitative data
The survey results are subject to margins of error, which vary with the size of the sample and the percentage figure concerned. For all percentage results[footnote 3], subgroup differences by size, and sector, as well as changes since the previous surveys, have been highlighted only where statistically significant (at the 95% level of confidence)[footnote 4]. There is a further guide to statistical reliability at the end of this release. Subgroup definitions and conventions
For businesses, analysis by size splits the population into micro businesses (1 to 9 employees), small businesses (10 to 49 employees), medium businesses (50 to 249 employees) and large businesses (250 employees or more).
For charities, analysis by size is primarily considered in terms of annual income band. The sample size for charities (337) is lower this year than in 2019 (514) and 2018 (569). As a result, we do not pull out income band differences to the same extent as in previous years. Where we do pull out these differences, we focus on the subgroup of high-income charities (with £500,000 or more in annual income).
Due to the relatively small sample sizes for certain business sectors, these have been grouped with other similar sectors for more robust analysis. Business sector groupings referred to across this report, and their respective SIC 2007 sectors, are:
- administration or real estate (L and N)
- construction (F)
- education (P)
- health, social care or social work (Q)
- entertainment, service or membership organisations (R and S)
- finance or insurance (K)
- food or hospitality (I)
- information or communications (J)
- utilities or production (including manufacturing) (B, C, D and E)
- professional, scientific or technical (M)
- retail or wholesale (including vehicle sales and repairs) (G)
- transport or storage (H).
Where figures in charts do not add to 100%, or to an associated net score, this is due to rounding of percentages or because the questions allow more than one response.
How to interpret the qualitative data
The qualitative survey findings offer more nuanced insights and case studies into how and why businesses and charities hold attitudes or adopt behaviours with regards to cyber security. The findings reported here represent common themes emerging across multiple interviews. Where examples or insights from one organisation, or a small number of organisations are pulled out, this is to illustrate findings that emerged more broadly across interviews. However, as with any qualitative findings, these examples are not intended to be statistically representative.
1.6 Acknowledgements
Ipsos MORI and DCMS would like to thank all the organisations and individuals who participated in the survey. We would also like to thank the organisations who endorsed the fieldwork and encouraged businesses to participate, including:
- the Association of British Insurers (ABI)
- the Charity Commission for England and Wales
- the Charity Commission for Northern Ireland
- the Confederation of British Industry (CBI)
- the Federation of Small Businesses (FSB)
- the Institute of Chartered Accountants in England and Wales (ICAEW).
Chapter 2: Profiling UK businesses and charities
Some organisations may be more at risk of cyber security breaches given their reliance on digital services or e-commerce, or employees’ use of personal devices in the workplace. This brief chapter covers the types of organisations that tend to be more exposed to risks in this way. It helps to contextualise some of the sector differences evidenced in later chapters.
2.1 The digital footprint of different organisations
This survey series has consistently shown that almost all UK organisations grapple with cyber security risks, by the fact that almost all have email addresses and the vast majority (81% of businesses and 73% of charities in the 2019 survey) have a website. This year’s survey focuses on the types of digital exposure that might vary across different organisations and sectors, such as the ability to take payments or orders online, or the storage of personal data.
Figure 2.1 shows that half or more organisations – businesses and charities – have online bank accounts, social media pages and hold personal data about customers. Taking payments or bookings online is relatively less common, but still offered by around one in four organisations. The latter is more prevalent across medium businesses (34%, vs. 23% overall) and large businesses (47%).
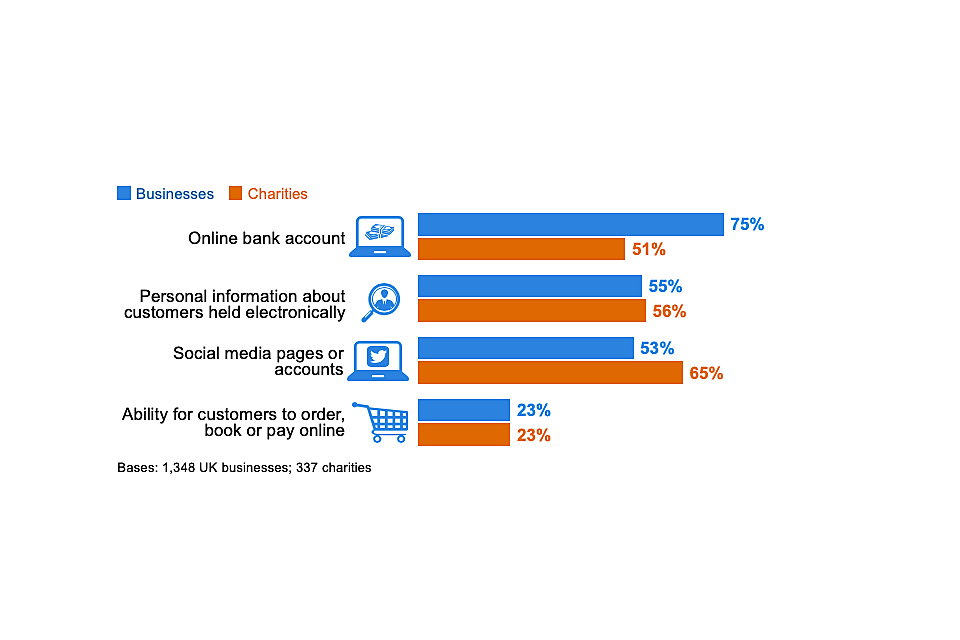
Figure 2.1: Percentage that currently have or use the following digital services or processes
We also ask charities about two types of online activity that might affect them over and above private sector businesses:
- a third (35%) of charities allow people to donate to them online.
- a similar proportion (35%) have beneficiaries that can access services online.
Sector differences
Among private businesses, the sectors that are most likely to hold personal data about customers include:
- finance and insurance (77%, vs. 55% overall)
- administration and real estate (70%)
- health, social work and social care (68%).
The sectors where it is most common for customers to book or pay online are the information and communications sector (36%, vs. 23% overall) the food and hospitality sector (33%).
Changes over time
The proportion of charities reporting that they hold personal data about customers or beneficiaries rose between the 2018 and 2019 surveys (from 44% to 58%). We discussed in last year’s report that this may have been due to charities becoming more aware of what constitutes personal data due to the General Data Protection Regulation (GDPR), rather than an actual change in the volume of personal data being handled. This year’s result (56%) shows no significant change, suggesting that a heighted awareness of personal data issues persists among charities long after the introduction of GDPR.
Other estimates have fluctuated since the 2016 study but there is no consistent pattern to these changes. Moreover, the sectoral differences raised here, particularly in terms of personal data usage, are very similar across all years of the survey – these same sectors have historically been more exposed to risks around personal data loss.
2.2 Use of industrial control systems
An industrial control system (ICS) is a digital control system used to control industrial processes such as manufacturing, raw materials and energy production, distribution and telecommunications. Our survey asks the specific sectors that are likely to carry out these processes whether they have an ICS. Our estimates suggest that even in these sectors, the use of ICS is relatively niche. This includes:
- utilities and production (9% use ICS)
- construction (5%)
- information and communications (3%).
These results are consistent with previous years.
There are too few transport and storage firms in the sample to report separately this year, but the combined data across the past three years of the survey suggests around 8 per cent of the businesses in this sector also use ICS.
2.3 Use of personal devices
Using a personal device, such as a personal non-work laptop, to carry out work-related activities is known as bringing your own device (BYOD). Around half of businesses (53%) and six in ten charities (61%) say that staff in their organisation regularly do this, as Figure 2.2 shows.
BYOD has historically been more prevalent in charities than in businesses (since charities were first included, in the 2018 survey). DCMS’s 2017 qualitative research with charities suggested that this behaviour was especially common among smaller charities – they often have lower budgets for IT equipment or do not have their own office space, so encourage home working.
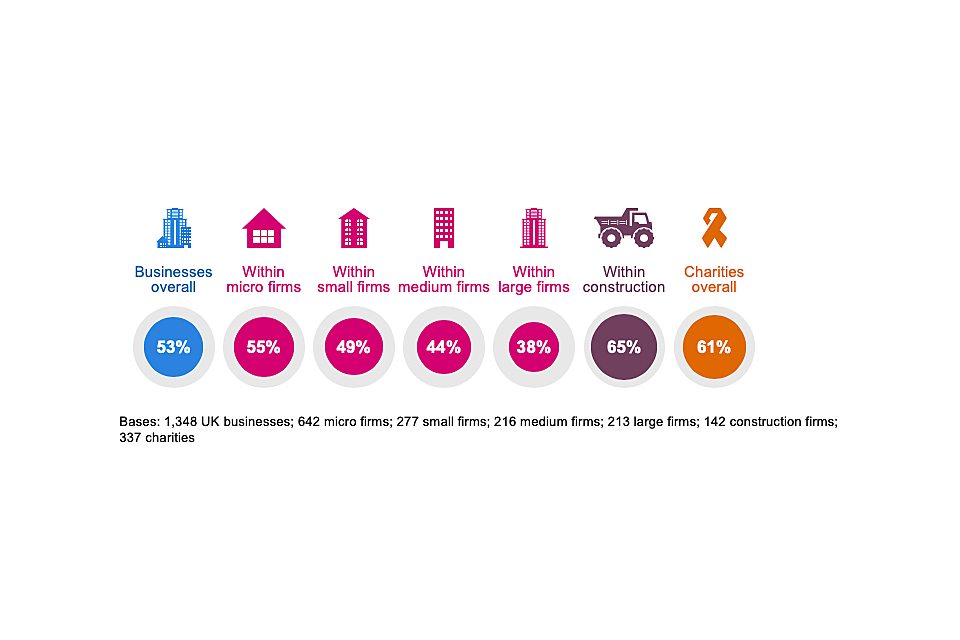
Figure 2.2: Percentage that have any staff using personally owned devices to carry out regular work-related activities
As the chart indicates, this behaviour is more common in the construction sector.
The business findings show a small increase in BYOD this year (53%, vs. 44% in 2019). However, the longer-term trend suggests little change over time – the result was 45 per cent in 2016. The charity results have also been consistent since they were first surveyed (in the 2018 study).
Chapter 3: Awareness and attitudes
This chapter starts by exploring how much of a priority cyber security is to businesses and charities, and how this has changed over time. It then looks at where organisations get information and guidance about cyber security, and how useful this is for them.
One of the areas we covered in the qualitative research was perceptions of the existing government guidance on cyber security, and this is also something we discuss in this chapter.
3.1 Perceived importance of cyber security
The vast majority of businesses (80%) and charities (74%) say that cyber security is a high priority for their senior management. For both groups, there is a relatively equal split between those that say it is a very or fairly high priority, as Figure 3.1 shows.
It is important to note that our survey is carried out with the individual within each organisation who is most responsible for cyber security. In smaller organisations, this is likely to be someone in the senior management team, who can answer this question first-hand. In larger organisations, these individuals may not be senior managers, and their answers will reflect their own perceptions of their senior management teams.
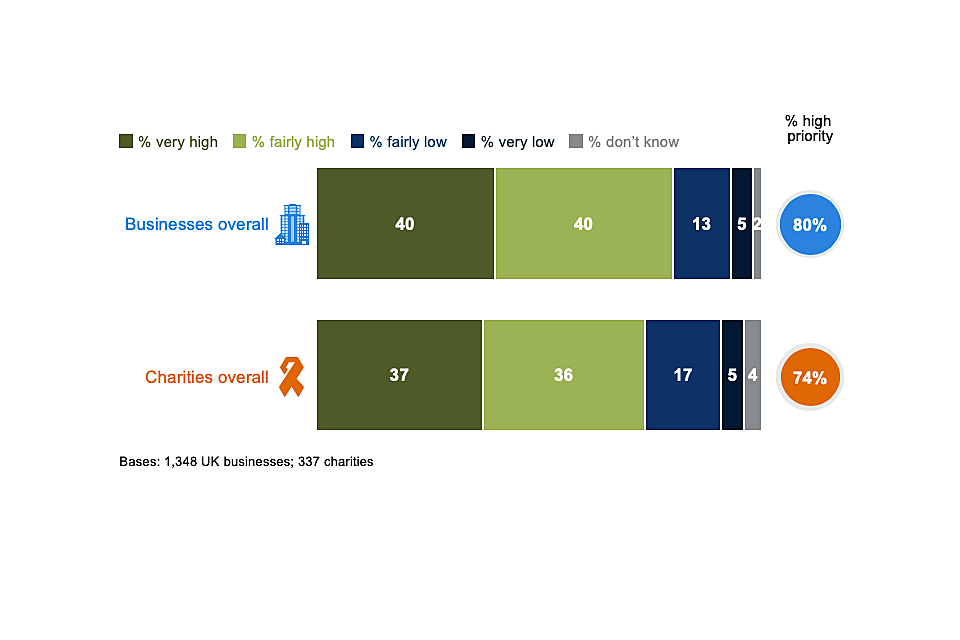
Figure 3.1: Extent to which cyber security is seen as a high or low priority for directors, trustees and other senior managers
It is more common for larger businesses to say that cyber security is a high priority (92% of medium businesses and 95% of large businesses, vs. 80% overall). The same is true for high-income charities (94%, vs. 74% of charities overall).
The business sectors that attach a higher priority to cyber security are:
- finance and insurance (71% say it is a very high priority, vs. 40% of all businesses)
- information and communications (57%)
- health, social work and social care (56%).
By contrast, the food and hospitality sector and construction sector both tend to treat cyber security as a lesser business priority (only 69% and 70% say it is a high priority, vs. 80% for the average business).
Across the years this survey has been carried out, we have repeatedly found these sector differences. For finance and insurance, and information and communications businesses, this pattern is reflected in DCMS’s recent cyber sectoral analysis, which showed that cyber security products and services are very commonly targeted at these sectors. For health, social work and social care, it is worth noting that the sectoral analysis did not show this targeting to the same extent – relatively few cyber firms (3%) were focused on serving this sector, even though these businesses attach a very high priority to cyber security.
Changes over time
As Figure 3.2 shows, the proportion of organisations viewing cyber security as a high priority has risen over time for both businesses and charities.
For charities, there was a particularly steep rise between the 2018 and 2019 surveys, likely to have been driven by the introduction of the General Data Protection Regulation (GDPR) in early 2018. Although the topic of GDPR has been less salient this year than in the past two years, it is worth noting that the charity figures have not fallen back – charities are still far more likely to see cyber security as a high priority now than in the 2018 survey (74% vs. 53%).
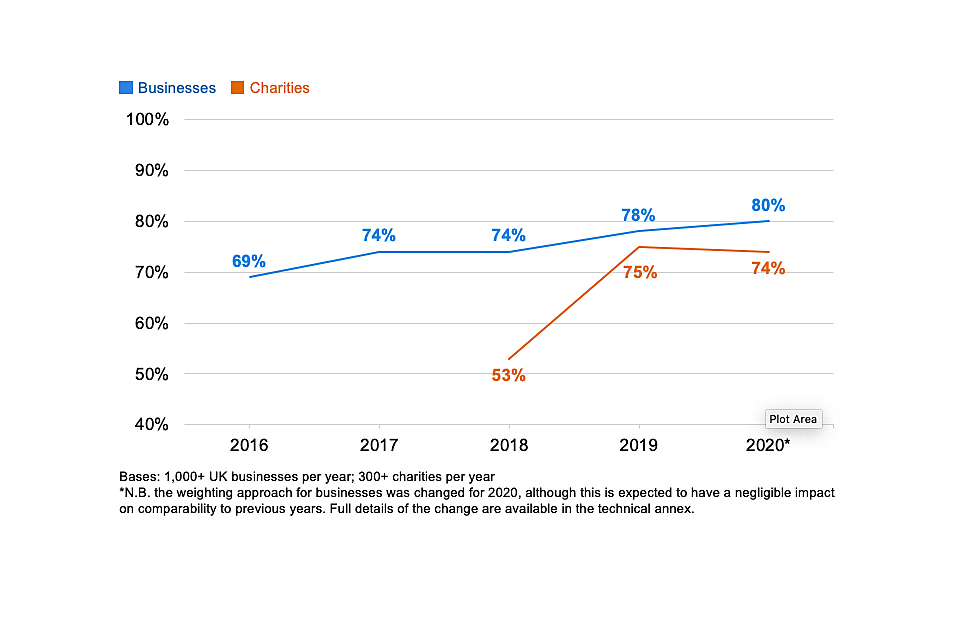
Figure 3.2: Percentage of organisations over time where cyber security is seen as a high priority for directors, trustees and other senior managers
It is worth noting that this change in attitudes is evidenced in businesses of all sizes. For example, among micro businesses, the proportion saying cyber security is a high priority has risen by 15 percentage points since 2016 (from 63% to 78%). Among large businesses, the overwhelming majority already considered cyber security a high priority in 2016 (90%), but the proportion that view it as a very high priority has risen by 16 percentage points since 2016 (from 52% to 68%).
3.2 Involvement of senior management
How often are senior managers updated on cyber security?
Figure 3.3 breaks down how often senior managers get updates on the state of cyber security and any actions being taken. Excluding the very small proportions that say this happens every time there is a breach (which may vary in regularity), two-thirds of businesses (66%) and seven in ten charities (71% charities) say senior managers are updated at least once a year[footnote 5].
On average, businesses update their senior managers more often than charities. Half of businesses (51%) update them at least quarterly, while four in ten charities (38%) do this.
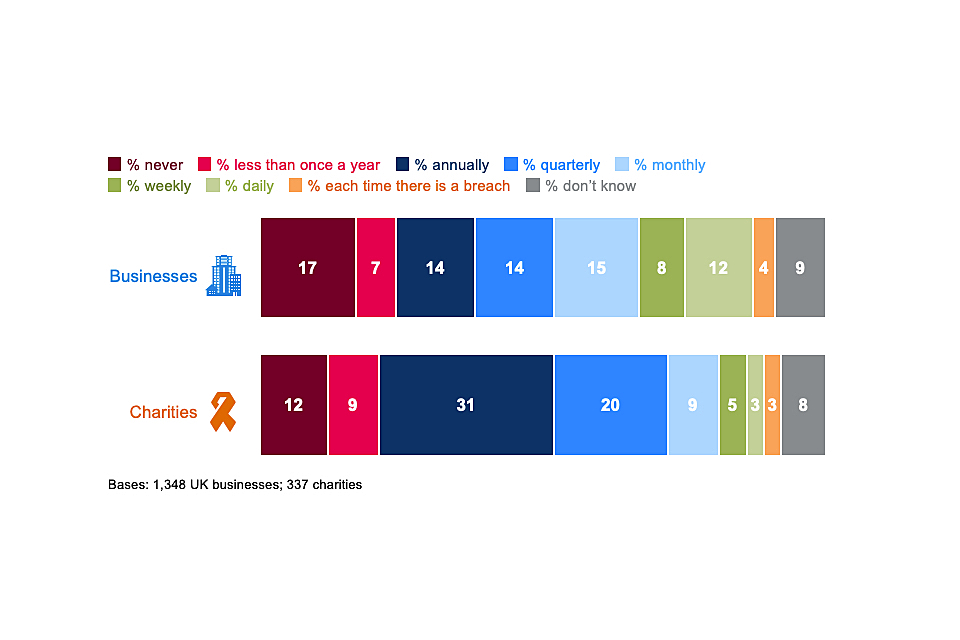
Figure 3.3: How often directors, trustees or other senior managers are given an update on any actions taken around cyber security
As in previous years, this varies greatly by the size of the organisation. Medium and large businesses tend to have very similar behaviours in this respect. For example, around three-quarters of medium businesses (72%) and large businesses (74%) have senior managers updated at least quarterly, compared to six in ten small businesses (61%) and five in ten micro businesses (49%)[footnote 6].
Linked to the attitudes covered in the previous section, businesses in the food and hospitality sector (32%) and construction sector (27%) are more likely than average (17%) to say their senior managers are never given any updates on cyber security.
Changes over time
In line with the rising priority attached to cyber security over time, businesses and charities have also changed how often they discuss the topic with their senior management teams. The proportions saying that they never update senior managers has steadily declined over time, as Figure 3.4 shows. Again, this has been a faster and more substantial shift for charities than for businesses.
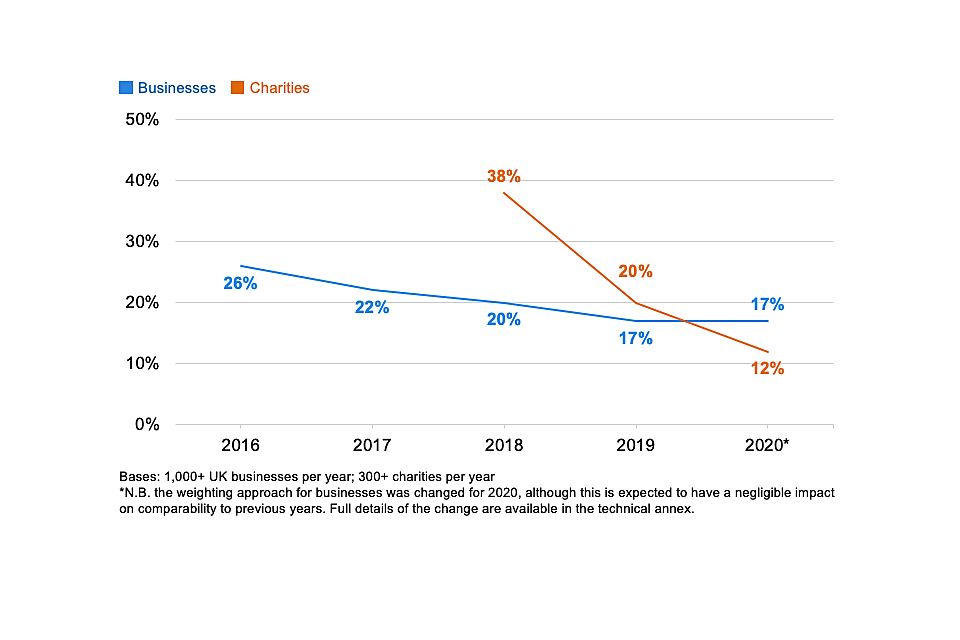
Figure 3.4: Percentage of organisations over time that never update senior managers on any actions taken around cyber security
However, the changes over time also suggest that, among businesses, there was a spike in discussions with senior managers following the introduction of GDPR (between fieldwork for the 2018 and 2019 surveys), and that since this high point, updates to senior managers have become less frequent again. Excluding the businesses that only provide updates each time there is a breach, 53 per cent gave at least quarterly updates to senior managers in 2018. This rose to 59 per cent in 2019. It has now dropped back down to 51 per cent in this latest survey.
3.3 Drivers of attitudinal and behaviour change
In the qualitative interviews, we explored how organisations’ attitudes and approaches to cyber security had evolved over the past five years and what had led to these changes. Several key themes emerged, including organisations reacting to technological change, reacting to breaches, wider societal awareness and understanding of cyber security, and senior individuals within organisations driving culture change.
- Organisations did not always make improvements to cyber security for their own sake. Instead, they often made wider technological changes and then updated their cyber security policies and processes around these changes. Examples included moving data to remote or cloud servers, starting to submit tax returns online (as part of the government’s Making Tax Digital initiative), migrating to new software or systems like Office 365 or Windows 10, and digitising aspects of the services they delivered.
- Organisations often made sweeping changes in response to breaches that incurred clear financial losses, took up staff time or spread externally (e.g. to clients or suppliers). In one case, we spoke to a large payroll business. They were infected by malware that led to their mail server sending fake invoices to their clients. Staff spent time dealing with clients and their bank to resolve the issues. Following the incident, they changed their firewall provider, IT provider, and mail server.
- Several interviewees spoke about a general increase in awareness and understanding of cyber security among staff over time. This was seen to be the result of growing news coverage of cyber security breaches, the increasing prominence of cyber security in people’s personal lives (e.g. when they interacted with banks), and wider awareness of data protection because of GDPR. This combination of societal changes was felt to have made staff more receptive to things like cyber security training.
“I think staff and management have become aware from media and news, and various thing externally, without us having to make them aware. They’ve become more receptive to the training and awareness we’ve tried to implement and become more streetwise.”
Large business
- In some cases, interviewees highlighted that their senior management boards included individuals who had come from technical backgrounds such as IT or more generally took a strong personal interest in cyber security. This seemed to be a particularly important factor for charities, where more sophisticated actions on cyber security were often driven by trustees that had this kind of technical background in the private sector.
“The board member who was the engine behind this change is now Chair. The person who, until a year or so ago, was Head of Business Services is now the CEO. We haven’t replaced the Head of Business Services, but the CEO has carried the local cyber security responsibilities with him.”
Charity
3.4 Sources of information
Overall proportion seeking cyber security information or guidance
The quantitative survey shows that over half of businesses (54%) and around half of charities (51%) have actively sought information or guidance on cyber security from outside their organisation in the past year.
Figure 3.5 shows that this information seeking is more common among small and medium businesses than micro or large ones. For micro firms, this is possibly linked to them treating cyber security as less of a priority issue than other size bands. In the case of large firms, this may be because they have more expertise internally – a quarter (24%) of large businesses say they have sought information from their own boards or other internal experts, compared to one in ten medium businesses (10%) and a low average across all businesses (4%).
These patterns by size have been very consistent across the years of the survey. They tend to reflect that small and medium businesses are the ones most likely to outsource parts of their cyber security to external cyber security providers (which we cover in Chapter 4), and that these providers turn out to be a very common source of information and guidance for the organisation.
As the chart shows, the sectors where firms are most likely to seek out information are the professional, scientific and technical, and finance and insurance sectors.
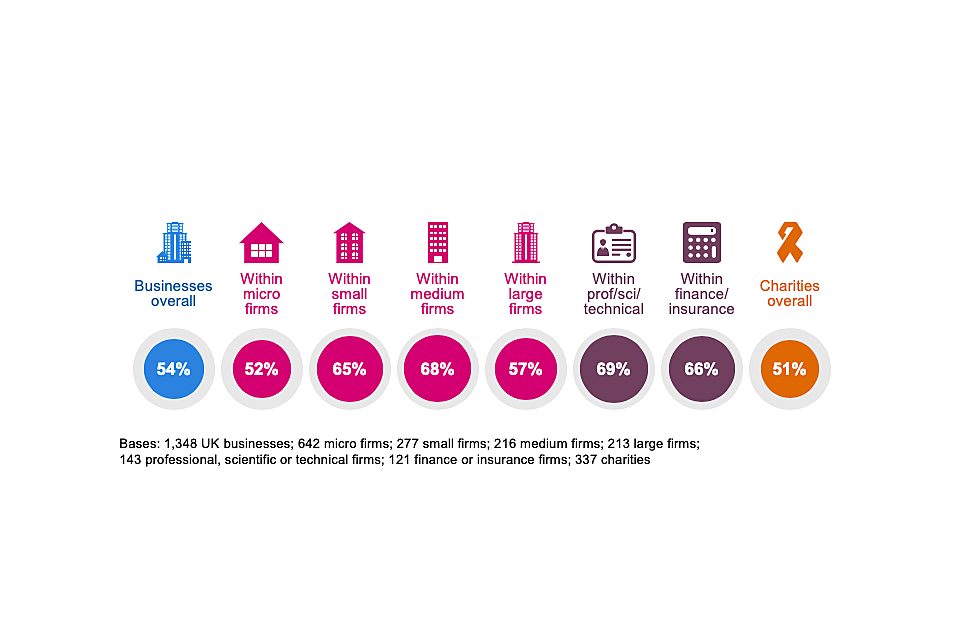
Figure 3.5: Proportion of organisations that have sought external information or guidance in the last 12 months on the cyber security threats faced by their organisation
These findings have changed over time. For charities, there has been a consistent increase in external information seeking, from 36 per cent in 2018, to 47 per cent in 2019 and 51 per cent this year. As with the changes in senior management attitudes, the bigger shift, between the 2018 and 2019 surveys, followed the introduction of GDPR.
Among businesses, the proportion seeking information externally is now 10 percentage points higher than in the 2016 survey (up from 44% to 54%)[footnote 7]. However, much like the changes in behaviour described in the previous section, information seeking among businesses spiked in the 2019 survey (at 59%) and has since fallen. This suggests that, for businesses, there was more of a temporary change in behaviour around the introduction of GDPR.
Where do organisations get information and guidance?
The most common sources of information and guidance, asked unprompted in the survey, are:
- external cyber security consultants, IT consultants or managed service providers (mentioned by 27% of businesses and 23% of charities)
- general online searching (9% of businesses and 7% of charities)
- any government or public sector source, including government websites, regulators and other public bodies (6% of businesses and 11% of charities)
- trade associations (4% of businesses and 4% of charities).
When it comes to information from the government or other public bodies, it is worth noting that more charities than businesses use these sources (11% vs. 6%). Medium and large businesses are also more likely to seek information from these sources than micro or small businesses (also 11% vs. 6%). Each individual government source receives very few mentions:
- Two per cent of businesses and three per cent of charities mention the GOV.UK website. This might include the National Cyber Security Centre (NCSC) website, which has a GOV.UK suffix, although these organisations did not specifically mention the NCSC.
- One per cent each of businesses and charities mention the Information Commissioner’s Office (ICO). This rises to four per cent among large businesses.
- Less than one per cent of businesses and charities specifically mention the NCSC. There is also little variation by size on this – just two per cent of large businesses specifically mention it.
For businesses, the proportion using government or public sector sources has increased since the first survey in 2016 (when it was 2%), although it remains uncommon.
Qualitative insights on influential voices and touchpoints
Across the qualitative interviews, the individuals responsible for cyber security in their organisations had often picked up informal advice and guidance from the same external organisations. These interviews highlight a set of external actors – IT providers, accountants, banks, insurance brokers and government organisations – that can play an influential role in affecting behaviour around cyber security.
- Smaller organisations often sought informal advice and guidance from their external IT or cyber security providers.
- Various interviewees said that accountants had included guidance on cyber security as part of a financial audit or board meeting.
- Interviewees frequently suggested they would talk to their bank about cyber security if there was ever a breach involving a financial loss.
- Decisions around cyber insurance were often strongly influenced by insurance brokers.
- HM Revenue and Customs was flagged because it requests sensitive financial data from organisations, already issues guidance around digital scams, and can carry out site visits.
- The Information Commissioner’s Office (ICO) was raised as somewhere to report breaches. Some interviewees had also used the ICO website as an information source. There was a sense that the ICO has had a higher profile since the introduction of GDPR.
These examples also indicate a series of interactions that most organisations have on an annual basis with a trusted third party – financial audits, board meetings with their accountant, tax returns and conversations with their bank or insurance broker – which might make good opportunities to discuss cyber security and introduce relevant government guidance.
The usefulness of government information and guidance
As in previous quantitative surveys, we ask the organisations that recall seeking government information and guidance whether they found it useful. In total, 83 per cent of this group of businesses (there are too few charities to report) say these sources were useful, which is in line with previous years.
As only a very small proportion have used government sources, these findings have very high margins of error and should be treated as more indicative of the balance of opinion rather than as close estimates. They show, as they have across each year of the survey, that there is a generally positive reception towards government information and guidance on cyber security.
Awareness of government initiatives and communications
The unprompted question around information sources tends to underrepresent actual awareness of government communications on cyber security, as people do not necessarily recall the specific things they have seen and heard. We therefore ask organisations whether they have heard of specific initiatives or communications campaigns before. These include:
- the national Cyber Aware communications campaign, which offers tips and advice to protect individuals and organisations against cybercrime
- the 10 Steps to Cyber Security guidance, which aims to summarise what organisations should do to protect themselves
- the NCSC’s Small Business Guide and Small Charity Guide, which outline more basic steps that these smaller organisations can do to protect themselves
- the NCSC’s Board Toolkit, which helps management boards to understand their obligations and to discuss cyber security with the technical experts in their organisation
- the government-endorsed Cyber Essentials scheme, which enables organisations to be certified independently for having met a good-practice standard in cyber security.
In total, we find that the average charity tends to be more aware than the average business. Figure 3.6 illustrates this. It also highlights the typically higher awareness among medium and large businesses.
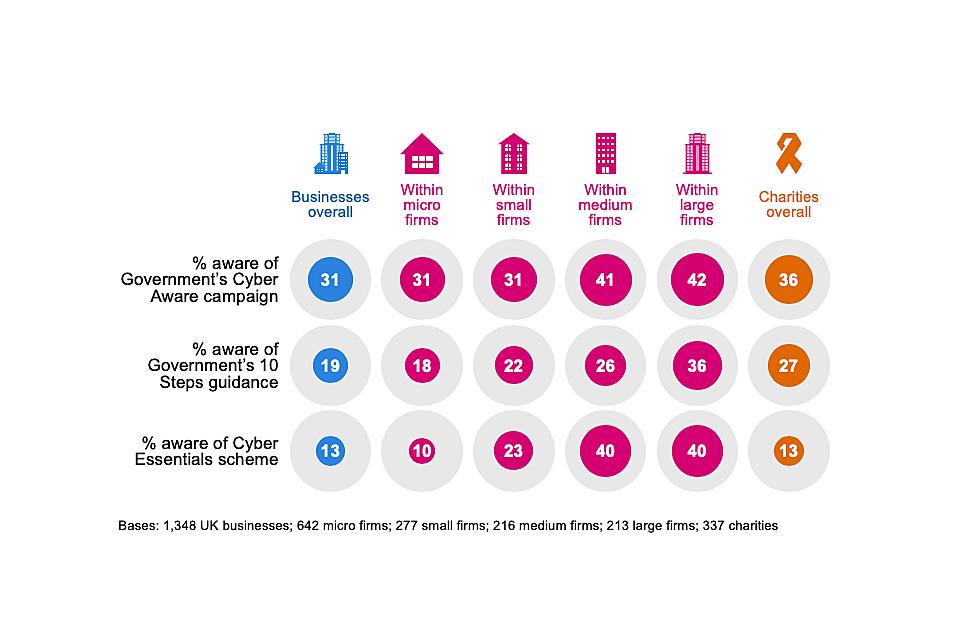
Figure 3.6: Percentage of organisations aware of the following government initiatives, guidance or communication campaigns
Awareness of Cyber Essentials is particularly high among information and communications firms (31%, vs. 13% among all businesses) and finance and insurance firms (24%).
The trends over time for businesses and charities continue to show rising awareness of all three of these initiatives.
- For businesses, awareness of Cyber Aware remains 10 percentage points higher than in 2017 (when this question was first asked), although it is unchanged since the 2019 survey. Awareness of the 10 Steps guidance and Cyber Essentials have risen consistently in each year of the survey – these results are eight and seven percentage points higher respectively than in 2016.
- For charities, awareness of the Cyber Aware campaign has increased from 30 per cent in 2018 (when charities were first included in the survey) and 31 per cent in 2019, to 38 per cent this year. Awareness of the 10 Steps guidance has also grown (from 19% in 2018 to 27% in 2020).
For the communications aimed at organisations of different sizes – which were asked about for the first time this year – we find that:
- 16 per cent of micro and small businesses have heard of the Small Business Guide (with little variation between micro and small firms)
- 16 per cent of charities have heard of the Small Charities Guide
- 11 per cent of medium businesses and 22 per cent of large businesses have heard of the Board Toolkit.
Impressions of government guidance
In advance of the qualitative interviews, we asked interviewees to look at various existing government guidance to gather some general feedback. The five specific documents or links we covered included:
- the 10 Steps to Cyber Security guidance
- the Small Business Guide
- the Small Charity Guide
- the Board Toolkit
- NCSC’s e-learning package, Top Tips for Staff.
It is worth noting that this was not detailed user testing. Many interviewees had only glanced at the guidance. Therefore, the findings we report here are very broad.
In general, all the guidance was positively received. Interviewees felt these guides would prompt discussions around policies and processes. They would also provide reassurance for the organisations that had already implemented the recommended processes.
Interviewees also offered some general thoughts around making guidance more useful:
- Guidance directed at management boards needs to be especially succinct. One interviewee praised the use of infographics for this purpose. Another said that adding an executive summary, a key facts section or more subheadings would improve this.
- One interviewee noted that there could be more upfront messaging in the Board Toolkit around the risks and implications presented by poor cyber security, such as lost business or GDPR-related fines. This framing, they felt, would make boards pay more attention.
- There was sometimes uncertainty about the target audience within an organisation for the Small Business Guide and Small Charity Guide – whether they were aimed at management boards, technical staff or wider staff. Some interviewees remarked that they were too basic for people in technical IT or cyber security roles, but they could still be used to help them educate board members. On the other hand, they were sometimes seen as less relevant for staff outside technical roles.
Chapter 4: Approaches to cyber security
This chapter looks at the various ways in which organisations are dealing with cyber security. This covers topics such as:
• risk management and cyber insurance
• technical controls
• staffing and outsourcing
• governance approaches and policies
We also cover the extent to which organisations are meeting the requirements set out in government-endorsed Cyber Essentials scheme and the government’s 10 Steps to Cyber Security guidance.
In previous years, we have also featured quantitative findings on investment in cyber security, as well as staff skills and training in this area. These questions have been removed for the 2020 study, to make space for new questions on cyber insurance and supplier risks. The overall estimates of spending on cyber security had been relatively consistent across the years and we did not expect to see any measurable changes this year. The topics of cyber security skills and training are also dealt with in greater depth in a separate DCMS study published this year.
4.1 Identifying, managing and minimising cyber risks
Actions taken to identify risks
Over six in ten businesses (64%) and charities (61%) have taken at least one of the actions shown in Figure 4.1 in the last 12 months, to help identify cyber security risks. This means that around four in ten organisations have done none of these things.
The most common action is carrying out an internal or external audit – half of businesses (50%) and charities (49%) have done this. However, it is worth noting that, among the subset of organisations that have undertaken audits, around a fifth have only done a one-off internal audit and do not plan to make this a more regular activity. What constitutes an audit is something we explored in the qualitative research and is covered in the next section.
Investing in threat intelligence is far less common, with just one in ten businesses and charities having done so. Even among large businesses under two-fifths (37%) pay for threat intelligence.
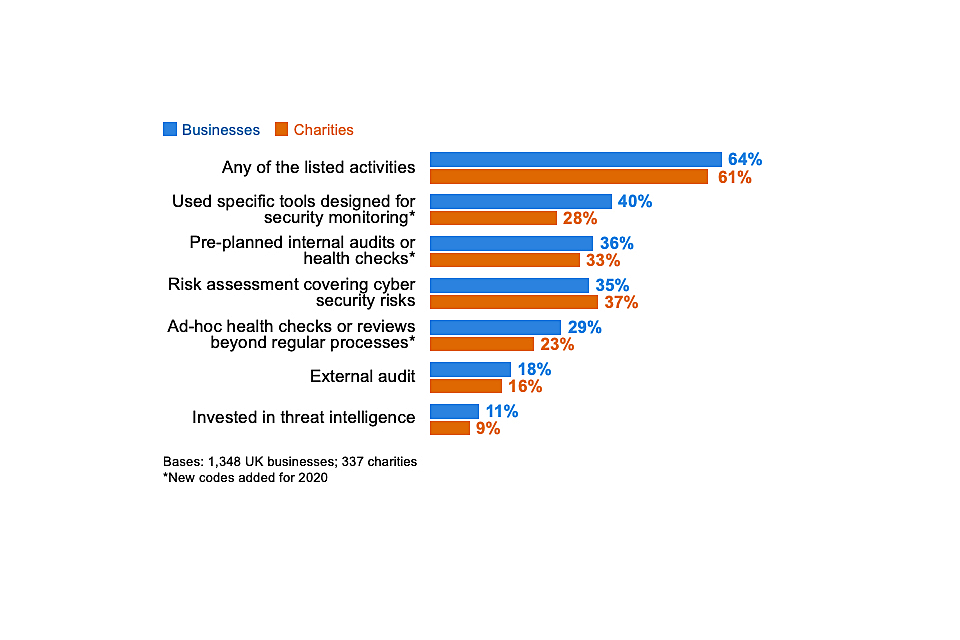
Figure 4.1: Percentage of organisations that have carried out the following activities to identify cyber security risks in the last 12 months
Finance or insurance firms (81%), and information and communications firms (77%) are also more likely than average (64%) to have taken any of these actions. At the other end, construction firms (42%) and those in the retail and wholesale sector (40%) were more likely than the average business (33%) to have done none of the actions in Figure 4.1.
When looking at sector differences, there is no indication that particular sectors tend to favour internal audits over external ones, or vice versa.
Some of the categories at this question have changed since the 2019 survey, so we cannot compare all the findings to previous years. Where it is possible to make comparisons, there are positive indications that both businesses and charities are taking more action than before to review their cyber security risks.
• the proportion of businesses carrying out cyber-related risk assessments has increased by 11 percentage points since 2018. The proportion of charities doing so has risen by 17 percentage points over this time.
• the proportions of businesses and charities investing in threat intelligence are each slightly higher than in 2018 (by 3 and 5 percentage points respectively)
How organisations undertake audits and implement their findings
The qualitative interviews add a wider context to the survey findings around audits. While half of all businesses (50%) and charities (49%) say they have undertaken audits covering cyber security risks, there is considerable variation in what this means in practice.
Several interviewees told us that their internal audits were relatively informal, in some cases amounting to annual conversations with accountants or IT providers, around the kinds of improvements that might be made to cyber security. This was especially the case in smaller organisations that did not have the expertise or time to carry out a more thorough audit. Some overcame this lack of internal expertise by getting IT consultants or their existing IT providers to carry out the audit, but there were also cases where interviewees who were not technical cyber security experts had done their own research and developed their own internal audit process.
More formalised and sophisticated audits tended to have more technical elements, which could range from scanning and patching software through to simulation attacks.
“If a security flaw has been announced for Windows or a browser or something, then I’ll read into what the patch is and then go around and do an audit of how the machines are affected, and make sure it’s all working.”
Medium business
These more formal approaches were often in instances where the audits were:
• carried out by insurance companies as part of a cyber insurance policy
• tied to maintaining external accreditations such as ISO 27001 or Cyber Essentials
• demanded and led by client organisations
Not all these audits focused solely on cyber security. Often, they were part of much broader annual financial audits led by external accountants, where the accountant would cover cyber risks as part of an overall assessment of the organisation’s sustainability. We also came across examples of broader data protection audits, and even health and safety audits, that covered aspects of cyber hygiene such as passwords in a light-touch way.
Any recommendations made off the back of audits typically made their way to management boards. Financial audits by external accountants generated an annual report that would be discussed at a board level. Internal audits that were technical in nature would often have an immediate response if they flagged any technical issues.
“Things are changed all the time. Anytime something is highlighted that could be an improvement, we action it and put it into the management system review.”
Medium business
However, this was not universal, especially when organisations lacked internal skills and expertise in cyber security. For example, reports produced by IT providers were sometimes treated as routine exercises that did not always get discussed or actioned.
Reviewing supplier risks
This year’s quantitative survey asks new questions to gauge whether organisations have considered the cyber security risks posed by their suppliers. This includes risks associated with:
• third-party access to an organisation’s systems
• suppliers storing the personal data or intellectual property of a client organisation
• phishing attacks, viruses or other malware originating from suppliers
Most organisations have not formally reviewed these risks before (Figure 4.2). This is also the case for most large firms.
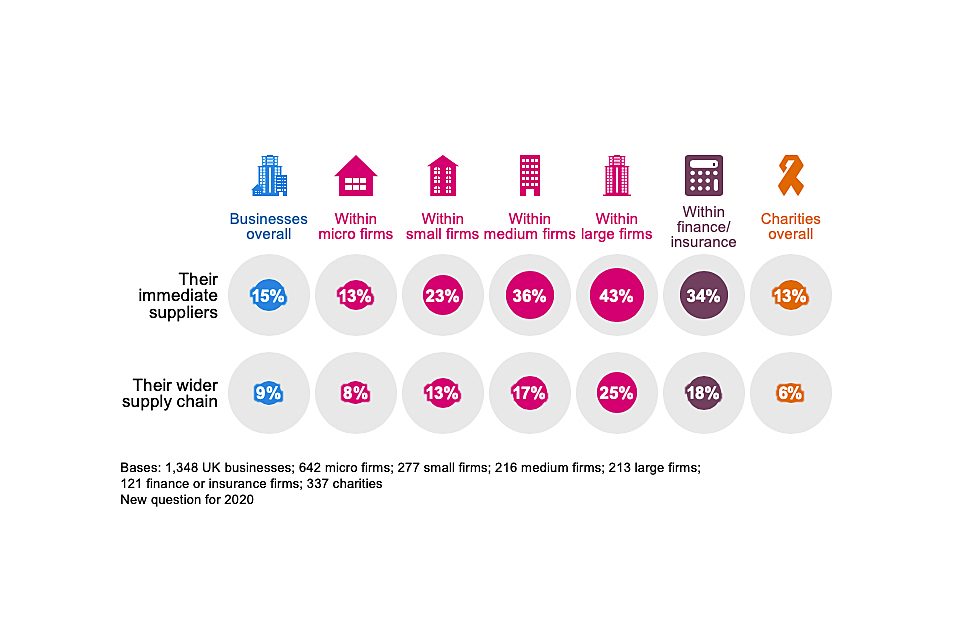
Figure 4.2: Percentage of organisations that have carried out work to formally review the potential cyber security risks presented by the following groups of suppliers
On various other indicators, such as the priority level applied to cyber security, high-income charities tend to resemble large businesses in their attitudes and behaviours. However, they appear further behind when it comes to supplier risks. Only a quarter of high-income charities have looked at risks from their immediate suppliers (27%, vs. 43% of large businesses) and only one in nine have looked at their wider supply chain (11%, vs. 25% of large businesses).
Businesses in the finance and insurance sector (34%) and information and communications sector (25%) are more likely than average (15%) to monitor immediate supplier risks. Finance and insurance businesses are also more likely than average to have reviewed their wider supply chains. However, it is still a minority of the businesses in these sectors that do so.
On the whole, supplier risks appear to be a more neglected aspect of cyber security. Even among the 40 per cent of businesses that say cyber security is a very high priority for their senior management, just a quarter (24%) have reviewed immediate supplier risks and a little over one in ten (14%) have reviewed risks for the wider supply chain.
Understanding of supplier risks
In the qualitative interviews, it was evident that many organisations had not discussed supplier risks before. This was even the case among organisations that took their own cyber security seriously and considered themselves to be following best practice.
We also came across a great deal of confusion on this topic. Interviewees tended initially to frame supplier risks very narrowly, in terms of IT providers, internet service providers and other digital service providers. From the point of view of interviewees, there was typically a binary divide between these types of suppliers and their wider, non-digital service suppliers. Many were unclear about how their own cyber security was linked to these wider suppliers.
As such, several interviewees did not see how the cyber security of these wider suppliers was their responsibility or concern.
On the other hand, for some of the charities we interviewed, the term “supplier risks” felt less relevant and too narrow. It did not encompass the wider network of organisations that many charities are likely to interact with digitally. For example, one charity highlighted that they worked in partnership with their local council and other charities. Through this partnership, they had personal data sharing agreements with these other organisations, but none of the parties was a straightforward supplier to the others.
Ultimately, the extent to which organisations recognised and took action around supplier-related cyber security risks depended on several broad factors:
• if suppliers handled personal data for the organisation in any way, it was typical for organisations to draw up rules and processes around this in formal contracts. Loss of personal data was seen as a more serious reputational risk and one that could incur fines
“We work with a lot of freelance artists. I’m not going to ask them to have the most wonderful cyber security provisions in place. But if I’m considering changes to my payroll provider then, yes, it is an issue.”
Small business
• if the products or services supplied were physical rather than digital, interviewees struggled to envisage any cyber security risks. In practice, even suppliers of physical goods and services may send across digital invoices, but this digital connection and associated risks had generally not been considered.
“A lot of our suppliers just provide medicines for patients, or chairs for our practice, so I don’t really see how that would pose a cyber security threat.”
Large business
• other supplier considerations often drowned out cyber security. This included things like price, quality and delivery time, as well as risks in other areas, such as health and safety, or safeguarding.
• interviewees from small organisations that lacked in-house IT or cyber security experts sometimes assumed that large suppliers would have better cyber security than them, because they would have bigger cyber security budgets. In these cases, they felt there was less of a need to examine their large suppliers.
The challenges of addressing supplier risks
In the qualitative research, interviewees highlighted several challenges that they faced when trying to address cyber security risks with suppliers and partners:
• small organisations often felt that they did not have enough leverage with large suppliers to enquire about their cyber security. One firm said that their suppliers would not give them access to their systems to carry out an audit. A lack of transparency from suppliers also made it hard for organisations to understand risks from their wider supply chain. Many did not know who their suppliers’ suppliers were and felt they had no way of knowing.
• there was also a sense in some interviews that organisations did not know what questions to ask their suppliers. One interviewee said it would be useful to have some best practice guidance for dealing with supplier risks.
• in some cases, there was a lack of centralised oversight of supplier relationships. For example, in one charity the fundraising team had set up an external contract with a printer to print and mail their magazine to their member list. This involved transferring personal data to the printer. It was unclear whether their IT manager had looked at this contract, because responsibility sat with the fundraising team.
• one organisation raised the issue of different partners having multiple security standards and not being flexible. This charity was trying to link its IT system with the local council, so they could make referrals to council services. However, their IT system did not meet the council’s security requirements. The charity’s Chief Executive was concerned that this impasse would increase risks, as people might end up circumventing the IT system entirely and making referrals from their personal emails.
4.2 Insurance against cyber security breaches
Which organisations are insured?
Previous surveys in this series have featured a different question measuring the prevalence of cyber security insurance. These have typically estimated that a small proportion of businesses – around one in ten – have specific cyber security insurance policies.
This year, the question wording has been changed significantly, to understand whether those who do not have a specific policy might still be covered for cyber security breaches, as part of a wider insurance policy. The changes to the question mean these results are not directly comparable to previous years. Nevertheless, they continue to show that specific cyber security policies are taken on only by a very small minority of organisations.
Around three in ten businesses (32%) and as many charities (31%) report being insured against cyber risks in some way. As Figure 4.3 shows, across all size bands, this is more likely to be through a broader insurance policy, rather than one that is cyber-specific.
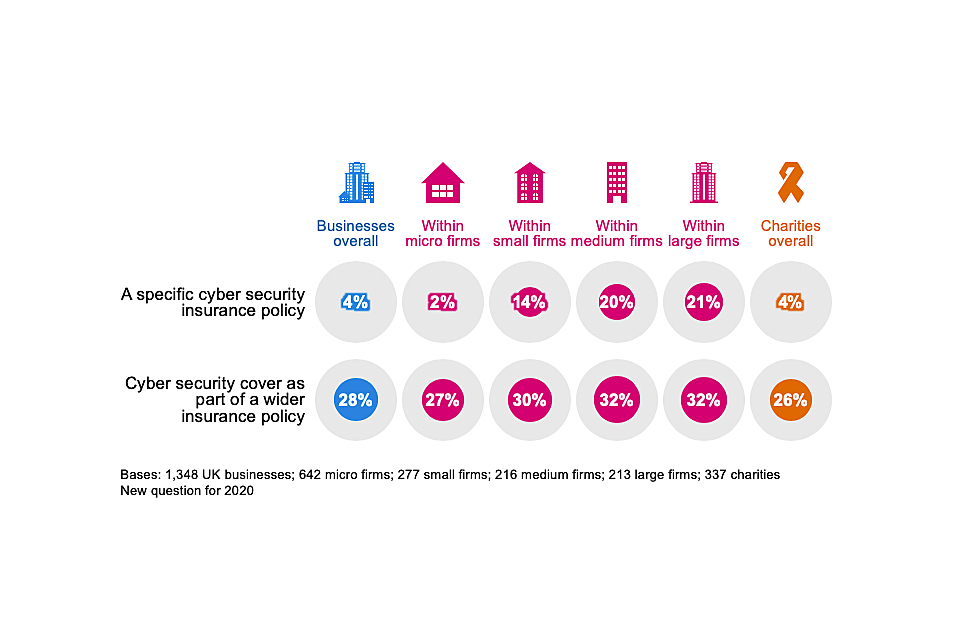
Figure 4.3: Percentage of organisations that have the following types of insurance against cyber security risks
As might be expected, insurance cover is more prevalent in the finance and insurance sector itself. Half of all finance and insurance firms have some sort of coverage against cyber security breaches (51%, vs. 32% overall). Even here, this is not a specific cyber security insurance policy in most cases (only 17% of these firms have a specific policy).
Making an insurance claim
Of those three in ten who have some form of cyber insurance, a very small proportion report having made an insurance claim (1% of businesses and 3% of charities).
In the qualitative interviews, we asked those with cyber insurance about the circumstances under which they would be prepared to make a claim. A common theme running across the responses was that there would need to be either significant disruption to the functioning of the organisation or an extreme financial cost. Examples raised included large fines or legal costs, ransomware attacks and servers being taken down for extended periods (e.g. more than a day).
What do insurance policies cover?
As another new question for 2020, we asked those who have relevant insurance policies to tell us what this coverage provides them with. This builds on the qualitative findings in the 2019 study – these suggested that organisations may be less interested in cyber insurance as a way to reclaim costs and more interested in the wider benefits that it brings, such as access to specialist cyber teams or reputation management following a breach.
Figure 4.4 shows that, among those that do have coverage, there are typically many wider benefits beyond simply being able to recover lost earnings, profits or data. The offer of legal support is especially common. In fact, in three-fifths of cases (59% of the businesses and 58% of the charities with insurance) the policy covers at least one of the following: incident response, reputation management or forensic analysis.
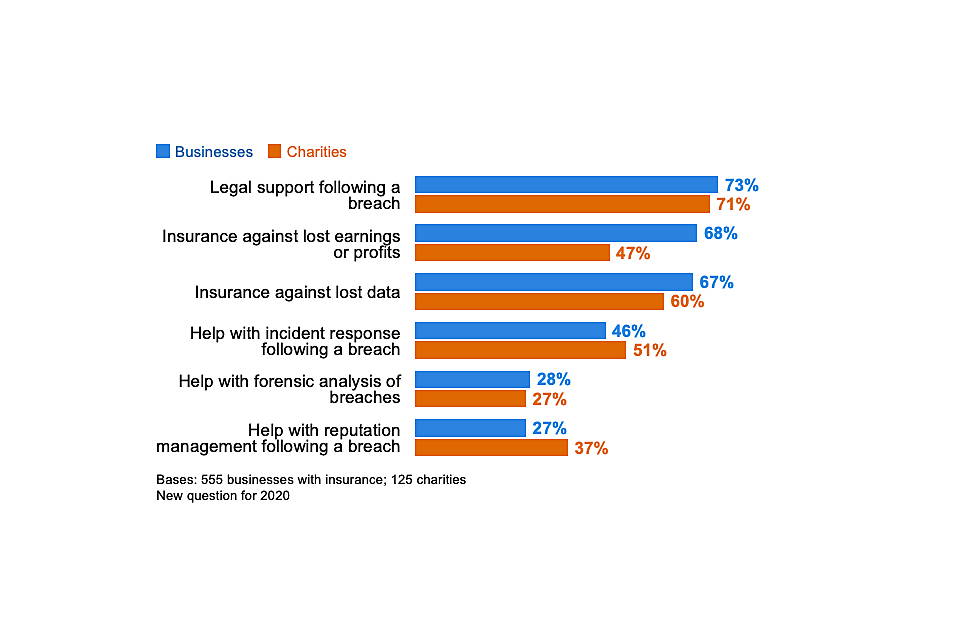
Figure 4.4: Percentage of organisations that have the following coverage through cyber insurance policies, among those that have any form of cyber insurance
It is worth noting that the “don’t know” responses for each of the categories in Figure 4.4 ranged from around two in ten to four in ten (e.g. 43% for forensic analysis). This highlights that individuals we interviewed – those most responsible for cyber security – in each organisation with insurance were often unaware of the actual contents of their cyber insurance policy. This may simply be a lack of awareness. However, it could also reflect that oversight of insurance lies elsewhere in the organisation (e.g. in finance teams rather than cyber teams) and that different teams are not joined up in this regard.
Why do organisations acquire cyber insurance?
Organisations that had standalone cyber security insurance policies tended to have more specific reasons for purchasing this insurance, compared to general business insurance that also covers cyber risks.
• there was a sense that bespoke cyber insurance offered fuller coverage. Some interviewees commented that the cyber security elements of broader business insurance packages had looser definitions or excluded certain types of breaches. For one business, this made them sceptical about being able to make a successful claim under general business insurance, which is why they took out bespoke cyber insurance policy.
“Hacking isn’t considered terrorism in our general insurance policy … The wording is much clearer, in terms of the risk cover, the profile and the definitions in the separate policy compared to the general one.”
Large business
• like last year, we came across bespoke cyber insurance being used as a proxy form of accreditation, which organisations could show to customers to demonstrate their cyber security credentials. Linked to this, organisations with this kind of cyber insurance often had to meet certain standards to qualify or to reduce their premiums. Examples included the Payment Card Industry Data Security Standard (PCI DSS), ISO accreditations, and having to carry out penetration testing to identify areas of risk.
• reflecting the data in Figure 4.4, interviewees also raised the wider benefits of cyber insurance, beyond the recovering the claimed amounts. Examples from different organisations included, getting access to cyber security specialists in the wake of a ransomware attack, getting access to legal support and also receiving general advice and guidance on cyber security from the insurance company.
By contrast, those that took out general business insurance and then added on cyber security cover tended to have looser motivations. A common theme was that organisations had simply followed the advice of their insurance brokers to take an insurance package that included cyber security coverage among other things. In some cases, the cyber security element had been bolted on in previous years and then simply renewed each year as part of the overall package.
4.3 Technical cyber security controls
Each year, the survey has asked whether organisations have a range of technical rules and controls in place to help minimise the risk of cyber security breaches. The full list is shown in Figure 4.5. Many of these are basic good practice controls taken from government guidance such as the 10 Steps to Cyber Security or the requirements of Cyber Essentials. Towards the end of this chapter, we map survey responses to these schemes to estimate how many organisations are operating in line with the guidance.
As Figure 4.5 indicates, the vast majority of businesses and charities have a range of basic rules and controls in place, including around software updates, malware protection, restricted IT admin rights, firewalls and password policies.
Backing up of data is also extremely common among businesses – nine in ten (89%) have backups either on cloud servers or elsewhere – but this is less common for charities (77%).
Charities are also less likely than businesses to have security controls on electronic devices or to restrict access to their own devices. This reflects the statistics from chapter 2, showing that use of personal devices has historically been much more common in the charity sector.
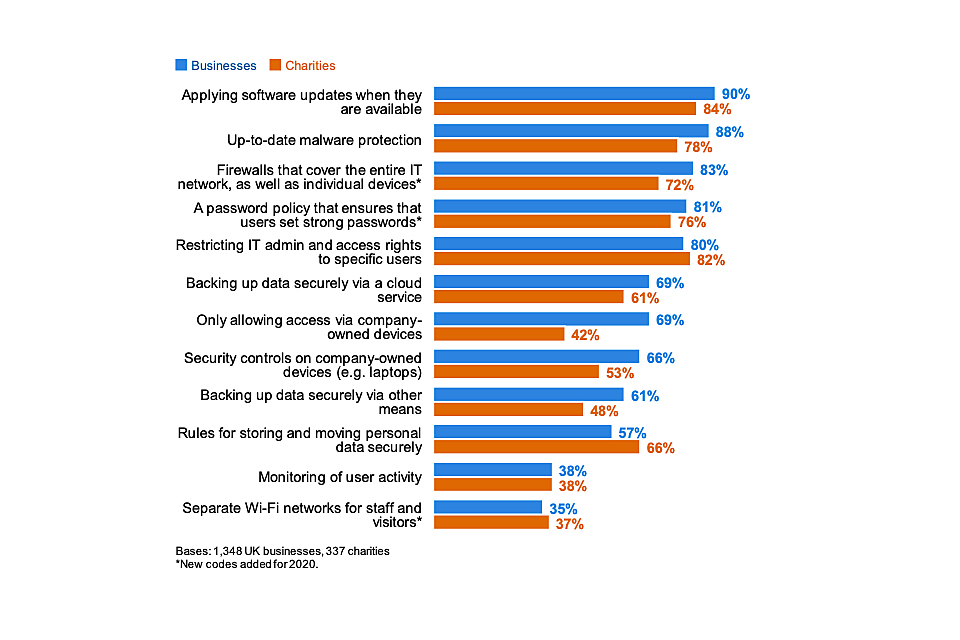
Figure 4.5: Percentage of organisations that have the following rules or controls in place
Businesses in the food and hospitality sector are among the least likely to have each of these rules or controls in place. For example, fewer say they have network firewalls in place (73%, vs. 83% of businesses overall) or have an appropriate password policy (72%, vs. 81% overall). Fewer than half have specific rules on storing and moving personal data (45%, vs. 57% overall).
Changes over time
Where it is possible to track changes over time (i.e. where the response wording has stayed the same), the pattern of responses in Figure 4.5 has been relatively consistent for businesses over the years of the survey. However, there has been a move towards cloud backups. In 2018, 58 per cent of businesses backed up data via the cloud, versus 69 per cent now. By contrast, the proportion backing up data via other means has fallen over that period (from 70% to 61%).
For charities specifically, several controls are applied more widely now than in 2018, including:
• regularly updating software (84%, vs. 75% in 2018)
• restricting IT admin rights (82% vs. 65%)
• cloud backups (61% vs. 38%)
• only allowing access via the organisation’s devices (42% vs. 32%)
In most cases, the greatest shifts were between the 2018 and 2019 surveys, tying into the period when GDPR came into force. Nevertheless, these results have continued to improve between 2019 and 2020.
Since 2019 (when this was first asked), more have also adopted rules around personal data storage and transfer (66% vs. 58%).
4.4 Staffing and outsourcing
Staff with formal responsibility for cyber security governance
Around four in ten businesses (43%) and half of charities (53%) have staff whose job role includes information security or governance (Figure 4.6), which highlights that the cyber security job role is potentially being performed informally across many organisations. This was also a major finding in DCMS’s recent cyber security labour market study, which estimated that just 11 per cent of businesses include cyber security in written job descriptions.
As Figure 4.6 shows, it is much more common in larger businesses, and those in finance and insurance, and information and communications sectors to assign this role to specific staff.
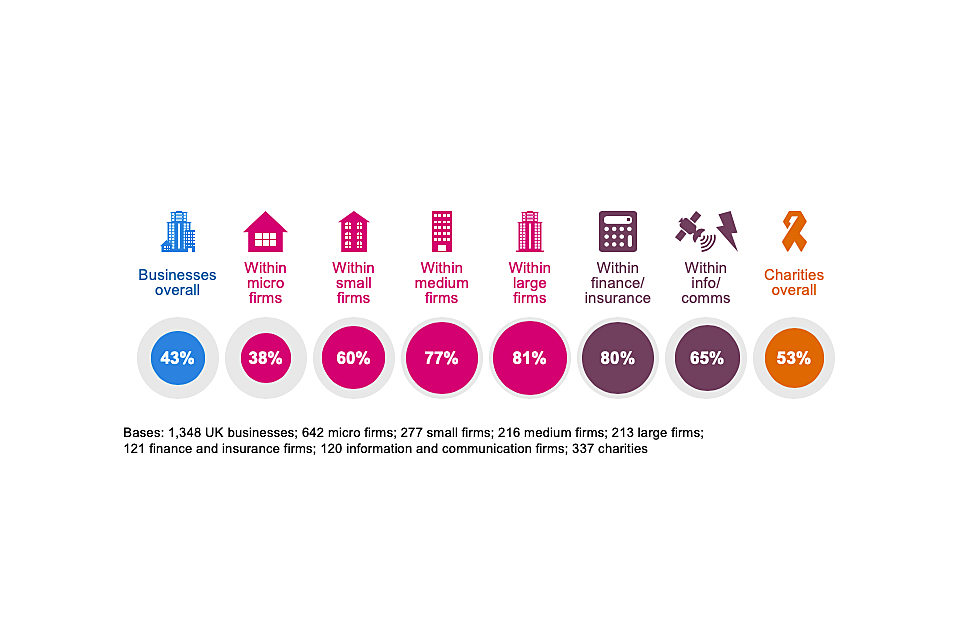
Figure 4.6: Percentage of organisation with staff whose job role includes information security or governance
Medium and large firms are again more likely than the average business to have specialist staff dealing with cyber security, as are specific sectors such as finance or insurance, information and communications, and health, social care or social work.
The proportions for businesses and charities are both in line with the 2019 results. This means that the increases from 2018 (when just 35% of businesses and 38% of charities had staff assigned this specific job role) have been maintained.
Board responsibilities
As Figure 4.7 shows, around two-fifths of businesses (37%) and just over two-fifths of charities (45%) have board members or trustees with a cyber security brief. As might be expected, this is much more common in larger organisations, where the management board is likely to be larger – in half of medium businesses (50%) and seven in ten large businesses (68%), there are board members overseeing cyber security.
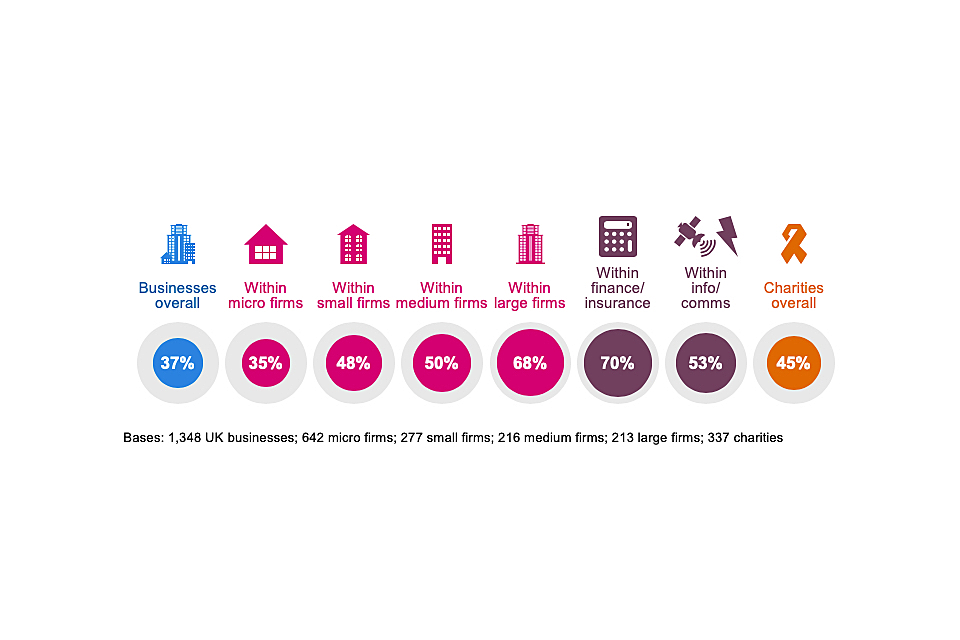
Figure 4.7: Percentage of organisations with board members or trustees that have responsibility for cyber security
Both finance and insurance firms (70%) and information and communications firms (53%) are more likely than average (37%) to have board members with a cyber security brief. Those in the construction and utilities and production sectors are among the least likely to do so (24% and 26% respectively).
Since 2016, the proportion of businesses where board members have a cyber security brief has increased. As Figure 4.8 shows, this long-term change is also seen among medium and large businesses – the ones most likely to have big management boards. For charities, the proportion is also higher than in 2018.
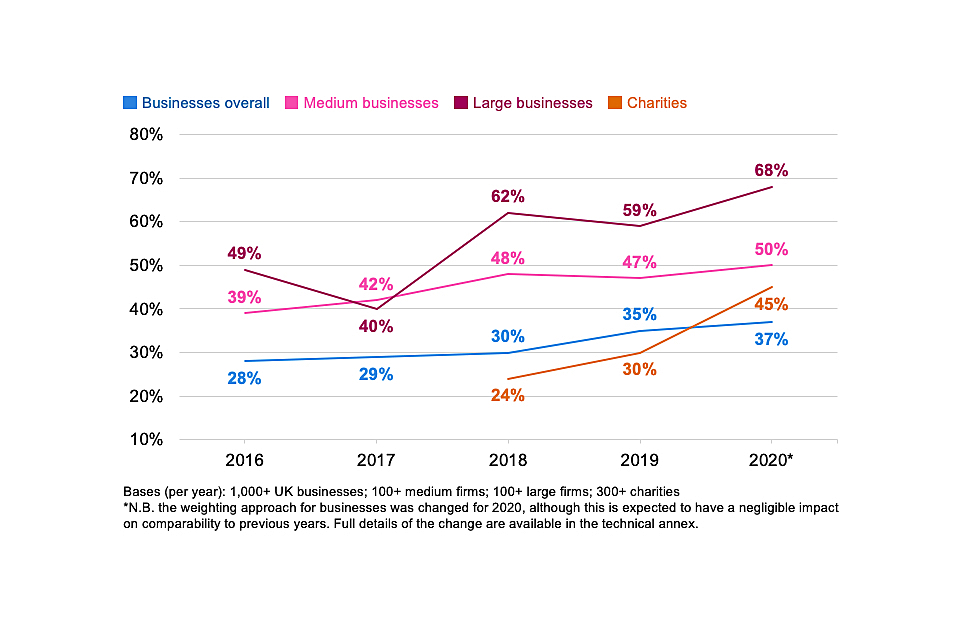
Figure 4.8: Percentage of organisations over time with board members or trustees with responsibility for cyber security
Outsourcing cyber security
Around four in ten businesses (39%) and one-third of charities (32%) have an external cyber security provider. As Figure 4.9 shows, outsourcing of cyber security is more common among small and medium businesses than others, and among finance and insurance businesses.
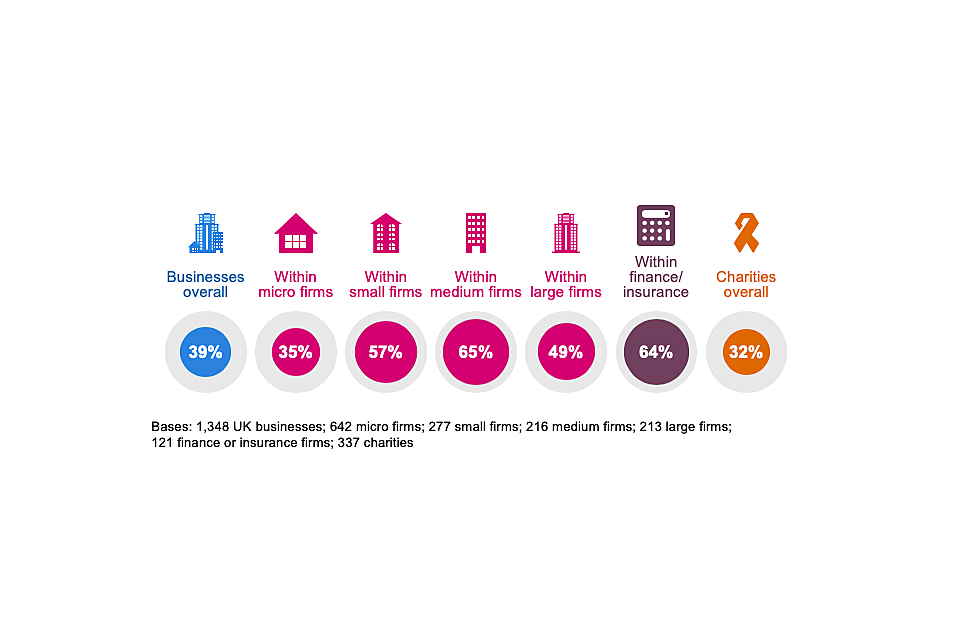
Figure 4.9: Percentage of organisations that have an external cyber security provider
This question has been asked on previous surveys in this series, but changes to similar questions in 2020 mean this finding is not comparable to earlier years. In terms of how this behaviour has changed over time, it is worth noting that DCMS’s recent cyber security labour market study showed an increase in the proportion of businesses outsourcing between 2018 and 2019 (from 30% to 42%).
4.5 Cyber security policies and other documentation
Do organisations formally document their approaches?
Around four in ten businesses (38%) and charities (42%) have a formal policy, or policies in place covering cyber security risks. Similar proportions have business continuity plans, as Figure 4.10 highlights.
It remains much rarer for micro and small businesses to have such documentation in place than it is for larger businesses. In terms of sectors, finance and insurance firms and health, social care and social work firms are more likely than average to have written policies (63% in each sector, vs. 38% overall). Finance and insurance firms are also more likely to have business continuity plans (82%, vs. 39% overall).
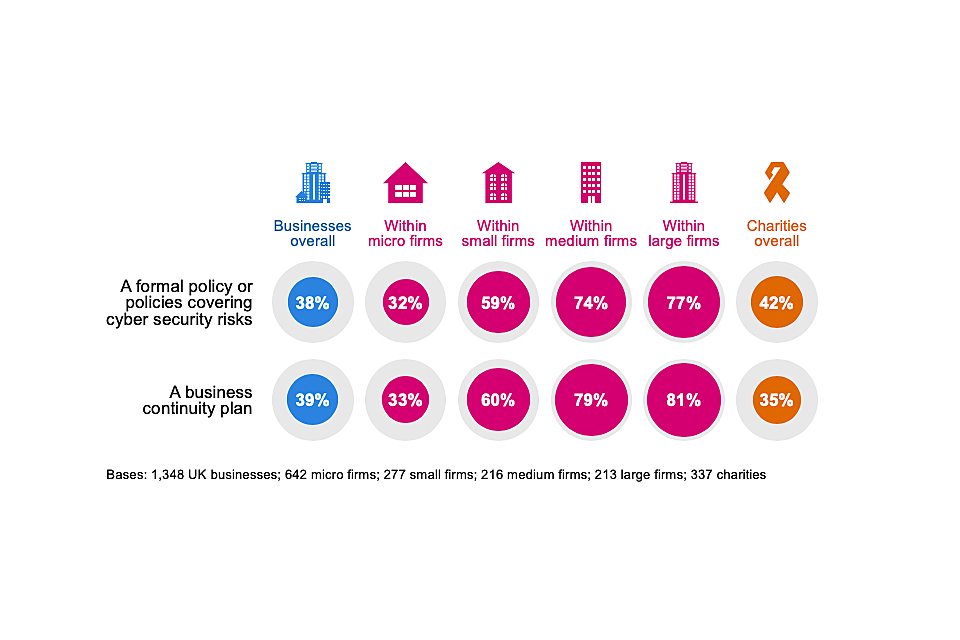
Figure 4.10: Percentage of organisations that have the following kinds of documentation
Changes over time
Since 2018, the proportion of businesses estimated to have a cyber security policy has consistently increased, from 27 per cent in 2018 and 33 per cent in 2019, to 38 per cent in 2020. Similarly, the charities result has also increased in this time (from 21% to 42%).
When were policies last reviewed?
Around half of all organisations who have cyber security policies in place reviewed their policies within the last six months (Figure 4.11). This is consistent across business size bands. Two-fifths of charities with policies reviewed them in the last six months.
Both these sets of findings are down from 2019, at which point 58 per cent of businesses and 56 per cent of charities said they had reviewed their policies in the previous six months. This change is likely to relate to GDPR. As the trend data at the start of this section show, there was a spike in the proportion of organisations creating cyber security policies in the wake of GDPR. This trend has continued but to a lesser extent. It is also probable that many organisations were prompted to review their documentation as a result of GDPR but have not been prompted as much to do this since then.
With that said, this drop-off is relatively small. It is still the case, with fieldwork for this survey over 18 months since GDPR came into force, that around eight in ten businesses and charities appear to be reviewing their policies at least annually.
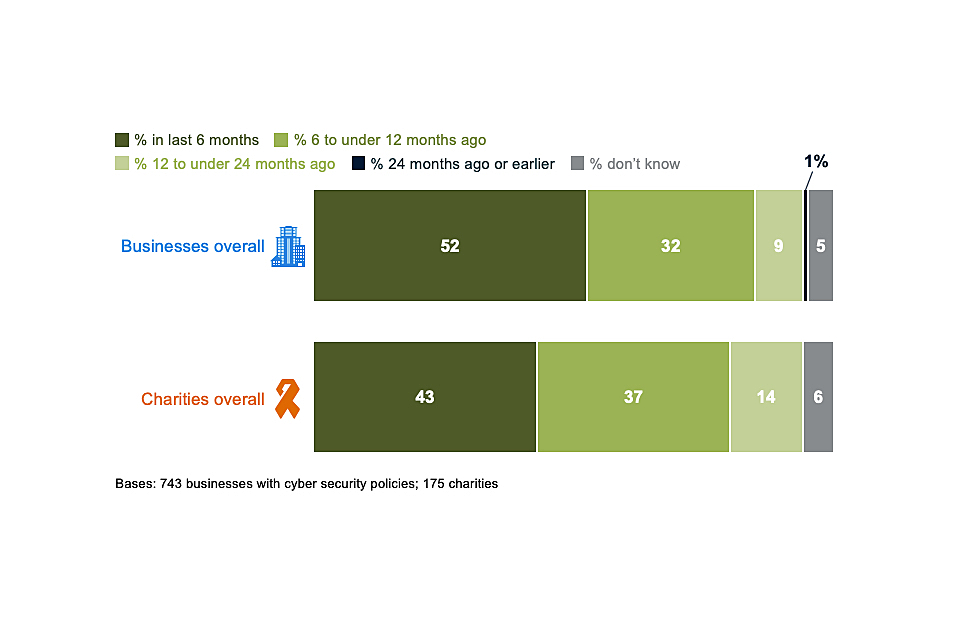
Figure 4.11: When organisations last created, updated or reviewed their cyber security policies or documentation, among those that have policies
What is covered in cyber security policies?
Organisations continue to have a range of features within their cyber security policies, such as appropriate use of IT, remote working and document management systems (Figure 4.12). Some of the less commonly mentioned aspects for both businesses and charities are data classification, cloud computing and what can be stored on removable devices.
The use of personally-owned devices for work activities is a more common feature in charities’ cyber security policies than it is for businesses. This reflects that charities, especially low-income charities, are more reliant than businesses on personal devices such as mobiles or laptops (covered in Section 2.3).
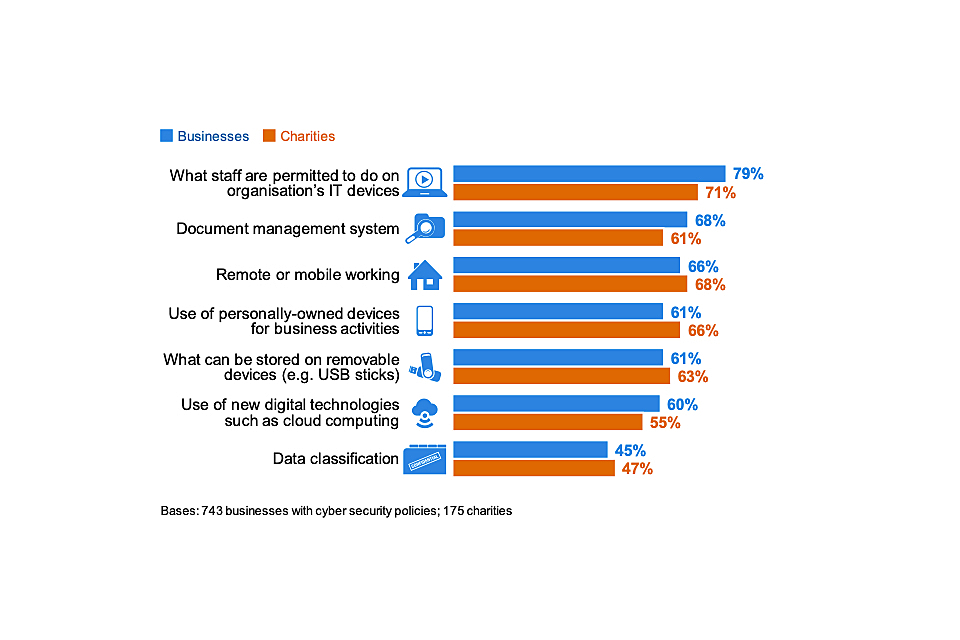
Figure 4.12: Percentage of organisations that have each of the following features in their cyber security policies, among those that have policies
There have been relatively small movements at this question since 2016. However, the long-term trend does suggest that more businesses are now covering cloud computing in cyber security policies (up from 52% in 2016 to 60% in 2020).
4.6 Implementing government initiatives
This section combines some of the individual results covered earlier in this chapter, to provide estimates showing how many businesses and charities are fulfilling the range of requirements laid out in two government initiatives: Cyber Essentials and the 10 Steps to Cyber Security.
Cyber Essentials
The government-endorsed Cyber Essentials scheme enables organisations to be independently certified for having met a good-practice standard in cyber security. Specifically, it requires them to enact basic technical controls across five areas: boundary firewalls and internet gateways, secure configurations, user access controls, malware protection, and patch management (applying software updates).
Regardless of whether they are aware of Cyber Essentials or not, over half of all businesses (51%) and two-fifths of charities (41%) say they have implemented technical controls in all five of these areas[footnote 8].
As in previous years, most organisations, particularly smaller ones, may not currently realise that they can receive Cyber Essentials certification for the measures they already have in place. As seen in Chapter 3, it is still only a small proportion (13% of businesses and 13% of charities) that are aware of the scheme.
10 Steps to Cyber Security
The government’s 10 Steps to Cyber Security guidance sets out a comprehensive risk management regime that both businesses and charities can follow to improve their cyber security standards. These steps have been mapped to several specific questions in the survey (in Table 4.1). This is not a perfect mapping but gives an indication of whether organisations have taken action in relevant areas.
Table 4.1 below brings these findings together. In line with previous years, while most organisations have certain technical controls such as secure configurations, firewalls and malware protection, they are less likely to have formal cyber security policies – particularly ones covering home working or what can be stored on removable devices. However, as covered earlier in this chapter, the proportion that do have policies has risen consistently since 2018.
Table 4.1: Percentage of organisations undertaking action in each of the 10 Steps areas
| | Step description – and how derived from the survey | Businesses | Charities |
|---|---|---|---|
| 1 | Information risk management regime – formal cyber security policies and the board are kept updated on actions taken | 35% | 39% |
| 2 | Secure configuration – organisation applies software updates when they are available | 90% | 84% |
| 3 | Network security – network firewalls (response option wording changed in 2020) | 83% | 72% |
| 4 | Managing user privileges – restricting IT admin and access rights to specific users | 80% | 82% |
| 5 | User education and awareness – formal policy covers what staff are permitted to do on the organisation’s IT devices (definition changed in 2020)[footnote 9] | 30% | 30% |
| 6 | Incident management – any incident management process (response option wording changed in 2020) | 68% | 73% |
| 7 | Malware protection – up-to-date malware protection | 88% | 78% |
| 8 | Monitoring – monitoring user activity or using security monitoring tools (definition changed in 2020)[footnote 10] | 57% | 49% |
| 9 | Removable media controls – policy covers what can be stored on removable devices | 23% | 27% (vs. 19% in 2019) |
| 10 | Home and mobile working – policy covers remote or mobile working | 25% (vs. 20% in 2019) | 29% (vs. 23% in 2019) |
Seven in ten businesses (69%) and six in ten charities (63%) have implemented five or more of the 10 Steps as Figure 4.13 shows. Around one in ten businesses (12%) and just over one in ten charities (14%) have undertaken all 10 Steps. Large businesses are the most likely to have implemented all 10 Steps (42%, vs. 12% overall).
As some of the answer categories that feed into these 10 Steps have changed substantively since the 2019 survey, we cannot make a direct comparison to previous years.
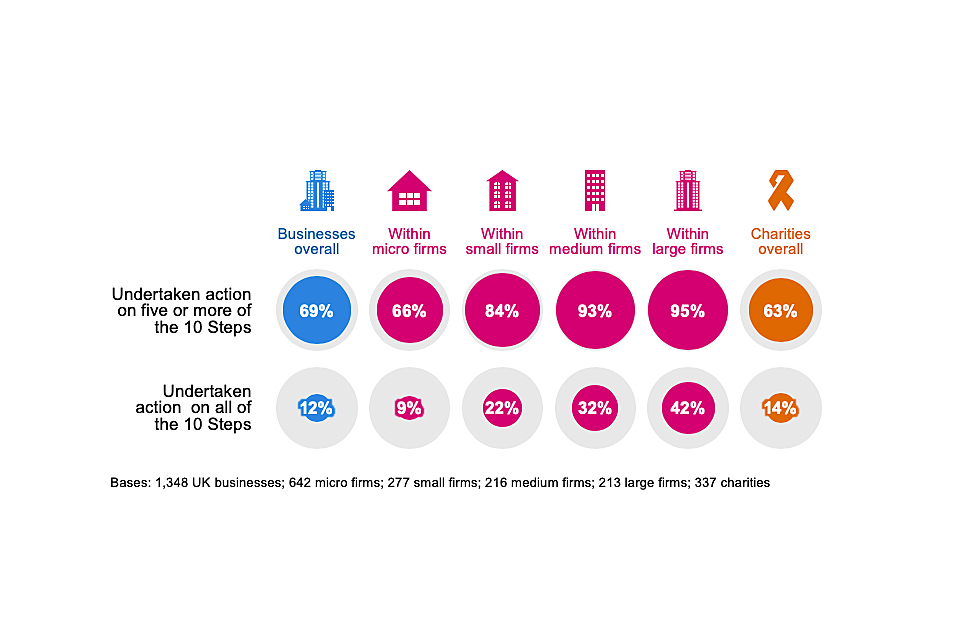
Figure 4.13: Percentage of organisations that have undertaken action in half or all the 10 Steps guidance areas
Chapter 5: Incidence and impact of breaches or attacks
This chapter explores the nature, extent and impact of cyber attacks and other cyber security breaches on organisations over the past year. We also provide broad estimates of the financial cost of these breaches or attacks.
Across these findings, the survey aims to account for all the types of breaches or attacks that organisations might face. This includes accidental breaches, as well as ones perpetrated intentionally. It also includes recorded cyber attacks that did not necessarily get past an organisation’s defences (but attempted to do so). We do, nevertheless, isolate and discuss the cases that had a material outcome, such as a loss of money, assets or other data.
It is important to remember that the survey can only measure the breaches or attacks that organisations have themselves identified. There are likely to be hidden attacks, and others that go unidentified, so the findings reported here may underestimate the full extent of the problem.
The findings in this chapter are not comparable with those from the 2016 survey, due to significant changes in the types of breaches or attacks being recorded from 2017 onwards.
5.1 Experience of breaches or attacks
Almost half of businesses (46%) and a quarter of charities (26%) report having any kind of cyber security breach or attack in the last 12 months.
We calculate these percentages by merging together the proportions that identified any of the different types of breaches or attacks mentioned in the survey. In previous years, this has included denial-of-service attacks. This category was omitted from the survey script this year. However, based on testing of previous years’ data, the impact of this omission on the wider data and trends is expected to be negligible[footnote 11]. In previous years, there were only ever a handful of organisations that identified denial-of-service attacks as their only type of cyber security breach.
As Figure 5.1 illustrates, larger businesses are more likely to identify breaches or attacks than smaller ones – this has been a consistent pattern in each year of the survey. Charities follow the same pattern, with 57 per cent of high-income charities (with incomes of £500,000 or more) recording any breaches or attacks.
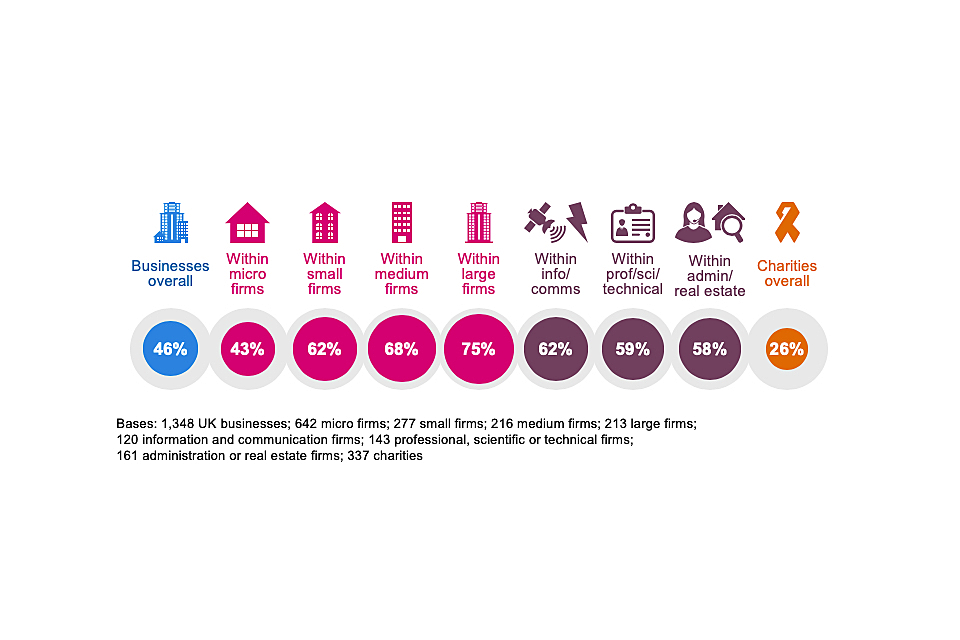
Figure 5.1: Percentage of organisations that have identified breaches or attacks in the last 12 months
The chart also highlights sectoral differences, with information and communications businesses, professional, scientific and technical businesses, and administration and real estate firms all more likely than average to have identified breaches or attacks.
The information and communications sector has, across each year of the survey, consistently stood out as more likely to identify breaches. The heavily digitised nature of this sector means it is typically more exposed to cyber security risks. At the same time, this difference could also partly be down to the fact that this sector strongly prioritises cyber security (see Chapter 3) and tends to take more action to be able to identify breaches.
As in previous years, businesses that hold personal data are more likely than average to have experienced breaches or attacks (55% versus 46% overall), highlighting the importance of protecting this information.
Types of breaches or attacks experienced
Figure 5.2[footnote 12] shows the types of breaches and attacks that organisations experience. The most common type of cyber attacks by far are phishing attacks – staff receiving fraudulent emails or being directed to fraudulent websites. This is followed, to a much lesser extent, by impersonation and then viruses or other malware.
One of the consistent lessons across this series of surveys has been the importance of staff vigilance, given that the vast majority of breaches and attacks being identified are ones that will come via them.
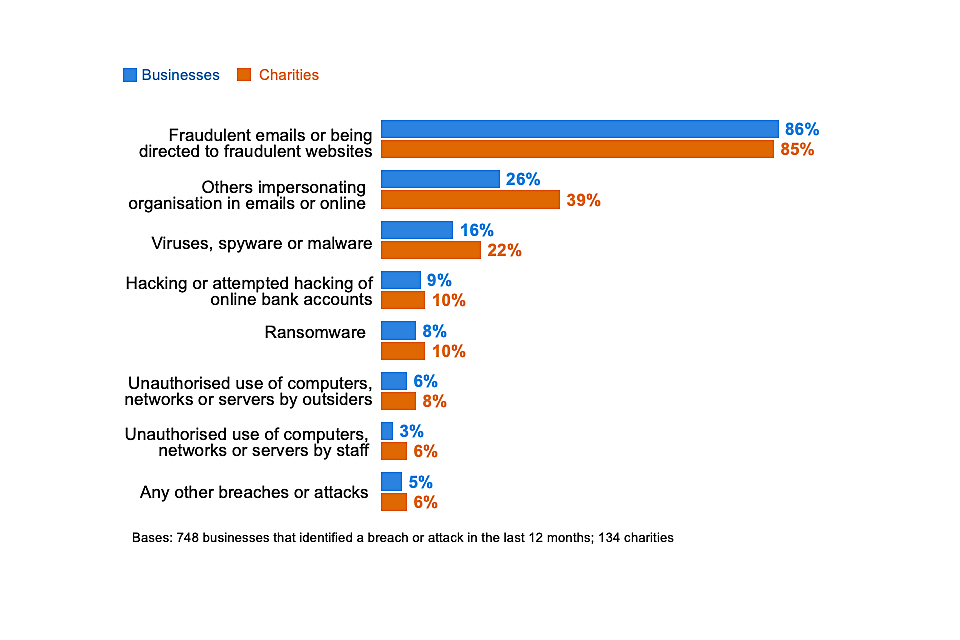
Figure 5.2: Percentage that have identified the following types of breaches or attacks in the last 12 months, among the organisations that have identified any breaches or attacks
This broad pattern is similar across size bands and sectors. However, among the medium and large businesses that have identified any breaches or attacks, they are more likely to experience a wider range of attacks. For example, around a third of the medium businesses (33%) and large businesses (35%) that identify any breaches or attacks pick out three or more categories from Figure 5.2 (vs. 13% overall). Specifically, they are more likely to experience:
• impersonation (62% of medium firms and 62% of large firms, vs. 26% overall)
• viruses or malware (27% and 25%, vs. 16% overall)
• ransomware (14% and 16%, vs. 8% overall)
• unauthorised use of computers or networks by staff (9% and 12%, vs. 3% overall)
Changes over time
The 2019 report discussed the drop in reported breaches and attacks seen across businesses between 2018 and 2019 (from 43% to 32%). This year, the incidence of breaches or attacks on businesses (46%) has reverted to similar levels seen in both 2018 (43%) and 2017 (46%). In other words, the long-term trend suggests that this incidence has been relatively consistent.
The various possible explanations for the drop in 2019 included:
• improvements to businesses’ cyber security as a result of the General Data Protection Regulation (GDPR) leading to fewer attacks
• a change in attacker behaviour
• a possible change in the way businesses understood a “cyber security breach or attack” in light of GDPR (which may have shifted the focus to breaches involving personal data)
These potential explanations still hold, but the longer trend suggests that the threat to businesses is constant, rather than falling over time.
For charities, the three years of data show a gradually rising incidence, from 19 per cent in 2018 and 22 per cent in 2019, to 26 per cent in 2020. In this case, the rise fits with the increasing engagement with cyber security that charities have shown since 2018, and the fact that more have taken actions to identify cyber risks (discussed in Chapters 3 and 4). It is, therefore, likely that this is not simply an increase in the number of charities being targeted, but that charities are now paying more attention to breaches or attacks and are better at identifying them.
The top three types of attacks have remained consistent since 2017, in line with Figure 5.2. However, there have been significant changes over the past four years that suggest an evolution in the mix of breaches that organisations are experiencing – moving away from malware and more towards fraud. For example, among the businesses identifying any breaches or attacks, from 2017 to 2020 there has been:
• a rise in phishing attacks (from 72% to 86%)
• a fall in viruses or other malware (from 33% to 16%)
• a fall in ransomware (from 17% to 8%)
It is worth noting that our fieldwork for the 2017 survey was before the WannaCry ransomware attack in May of that year, which affected many UK organisations. Therefore, the 17 per cent finding for 2017 is not a one-off spike in the data.
Nevertheless, this is not a clear-cut change. Fraudulent emails and websites often involve malicious code as well (e.g. viruses or ransomware contained in attachments or web pages). All these categories are, to an extent, overlapping.
5.2 The breaches and attacks considered most disruptive
Among the 46 per cent of businesses and 26 per cent of charities that have experienced breaches or attacks in the past 12 months, phishing attacks are considered by far the most disruptive types of attack that organisations face (Figure 5.3).
It is worth noting that the trends over time for this question are similar to those for Figure 5.2. That is, businesses are now more likely to say that their single most disruptive breach or attack was a phishing attack than in 2017 (67% vs. 43%). They are less likely to say it was a virus or malware attack than in 2017 (7% vs. 20%). This might indicate that it is the fraud aspect of phishing attacks, rather than the risks from malicious code (e.g. from email attachments), that are being considered more disruptive to work flows.
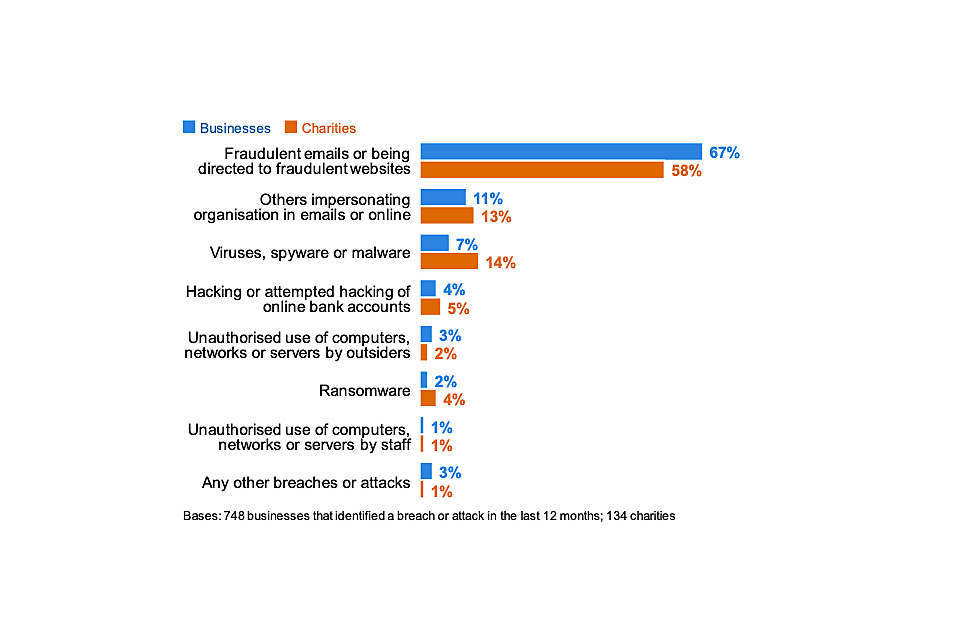
Figure 5.3: Percentage that identify the following types of breaches or attacks as their most disruptive one, among the organisations that have identified breaches or attacks in the last 12 months
5.3 Frequency of breaches or attacks
It remains uncommon for businesses and charities to find breaches or attacks occurring more than once a month (Figure 5.4). The overall pattern of the frequency of breaches or attacks is similar to 2019.
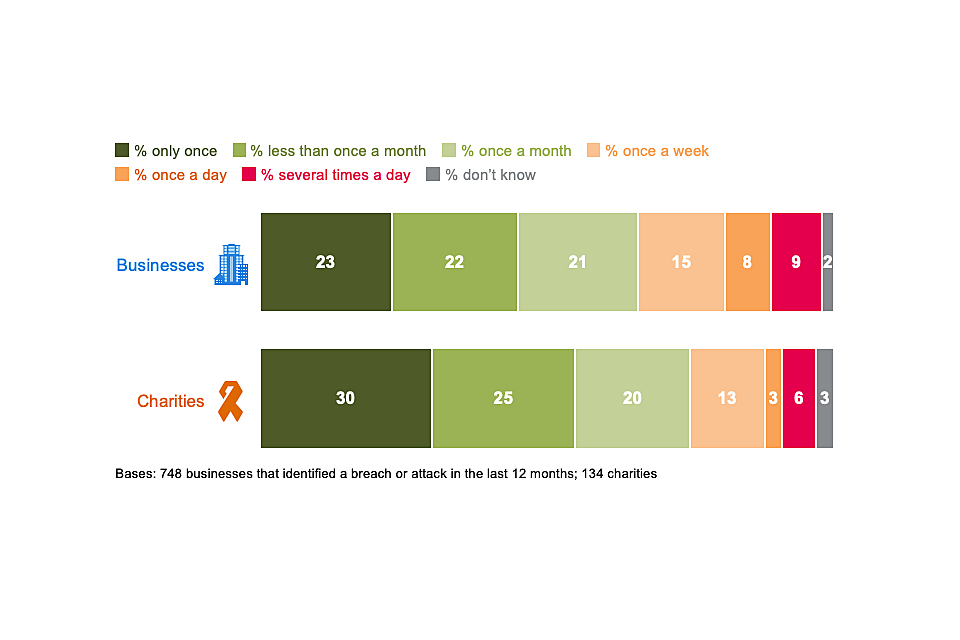
Figure 5.4: How often organisations have experienced breaches or attacks experienced in the last 12 months
Looking at the longer-term trend over time, it is clear that fewer businesses are experiencing breaches or attacks as one-off events over the course of a year. In 2017, 37 per cent of the businesses identifying breaches or attacks could only recall one instance in the previous 12 months. This was 30 per cent in 2018 and 26 per cent in 2019, compared with 23 per cent now.
Conversely, more businesses say in 2020 that they experience these issues at least once a week (32%, vs. 22% in 2017). There is a similar pattern over time for charities (first surveyed in 2018), although the changes across years are not statistically significant. In 2020, a fifth of these charities (22%) say they experience breaches at least once a week.
5.4 How are businesses affected?
Outcomes of breaches or attacks
Not all breaches or attacks lead to a negative consequence, in terms of a loss of money or data. As Figure 5.5 illustrates, among the 46 per cent of businesses that identify breaches or attacks, one in five (19%) experience such an outcome. Among the 26 per cent of charities identifying breaches or attacks, only a quarter (25%) of these have these kinds of outcomes.
In previous years, this question has included an additional response category to measure websites or online services being taken down or slowed. A total of 10 per cent of the businesses and 9 per cent of the charities identifying breaches or attacks mentioned this outcome in 2019. This category was omitted from the survey script this year. If this category had been included, we expect that the proportion of businesses and charities citing any listed outcome would have been c.4 to 5 percentage points higher, based on past trends.
Types of outcomes that businesses and charities experience
Temporary loss of access to files or networks, damaged software or systems, and lost money are the most commonly reported outcomes. A permanent loss of data is much less common, which might be expected given that 89 per cent of businesses and 77 per cent of charities back up their data in some way (as noted in Chapter 4).
Certain types of breaches or attacks are more likely to result in these kinds of negative outcomes. Broadly, businesses that face the less common types of breaches or attacks, including viruses or ransomware, hacking attempts or other unauthorised use of their computers or networks, are much more likely than average to experience a negative outcome as a result (54%, vs. 19% overall). This means that while these kinds of breaches are rarer, the damage they can inflict on organisations is more significant. They still, therefore, represent a significant threat for all organisations to consider, alongside more common threats like phishing emails.
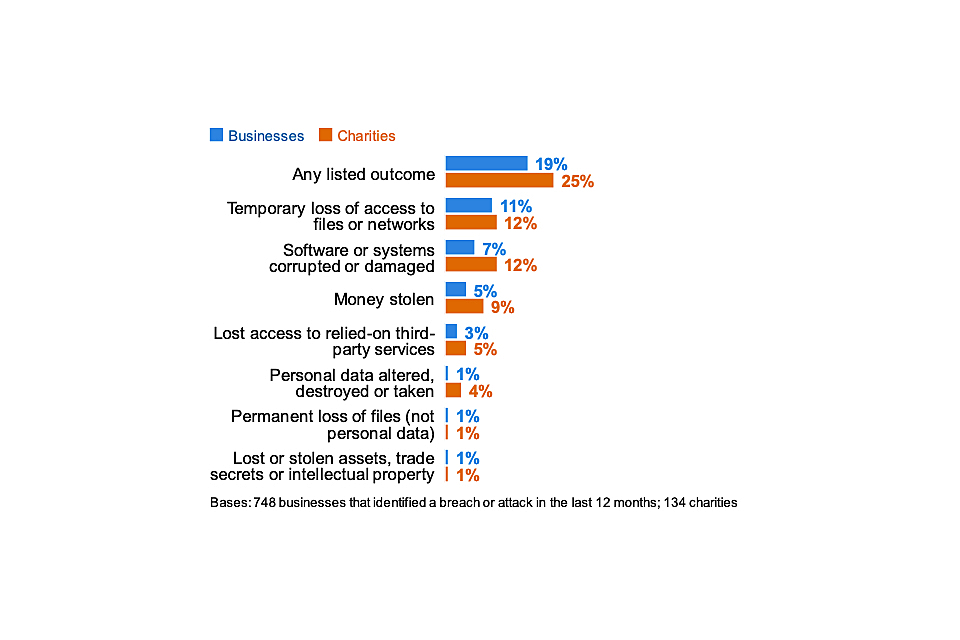
Figure 5.5: Percentage that had any of the following outcomes, among the organisations that have identified breaches or attacks in the last 12 months
These outcomes are all more prevalent among non-micro businesses. Among those that have identified any breaches or attacks, 27 per cent of non-micro businesses had some sort of negative outcome from these (vs. 16% of micro businesses).
Nature of the impact
Even breaches that do not result in negative financial consequences or data loss can still have an impact on organisations. Four in ten businesses (39%) and over half of charities (56%) that have had breaches or attacks report being impacted in one of the ways noted in Figure 5.6.
Most commonly, breaches or attacks lead to organisations having to take up new measures to prevent or protect against future cases, staff time being taken up to deal with the breach or day-to-day work being held up.
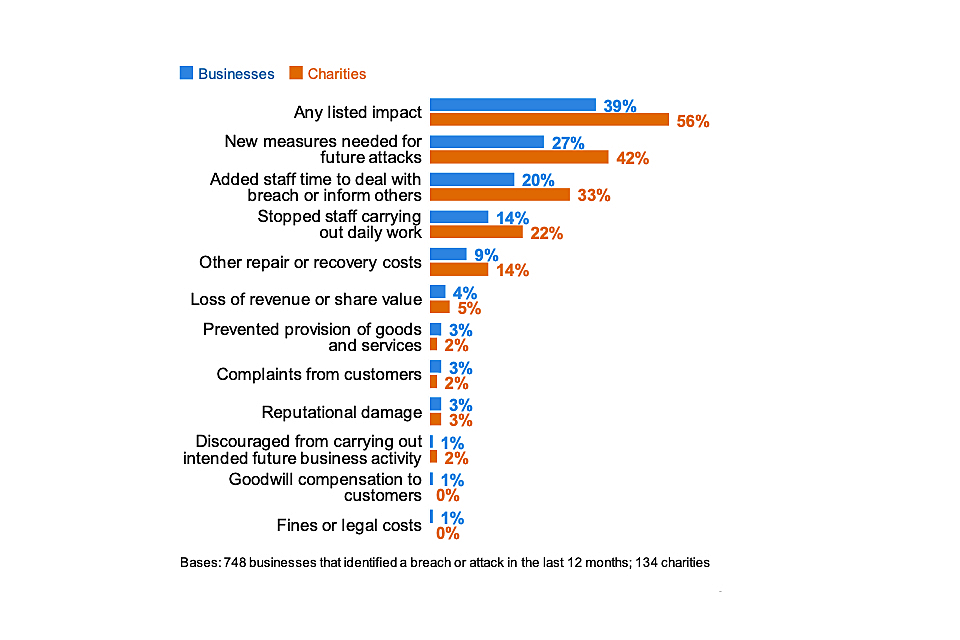
Figure 5.6: Percentage that were impacted in any of the following ways, among the organisations that have identified breaches or attacks in the last 12 months
As in previous years, the time impact is most substantial for large businesses – 41 per cent say they needed extra staff time to deal with breaches (vs. 20% of all businesses facing breaches or attacks) and 25 per cent report lost productivity among staff, from being unable to carry out their work (vs. 14% overall).
Time taken to recover from the most disruptive breach or attack
The vast majority of businesses (90%) and charities (89%) restore operations from their most disruptive breach or attack within 24 hours. Furthermore, seven in ten businesses (72%) and charities (68%) say it took no time at all to recover, shown in Figure 5.7.
However, for businesses that experience breaches or attacks with a material outcome (as discussed at the start of this section), the situation is different. In these cases, 41 per cent of businesses take a day or more to recover, or say they have not yet recovered at all (vs. 9% of businesses having any kinds of breaches or attacks, including those without outcomes).
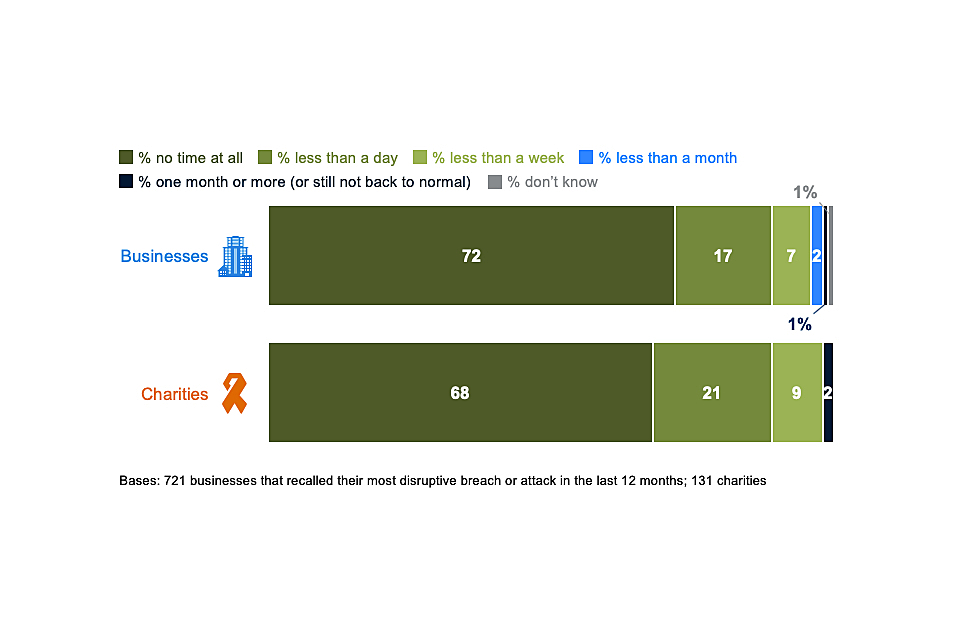
Figure 5.7: How long it took organisations to restore operations back to normal after their most disruptive breach or attack was identified
Changes over time
Across the data discussed in this section – on outcomes, impacts and time taken dealing with breaches or attacks – the trends over time suggest that organisations are becoming more resilient to cyber security breaches. Figure 5.8 illustrates this among the 46 per cent of businesses that identified any breaches or attacks. For charities, there is also a downward trend for each of these measures since 2018 although the changes are not statistically significant.
We have revised the trend data on outcomes to exclude instances of “websites or online services being taken down or slowed”. This category was omitted from the 2020 survey script. Taking it out from the past data ensures we are making a like-for-like comparison across years.
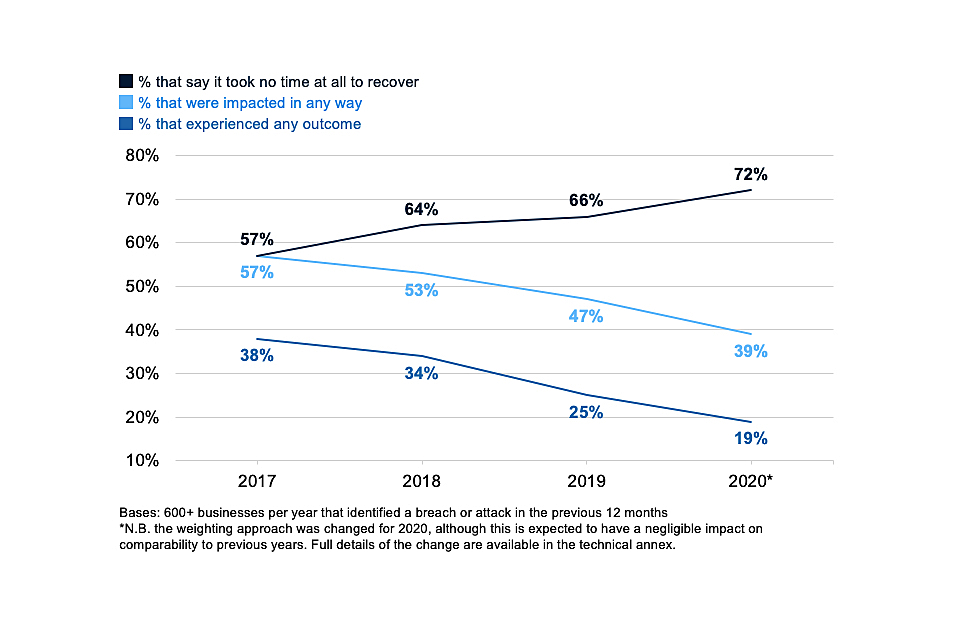
Figure 5.8: Percentage of businesses over time that have been affected by breaches or attacks in the following ways, among those that have identified any breaches or attacks in the last 12 months
It is important to note that these trends may have been affected by the omission of denial-of-service attacks from this year’s survey script. Very few organisations have experienced these kinds of breaches or attacks in past years – among those that identified any breaches or attacks in the 2019 survey, nine per cent of businesses and seven per cent of charities had faced denial-of-service attacks. However, these are more likely to be high-impact attacks, for example if they prevent customers from reaching an organisation online.
It is not possible to know the extent to which this omission changes the survey data for sure. Nevertheless, we still broadly conclude that the downward trends in Figure 5.8 are real, because they reflect a gradual change across multiple years, and because other outcomes and impacts not associated with denial-of-service attacks have also diminished.
5.5 Financial cost of breaches or attacks
Overall cost of breaches or attacks
Table 5.1 shows the estimated costs businesses incurred from all breaches over the past 12 months. When considering the cost, organisations are asked to bear in mind all the potential impacts mentioned in Figure 5.6.
As in previous years, the median cost is typically £0 across businesses and charities. This implies that, typically, organisations incur no specific financial cost from breaches or attacks. It reflects the fact that most breaches or attacks do not have any material outcome (a loss of assets or data), so do not always need a response.
When filtering down only to breaches with a material outcome, median costs tend to be higher.
Table 5.1: Average cost of all breaches or attacks identified in the last 12 months[footnote 13]
| | All businesses | Micro/small businesses | Medium/large businesses | All charities |
|---|---|---|---|---|
| Across organisations identifying any breaches or attacks | ||||
| Mean cost | £1,010 | £919 | £3,070 | £1,560 |
| Median cost | £0 | £0 | £0 | £0 |
| Base | 710 | 432 | 278 | 129 |
| Only across organisations identifying breaches with an outcome | ||||
| Mean cost | £3,230 | £3,110 | £5,220 | Too few |
| Median cost | £274 | £244 | £935 | charities to analyse |
| Base | 160 | 88 | 72 |
Costs associated with the most disruptive breaches
Tables 5.2 to 5.4 show cost estimates for the single most disruptive breach that organisations have identified in the last 12 months. Again, these are presented for all breaches, as well as those with an actual outcome, such as a loss of assets or data. Direct, recovery and long-term cost estimates all tend to be higher for larger businesses, which is a pattern consistent with previous years.
Direct costs, as defined in the survey, include the cost of:
• staff being prevented from carrying out their work
• lost, damaged or stolen outputs, data, or assets
• lost revenue if customers could not access online services.
Table 5.2: Average direct cost of the most disruptive breach or attack from the last 12 months
| | All businesses | Micro/small businesses | Medium/large businesses | All charities |
|---|---|---|---|---|
| Across organisations identifying any breaches or attacks | ||||
| Mean cost | £602 | £580 | £1,090 | £661 |
| Median cost | £0 | £0 | £0 | £0 |
| Base | 688 | 421 | 267 | 126 |
| Only across organisations identifying breaches with an outcome | ||||
| Mean cost | £2,350 | £2,340 | £2,470 | Too few |
| Median cost | £0 | £0 | £253 | charities to analyse |
| Base | 150 | 83 | 67 |
Recovery costs, as per the survey, include:
• additional staff time needed to deal with the breach or to inform customers or stakeholders
• costs to repair equipment or infrastructure
• any other associated repair costs
Table 5.3: Average recovery cost of the most disruptive breach or attack from the last 12 months
| | All businesses | Micro/small businesses | Medium/large businesses | All charities |
|---|---|---|---|---|
| Across organisations identifying any breaches or attacks | ||||
| Mean cost | £238 | £216 | £726 | £388 |
| Median cost | £0 | £0 | £0 | £0 |
| Base | 691 | 422 | 269 | 126 |
| Only across organisations identifying breaches with an outcome | ||||
| Mean cost | £860 | £831 | £1,310 | Too few |
| Median cost | £0 | £0 | £0 | charities to analyse |
| Base | 150 | 83 | 67 |
As defined in the survey, the long-term cost of breaches includes:
• the loss of share value
• loss of investors or funding
• long-term loss of customers
• costs from handling customer complaints
• any compensation, fines or legal costs
The typical (median) long-term cost estimates, even for breaches with material outcomes, are £0. This does not necessarily imply that most businesses do not incur any long-term costs from breaches. It may instead suggest that only some are really considering the wider potential costs of breaches. Other organisations may be underestimating the full impact, in terms of costs such as lost business or reputational damage.
Table 5.4: Average estimated long-term cost of the most disruptive breach or attack from the last 12 months
| | All businesses | Micro/small businesses | Medium/large businesses[footnote 14] | All charities |
|---|---|---|---|---|
| Across organisations identifying any breaches or attacks | ||||
| Mean cost | £346 | £324 | £812 | £54 |
| Median cost | £0 | £0 | £0 | £0 |
| Base | 689 | 423 | 266 | 128 |
| Only across organisations identifying breaches with an outcome | ||||
| Mean cost | £1,220 | £1,260 | £67 8 | Too few |
| Median cost | £0 | £0 | £0 | charities to analyse |
| Base | 151 | 84 | 67 |
Changes over time
Due to the high variance in cost estimates and the relatively small sample sizes for organisations experiencing breaches or attacks, it is unusual to find statistically significant differences in mean costs between years.
An alternative approach is to focus on the broad patterns in the trend data. However, from 2017 to 2020, there is not a consistent pattern. As Figure 5.9 shows, there are indications that costs for breaches with outcomes have risen since 2017 (with adjustments made for inflation). Nonetheless, the 2019 data are markedly different from the other years.
More specific research beyond this survey is needed to better assess whether the costs of breaches with outcomes have truly increased.
Similar to the mean cost of all breaches with a material outcome (such as loss of assets or data), the mean cost estimates for the single most disruptive breaches with an outcome has declined this year – when looking across the direct, recovery and long-term costs. However, costs remain higher than in 2017 and 2018. The cost estimates for businesses going back to 2017 (and adjusted for inflation, to represent costs from previous years in today’s values[footnote 15]) are shown in Figure 5.8.
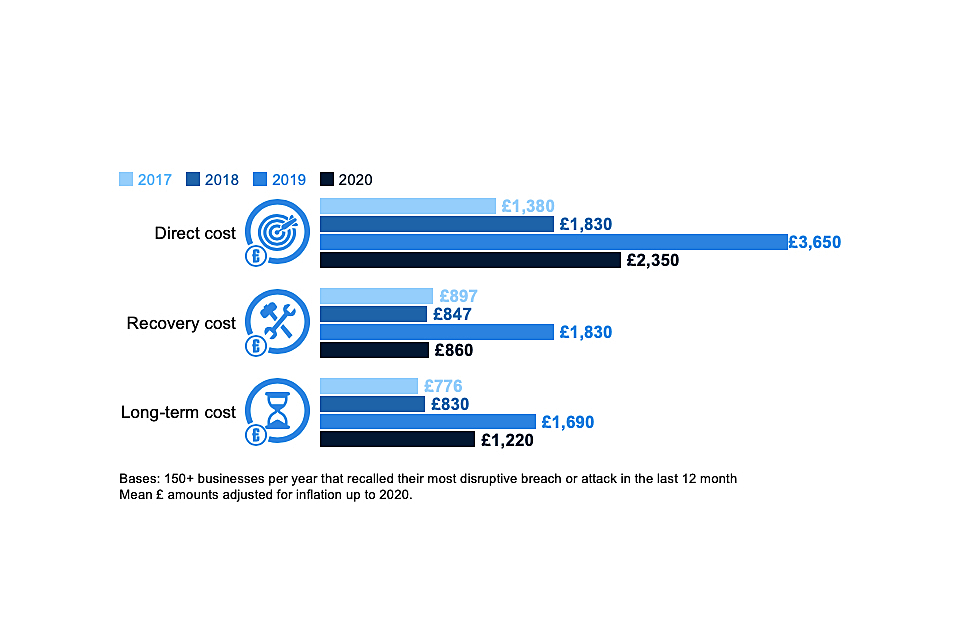
Figure 5.9: Changes over time in average (mean) costs for the most disruptive breaches with material outcomes
Chapter 6: Dealing with breaches or attacks
This chapter explores how well businesses and charities deal with breaches or attacks, including identification, response, reporting and adaptation to prevent future cases.
In the survey, questions on this topic were generally framed in terms of the most disruptive breach or attack an organisation had faced in the last 12 months. These questions are asked of the 46 per cent of business and 26 per cent of charities that have identified breaches or attacks, rather than the full sample. The size and sector subgroups therefore tend to have very small sample sizes. As such, subgroup analysis does not tend to show statistically significant differences and is featured much less in this chapter.
The questions on incident response are, however, asked of the full sample.
6.1 Identifying and responding to breaches or attacks
How were breaches or attacks identified?
As Figure 6.1 shows, the most disruptive breaches or attacks were most commonly spotted by staff members. Relatively few businesses or charities picked up on these breaches through security monitoring or via antivirus software. As with previous years, this highlights the importance of staff vigilance in identifying breaches promptly.
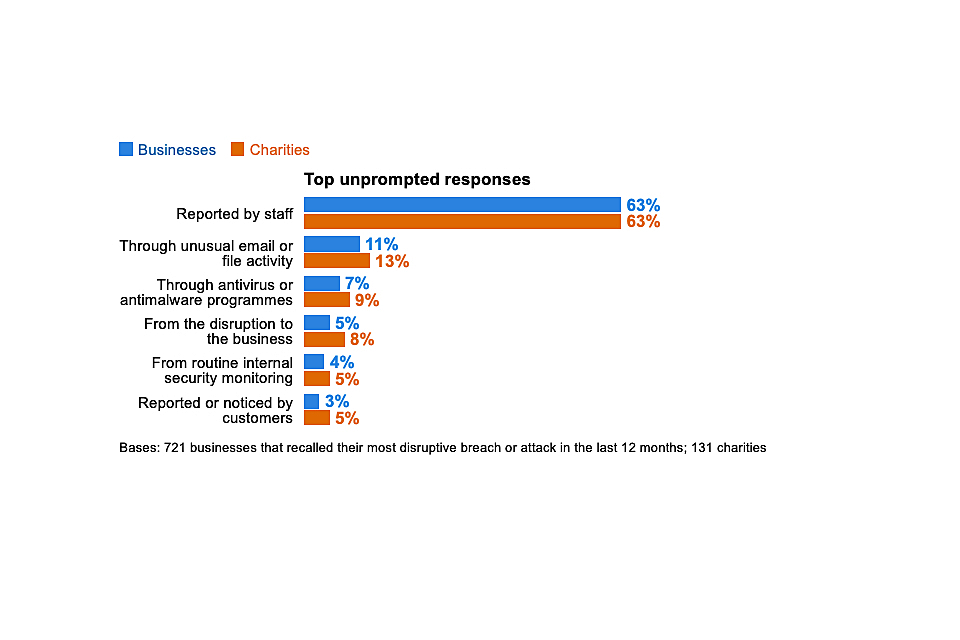
Figure 6.1: Percentage of organisations that identified their most disruptive breach or attack in the last 12 months in the following ways
Incident response
The 2020 survey asks a new question (Figure 6.2) to explore the rules and processes that organisations follow when they experience a cyber security incident. The most common responses to cyber incidents involve:
• trying to find the source • giving people specific roles and responsibilities • assessing impacts • formally logging incidents
Notifying others or having a communications plan in place tend to be less prevalent.
However, approaches to incident response are typically not very comprehensive. Only two in ten businesses (21%) and a quarter of charities (24%) say they do the aforementioned top four things when responding to cyber security incidents. Furthermore, only 12 per cent of businesses and the same proportion of charities say they do all the six things mentioned in Figure 6.2.
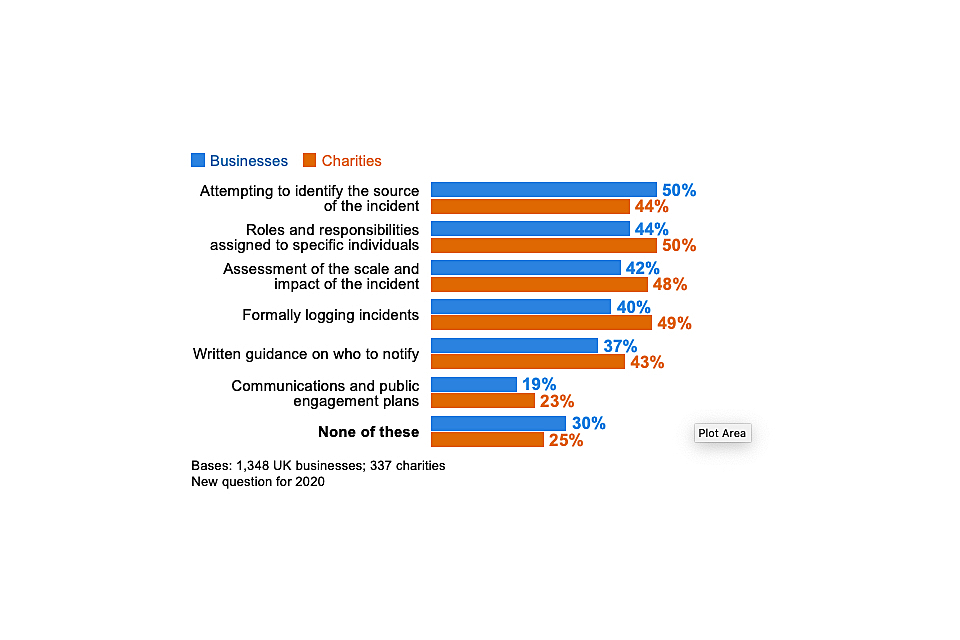
Figure 6.2: Percentage of organisations that take the following actions, or have these measures in place, for when they experience a cyber security incident
Large businesses were more likely to have each of these rules and processes in place than others. For example, eight in ten large businesses (79%) say they formally log cyber security incidents. However, even among large businesses, only just over half (55%) do all the top four categories mentioned in Figure 6.2 (i.e. other than having written guidance on who to notify or communications plans in place).
Businesses in the finance and insurance sector (40%), the health, social work and social care sector (36%), and the information and communications sector (33%) were each more likely than average (21%) to have all the top four rules and processes in place.
6.2 Reporting breaches or attacks
Internal reporting to senior managers
Among the 46 per cent of business and 26 per cent of charities that identified breaches or attacks, the vast majority of businesses (91%) informed their senior managers or directors of their most disruptive breach.
When excluding micro and small firms, where senior managers are more likely to have been aware in any case given the smaller working environment, this remains at the same level for medium businesses (89%) and is slightly lower for large businesses (80%). For large businesses, this result is lower than in previous years (e.g. 93% in 2019), although there has not been a consistent trend over time.
A much lower proportion of charities (59%) informed their senior management (including trustees). Again, there is no consistent trend across time for this – the result is higher than in 2019 (when it was 45%) but lower than 2018 (68%).
External reporting
In contrast to internal upwards reporting, which is very common, external reporting of breaches has historically been very rare. Only two-fifths of businesses (38%) and charities (42%) reported their most disruptive breach outside their organisation.
For businesses, many of these cases – as in previous years – simply involve businesses reporting breaches to their external cyber security providers and no one else. When excluding these cases, we find that businesses reported externally only in a quarter of cases (27%). For charities, this was still in two-fifths of cases (38%). The business figure has been relatively consistent since the 2017 survey, whereas for charities this represents an increase on the 2018 result (when it was 21%).
Among the 27 per cent of businesses that have reported externally, the top (unprompted) organisations that they tend to report to are banks, internet service providers and to clients, as Figure 6.3 shows. Other responses, including mentions of the police in general or, more specifically, Action Fraud (a police-run fraud reporting centre), are uncommon.
There are too few charities in the sample (ones that have reported breaches externally) to analyse in this way Figure 6.3.
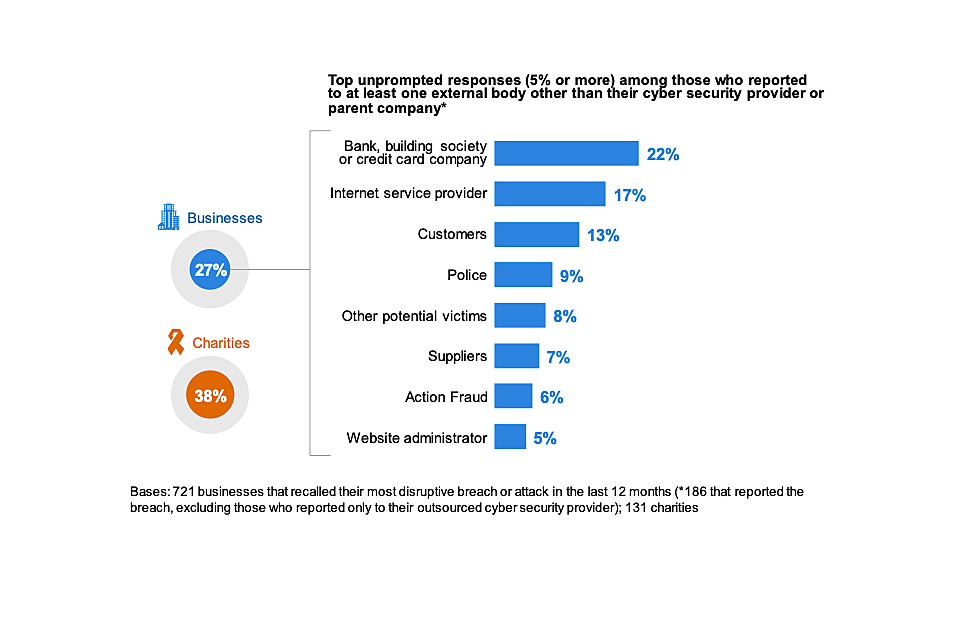
Figure 6.3: Percentage of organisations that report their most disruptive breach or attack of the last 12 months, excluding those that only report to their outsourced cyber security provider
There has historically been more reporting to the police. In all previous years up to 2017 (when the trend data for this question begin), the police were the second most commonly mentioned answer. For example, in 2019, they were mentioned by 17 per cent. Other than this change, these findings are largely consistent with previous years.
Motivations behind external reporting
In the qualitative interviews, various interviewees said their first port of call for breaches with monetary outcomes would be their bank or insurance company, in order to see what could be recovered and to get guidance on next steps. In some cases, they had been advised by banks and insurance providers to report breaches to the police. The idea of reporting personal data breaches to the Information Commissioner’s Office (ICO) – a requirement under the General Data Protection Regulation (GDPR) – also came up frequently.
The main recurring reason that organisations gave for reporting a breach externally (beyond any IT or cyber security providers) was if it resulted in a significant loss of internal data or money. A loss of personal data was also highlighted as something that organisations would typically report. In relatively rare instances, interviewees had wider motivations such as wanting others to be aware of the risks, feeling it was their corporate responsibility to report breaches, and generally considering it good practice to report.
“If we lost client data, that would be reportable straight away.”
Charity
“From our perspective, if someone can learn from what we’ve gone through, if one less person can be affected, then it’s a good thing.”
Small business
At the same time, we also uncovered multiple reasons for organisations not reporting breaches. Most fundamentally, interviewees were often unclear about what we meant by reporting a cyber security breach. The topic can be framed in many ways, including reporting to IT or cyber security providers as part of the incident response process, reporting financial losses to banks and insurance companies, public declarations to customers or suppliers, or reporting to wider authorities such as the police. Organisations typically had a different set of criteria for each of these, so did not have a single approach to reporting.
In terms of reporting to wider authorities, we came across the following barriers:
• a sense that reporting would not make a difference, because it was impossible to catch the perpetrators in some instances (e.g. with phishing attacks)
• a lack of feedback – one organisation commented that they had reported someone impersonating their organisation to the police, had received a standard response letter, but no further follow-up indicating whether their report was being acted on
• a fear of the consequences for the organisation
• responsibility for reporting lying with a different team to the one directly responding a cyber security incident (e.g. where there were separate legal or compliance teams and IT teams)
• a lack of awareness of specific agencies to report to, such as Action Fraud or the ICO
6.3 Actions taken to prevent future breaches or attacks
Among those that have identified any breaches or attacks, most businesses (64%) and charities (72%) take action to prevent further breaches after experiencing them. Around one-third of businesses (33%) and one-fifth of charities (22%) have taken no action since their most disruptive breach. These findings are similar to previous surveys in this series.
As Figure 6.4 shows, the most common (unprompted) actions taken are a mixture of additional staff training or communications, and new technical controls.
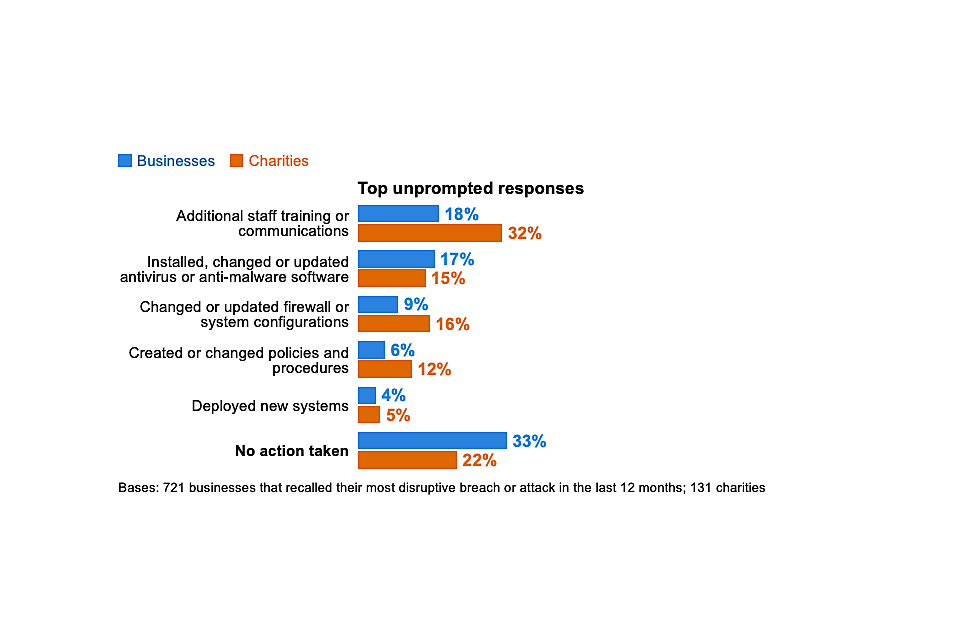
Figure 6.4: Percentage of organisations that have done any of the following since their most disruptive breach or attack of the last 12 months
Medium firms (84%) and large firms (79%) are the most likely to have taken action to prevent further breaches or attacks (vs. a 65% average).
As may be expected, the picture in Figure 6.4 changes slightly when looking only at businesses whose most disruptive breach resulted in a material outcome (e.g. the loss of files, money or other assets). This is shown in Figure 6.5. In these cases, fewer businesses (17%, vs. 33% in Figure 6.4) say they took no action.
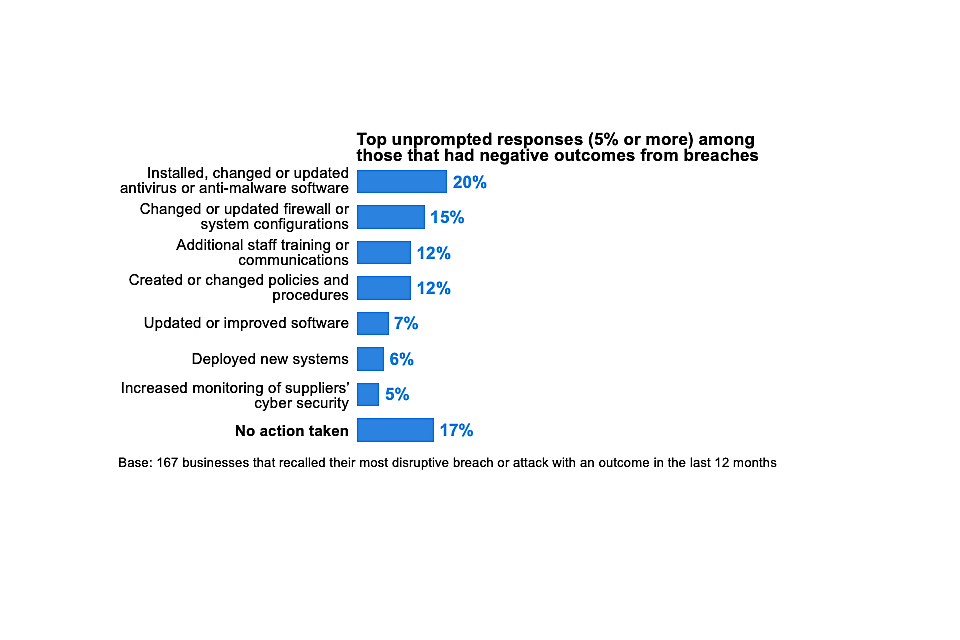
Figure 6.5: Percentage of organisations that have done any of the following since their most disruptive breach or attack of the last 12 months, in cases where breaches had material outcomes
Chapter 7: Conclusions
The Cyber Security Breaches Survey 2020, the fifth in this series, shows the extent to which attitudes and approaches to cyber security have improved over time:
• the highest proportion of businesses to date say that their senior management consider cyber security to be a high priority. In charities, this proportion is also far higher than in 2018 (when they were first included in the survey). In both sets of organisations, senior managers receive much more frequent updates about cyber security than in the past.
• more businesses are seeking information and guidance on cyber security, more are taking action to identify cyber security risks, and more are managing these risks through a mixture of technical rules and controls, governance processes and policies than in 2016. Similarly, more charities are doing these things than in 2018.
• on many indicators, charities were far behind businesses in 2018. Now charities and businesses are equally as likely to have carried out cyber security risk assessments, insured themselves against cyber security risks and written cyber security policies and business continuity plans. In this year’s survey, charities are more likely than businesses to have senior managers or trustees with a cyber security brief.
Over this period, the threat has evolved, with fewer businesses identifying viruses or ransomware and more phishing attacks. It has not diminished. In fact, the businesses identifying breaches or attacks are experiencing them more frequently than in 2017 (the start of the trend).
It is encouraging that the number of businesses experiencing negative impacts from these breaches or attacks has declined. It potentially indicates a growing resilience to cyber attacks, based on the changes that businesses have made over the last five years.
However, continuous improvement is not guaranteed. It is clear from the trend findings that the General Data Protection Regulation (GDPR) has played a major role in getting organisations to review and update cyber security policies and processes. The 2020 survey shows that many of these improvements have been maintained but not enhanced.
Furthermore, there is still considerable room for improvement, in areas such as supplier risk, audit processes and the reporting of breaches. The qualitative research provides valuable insights to help inform policy and communications in these areas:
• the current communications around supplier risks and reporting of breaches are often confusing for organisations. The term “supplier risks” does not necessarily convey the entire digital ecosystem that organisations are part of. Reporting can mean different things in different contexts. The guidance in these areas might be reframed to help businesses understand what exactly they should be considering and what best practice is.
• there are trusted and influential voices on cyber security outside of government that organisations deal with regularly. This includes banks, insurance companies and accountants. They may be another channel through which to distribute the existing government guidance materials on cyber security.
• there are a series of touchpoints that may present good opportunities to engage organisations and particularly management boards with cyber security. Our interviews found that organisations are often primed to discuss cyber security during financial audits, during annual meetings with insurance brokers and when engaging with HMRC for their tax returns. In addition, organisations do not always make cyber security improvements in and of themselves, but in response to broader technological changes. It may be possible to encourage organisations to think about their wider cyber security when upgrading their operating system or moving to a cloud server, for example.
Annex A: Further information
- The Department for Digital, Culture, Media & Sport would like to thank the following people for their work in the development and carrying out of the survey and for their work compiling this report.
• Harry Williams, Ipsos MORI
• Lydia Clark, Ipsos MORI
• Orla Leggett, Ipsos MORI
• Jayesh Navin Shah, Ipsos MORI
-
The Cyber Security Breaches Survey was first published in 2016 as a research report, and became an Official Statistic in 2017. The previous reports are also available. This includes the full report, infographics and the technical and methodological information for each year.
-
The responsible DCMS analyst for this release is Emma Johns. The responsible DCMS statistician is Rishi Vaidya. For enquiries on this release, from an official statistics perspective, please contact Rishi on 020 7211 2320 or evidence@culture.gov.uk.
-
For general enquiries contact:
Department for Digital, Culture, Media & Sport
100 Parliament Street
London
SW1A 2BQ
Telephone: 020 7211 6000
-
DCMS statisticians can be followed on Twitter via @DCMSInsight.
-
The Cyber Security Breaches Survey is an official statistics publication and has been produced to the standards set out in the Code of Practice for Official Statistics. Details of the pre-release access arrangements for this dataset have been published alongside this release.
-
This work was carried out in accordance with the requirements of the international quality standard for Market Research, ISO 20252, and with the Ipsos MORI Terms and Conditions.
Annex B: Guide to statistical reliability
The final data from the survey are based on weighted samples, rather than the entire population of UK businesses or charities. Percentage results are therefore subject to margins of error, which vary with the size of the sample and the percentage figure concerned.
For example, for a question where 50% of the 1,348 businesses sampled in the survey give a particular answer, the chances are 95 in 100 that this result would not vary more or less than 3.5 percentage points from the true figure – the figure that would have been obtained had the entire UK business population responded to the survey. The margins of error that are assumed to apply in this report are given in the following table[footnote 16].
Margins of error (in percentage points) applicable to percentages at or near these levels
| | 10% or 90% | 30% or 70% | 50% |
|---|---|---|---|
| 1,348 businesses | ±2.1 | ±3.3 | ±3.5 |
| 642 micro firms | ±2.5 | ±3.8 | ±4.2 |
| 277 small firms | ±4.0 | ±6.0 | ±6.6 |
| 216 medium firms | ±4.2 | ±6.4 | ±7.0 |
| 213 large firms | ±4.2 | ±6.4 | ±7.0 |
| 337 charities | ±4.4 | ±6.7 | ±7.3 |
There are also margins of error when looking at subgroup differences. A difference from the average must be of at least a certain size to be statistically significant. The following table is a guide to these margins of error for the subgroups that we have referred to several times across this report.
Differences required (in percentage points) from overall (business or charity) result for significance at or near these percentage levels
| | 10% or 90% | 30% or 70% | 50% |
|---|---|---|---|
| 642 micro firms | ±4.7 | ±6.6 | ±7.0 |
| 277 small firms | ±4.9 | ±7.2 | ±7.7 |
| 216 medium firms | ±5.0 | ±7.4 | ±7.9 |
| 213 large firms | ±5.0 | ±7.4 | ±7.9 |
| 108 high-income charities | ±9.1 | ±12.7 | ±13.3 |
| 121 finance and insurance firms | ±6.8 | ±10.2 | ±11.0 |
Footnotes
-
For businesses, analysis by size splits the population into micro businesses (1 to 9 employees), small businesses (10 to 49 employees), medium businesses (50 to 249 employees) and large businesses (250 employees or more). For charities, we look at annual income bands, with high income being £500,000 or more. ↩
-
In previous years of the survey, the mining and quarrying sector was also excluded from the business sample. As of April 2018, this sector is estimated to account for under 0.1 per cent of all UK businesses, so the addition of this sector has not meaningfully impacted on the comparability of findings across years. ↩
-
Where subgroup mean scores are compared, the large variation in the data often means that these differences are not statistically significant – this is made clear throughout. However, looking at the pattern of mean scores across subgroups, and the direction of travel since the 2016 and 2017 surveys, can still generate valuable insights in these instances. ↩
-
Subgroup differences highlighted are either those that emerge consistently across multiple questions or evidence a particular hypothesis (i.e. not every single statistically significant finding has been commented on). ↩
-
These aggregated results (for organisations updating managers at least annually or quarterly) across this section exclude the four per cent of businesses and three per cent of charities that say they update senior managers each time there is a breach. ↩
-
This again excludes businesses that say they update senior managers each time there is a breach. ↩
-
This is an unprompted question. From 2016 to 2019, there have been various minor additions to the answer list available to interviewers, although there has always been an “other” option to record answers not on this list. ↩
-
We have derived these figures from five separate questions in the survey. They represent the percentage of businesses and charities that say they have all the following rules or controls: having network firewalls, security controls on company-owned devices, restricting IT admin and access rights to specific users, up-to-date malware protection, and applying software updates when they are available. The question on firewalls has changed since 2019, so the estimates in this section are not comparable with previous years. ↩
-
This category previously included another question around staff training, which is no longer asked. Therefore, it is not possible to compare this to previous years. ↩
-
This category previously defined monitoring as organisations carrying out any monitoring of user activity or carrying out any business-as-usual health checks. This year, we combined business-as-usual health checks with internal audits in the questionnaire (see Figure 4.1). Therefore, we no longer include this question in this category and instead have replaced it with the use of security monitoring tools (also in Figure 4.1). ↩
-
In order to test this, we have recreated the trend data for Figure 5.1 (the proportions identifying any breaches or attacks) for previous years with this response category excluded, and we found no changes in the figures. ↩
-
In previous years, this question has included an additional response category to measure denial-of-service attacks. This category was omitted from the survey script this year. ↩
-
The cost estimates in this section are presented to three significant figures, or to the nearest whole number (if under 100). The mean and median scores exclude “don’t know” and “refused” responses. They merge together the answers from respondents who gave a numeric value as well as those who gave only a banded value (because they did not know the exact answer). For the latter, we have imputed numeric values from the given banded values. We lay out this approach in detail in the technical annex. ↩
-
The mean long-term cost estimate for large businesses identifying any breaches or attacks is, counterintuitively, higher than for large businesses identifying breaches or attacks with a material outcome. This is driven by two outliers in the data – two large businesses that did not identifying a material outcome from their breach nevertheless considered the long-term cost of their most disruptive breach to be £100,000 and £200,000 respectively. ↩
-
Inflation is assumed to be 1.5% since the 2019 survey, 3.7% since the 2018 survey and 6.6% since the 2017 survey, based on ONS data. ↩
-
In calculating these margins of error, the design effect of the weighting has been taken into account. This lowers the effective base size used in the statistical significance testing. The overall effective base size was 763 for businesses (vs. 1,019 in 2019) and 181 for charities (vs. 211 in 2019). ↩