Country and regional analysis: November 2022
Published 16 November 2022

© Crown copyright 2022
This publication is licensed under the terms of the Open Government Licence v3.0 except where otherwise stated. To view this licence, visit nationalarchives.gov.uk/doc/open-government-licence/version/3 or write to the Information Policy Team, The National Archives, Kew, London TW9 4DU, or email: psi@nationalarchives.gov.uk.
Where we have identified any third party copyright information you will need to obtain permission from the copyright holders concerned.
This publication is available at https://www.gov.uk/government/statistics/country-and-regional-analysis-2022/country-and-regional-analysis-november-2022
0.1 Data summary 2021-22
| UK identifiable expenditure | |
|---|---|
| England | £652 billion |
| Scotland | £76 billion |
| Wales | £42 billion |
| Northern Ireland | £27 billion |
| Total | £797 billion |
The Coronavirus (Covid-19) pandemic has continued to affect the statistics across the time series available in the Country and Regional Analysis (CRA). We therefore recommend caution when comparing data across the time period covered by this release.
Population figures used in the CRA are based on the most up-to-date figures available. For 2021-22 this is 2021 census data for England, Wales and Northern Ireland and mid-year population estimates for Scotland. All other years are ONS mid-year population estimates. The lack of a consistent source for all years means there may be some inconsistencies in the population numbers between financial years and also between Scotland and the rest of the United Kingdom. The covid pandemic has also had an impact on the regional breakdown, with London’s population showing a fall in 2021-22 for example (see annex for explanation), but as updated population figures for 2020-21 were unavailable the full effect is not yet reflected in the CRA. These issues will have affected the per head numbers presented in this release, so again we recommend caution when comparing movements between years. More information on the population figures is set out in section 3.5 below.
In 2021-22 UK identifiable spend (i.e. spending that can be identified as having been for the benefit of a particular area of the UK) fell to just under £796.9 billion from £895.2 billion the year before, reflecting lower expenditure in response to the Coronavirus outbreak. On a per head basis [footnote 1] total UK expenditure fell by just over £1,500 between 2020-21 and 2021-22, compared to an increase of over £3,400 the year before. This has had a significant effect on the breakdown of spending across the country. Northern Ireland saw the highest level of spending per head at £14,062 and England the lowest at £11,549. The share of identifiable spending taken by England, Scotland, Wales and Northern Ireland remains broadly unchanged although England has shown a small increase in recent years partly as a result of Covid-19 related expenditure. Non-identifiable expenditure (i.e. spend which is deemed to be on behalf of the UK as a whole), increased by more than £37.5 billion in 2021-22. This is mainly due to higher expenditure on public sector debt interest.
| Spend per head (£) | |
|---|---|
| England | £11,549 |
| Scotland | £13,881 |
| Wales | £13,401 |
| Northern Ireland | £14,062 |
| UK average | £11,897 |
The profile of spending by country is influenced by the Barnett Formula. This is designed to provide the devolved administrations with a population share of any increases in comparable spending by UK departments.
0.2 Regional Statistics
In 2021-22 English regions showed a similar percentage of identifiable expenditure as in 2020-21. London accounted for £120.7 billion of total identifiable spend, the highest in England at 15% of the total. This was followed by the South East at 12% and the North West at 11% (Table A.1a).
UK identifiable expenditure, 2021-22 (£billions)
| UK identifiable expenditure (£billions) | |
|---|---|
| North East | £31.8 |
| North West | £89.8 |
| Yorkshire and the Humber | £61.0 |
| East Midlands | £51.4 |
| West Midlands | £68.7 |
| East | £68.3 |
| London | £120.7 |
| South East | £99.0 |
| South West | £61.7 |
0.3 Spend per head
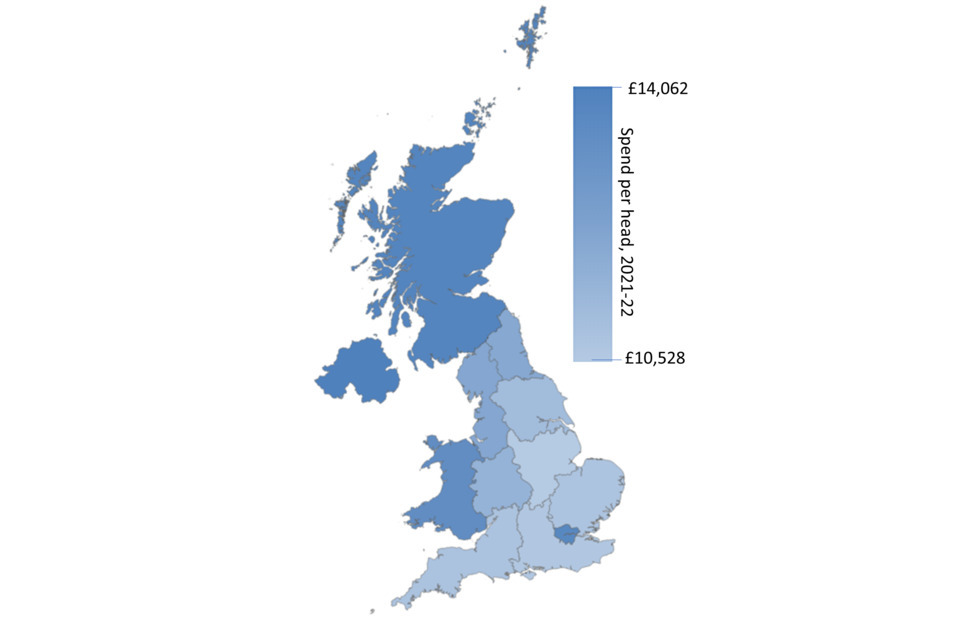
A map showing total expenditure on services, per head, in 2021-22 by UK ITL region
Expenditure per head provides a more accurate picture of regional differences, as it accounts for population size. Spend in London has historically been higher compared to other English regions partly due to the fact that for many functions it is more expensive to provide services in the capital, due to higher staff and infrastructure costs. In addition, London has historically had high capital expenditure, as it includes spend by Transport for London (TfL). Part of this spend will also benefit commuters who live outside London but who use TfL services while commuting. The lowest total spend per head was in the East Midlands and then the South East, at £10,528 and £10,665 per head respectively (Table A.1b). Expenditure in the South East has risen over recent years to overtake the East Midlands. This was in part due to significant increases in capital spending on trading services by a small number of councils and investment by Highways England[footnote 2], [footnote 3]. Looking at current spending only, i.e. recurring spend on providing public services, such as wages and salaries and benefits (Table A.3b), the lowest spend per head was in the South East at £9,706, followed by the East and East Midlands at £9,803 and £9,811 respectively. The English region with the highest current spend per head was London at £12,157.
Spend per head, 2021-22
| Spend per head (£) | |
|---|---|
| North East | £12,027 |
| North West | £12,102 |
| Yorkshire and the Humber | £11,131 |
| East Midlands | £10,528 |
| West Midlands | £11,550 |
| East | £10,778 |
| London | £13,719 |
| South East | £10,665 |
| South West | £10,820 |
| England (average) | £11,549 |
| Scotland | £13,881 |
| Wales | £13,401 |
| Northern Ireland | £14,062 |
| UK (average) | £11,897 |
1. Data in this chart is taken from table A.1b of the main release.
Increased expenditure in response to the Coronavirus outbreak in 2020-21 and 2021-22 affected several functional categories, most noticeably enterprise and economic development (Table A.8a), transport (A.8e) and health (Table A.11). Although expenditure in these areas fell in 2021-22 it remained well above the pre-pandemic levels seen in 2019-20. There were some differences in how this increased expenditure affected various regions. London, for example, saw a higher per head share of increased spend on transport, due to its large bus and Underground networks. Similarly, London and South East England saw higher per head spend from business loans, due to the higher concentration of businesses in those regions[footnote 4]. Expenditure on social protection, particularly Universal Credit, also saw significant regional disparities, with London, the South East and East of England seeing the highest growth and the North East the smallest[footnote 5].
1. About this release
-
This release presents analyses of public expenditure by country, region and function. Data in this release are National Statistics for all years.
-
Users should note that the Country and Regional Analysis is a purely statistical exercise and plays no part in resource allocation or the operation of the Barnett Formula. The regional analyses and judgments about statistical methodology presented in this release do not constitute statements of government policy.
-
Most public spending is planned to benefit categories of individuals and enterprises irrespective of location. The regional analyses presented in this release show where the individuals and enterprises that benefited from public spending were located. It does not mean that all such spending was planned to benefit a particular region, because only a minority of public spending is planned on a regional basis.
2. National Statistics
In January 2013 the United Kingdom Statistics Authority (UKSA) designated these statistics as National Statistics, in accordance with the Statistics and Registration Service Act 2007 and signifying compliance with the Code of Practice for Official Statistics.
Designation can be broadly interpreted to mean that the statistics:
-
meet identified user needs;
-
are well explained and readily accessible;
-
are produced according to sound methods; and
-
are managed impartially and objectively in the public interest.
Once statistics have been designated as National Statistics it is a statutory requirement that the Code of Practice shall continue to be observed. In May 2019 the UKSA published an assessment report on the Country and Regional analysis which reaffirmed its national statistics designation.
3. New in this release
Public spending undertaken in response to the Coronavirus outbreak is included in this release, but not all of it can be separately identified from the CRA data. Additional expenditure by the NHS on PPE, for example, will be reflected in the higher spending on health in table A.11, but it is not possible to say from the underlying CRA data how much of that increase was in response to the Coronavirus. The expenditure that can be identified in the underlying CRA data covers the following:
-
HMRC expenditure on the Coronavirus Job Retention Scheme (CJRS), Self-Employment Income Support Scheme (SEISS) and the Eat Out to Help Out (EOHO) scheme. This is shown as a single aggregate.
-
Expenditure by BEIS on the Bounce Back Loan Scheme (BBLS), the Coronavirus Large Business Interruption Loan Scheme (CLBILS), the Coronavirus Business Interruption Loan Scheme (CBILS), Covid business support grants and the Vaccines Taskforce.
Together this totals around £121.5 billion in 2020-21 and £18.4 billion in 2021-22. The methodology used to assign the spend to England, Scotland, Wales, Northern Ireland and the English regions is set out in full in the separate methodology note, but is consistent with breakdowns already published by HMRC and the British Business Bank[footnote 6]. In June 2022 the National Audit Office put the cumulative cost of the government’s pandemic-related measures at £321 billion. Departments’ individual Annual Reports and Accounts include analysis of COVID-19 related expenditure, alongside a summary of the impact of the pandemic on departmental activities and outcomes. Further information on measures announced by the government in response to the Coronavirus pandemic, how much has been spent, and how it is treated in the National Accounts may also be found in publications by the National Audit Office and the Office for National Statistics[footnote 7].
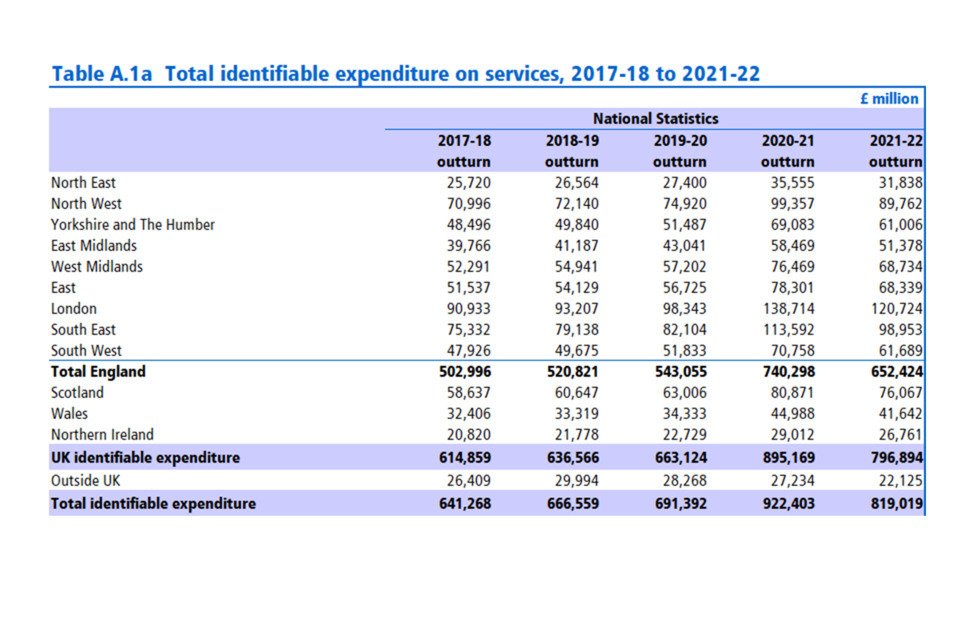
Table A.1a Total identifiable expenditure on services (£millions), 2017-18 to 2022-22
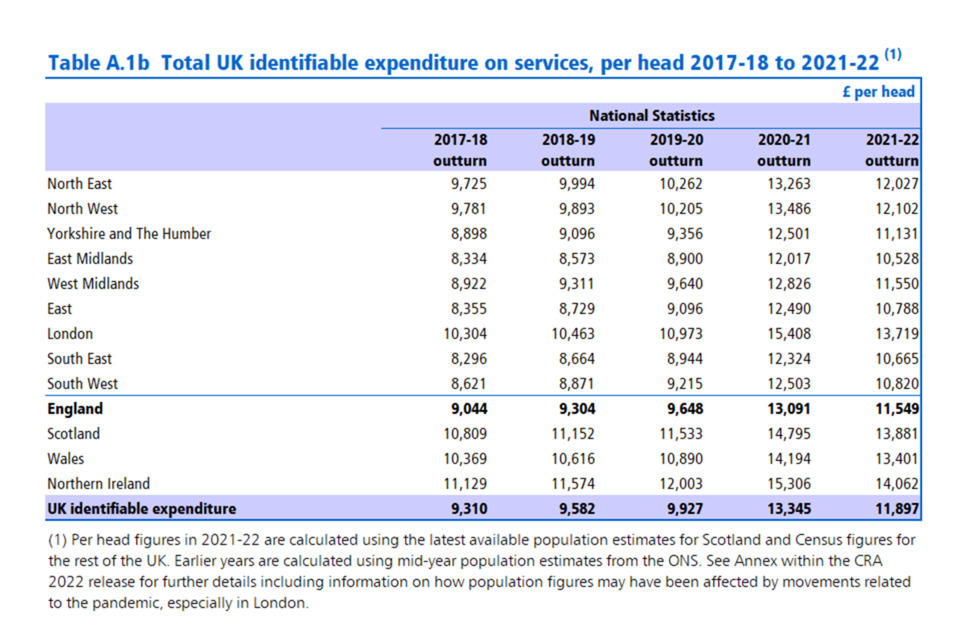
Table A.1b Total identifiable expenditure on services, per head, 2017-18 to 2022-22
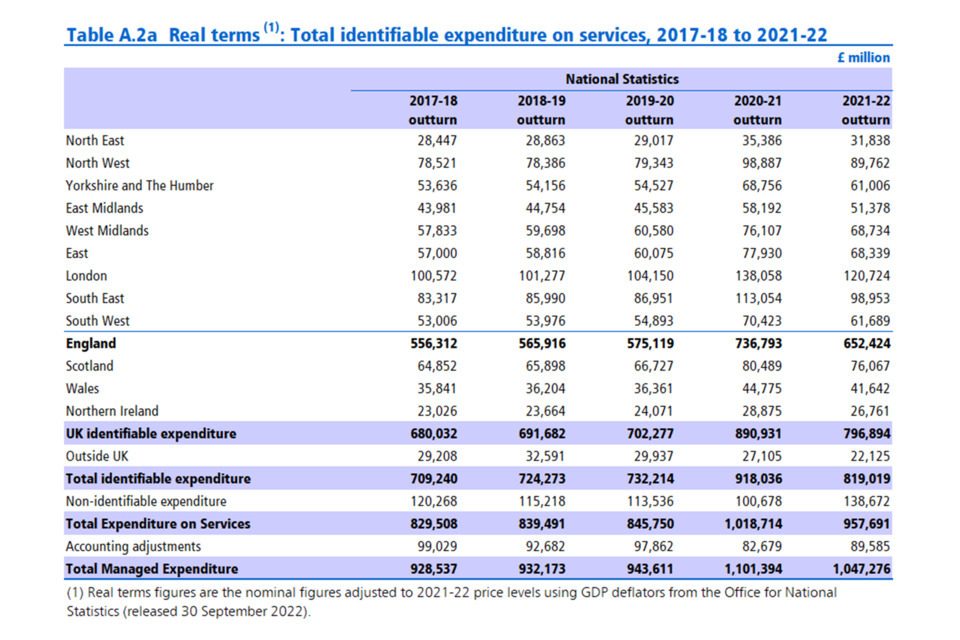
Table A.2a Total identifiable expenditure on services in real terms, 2017-18 to 2022-22
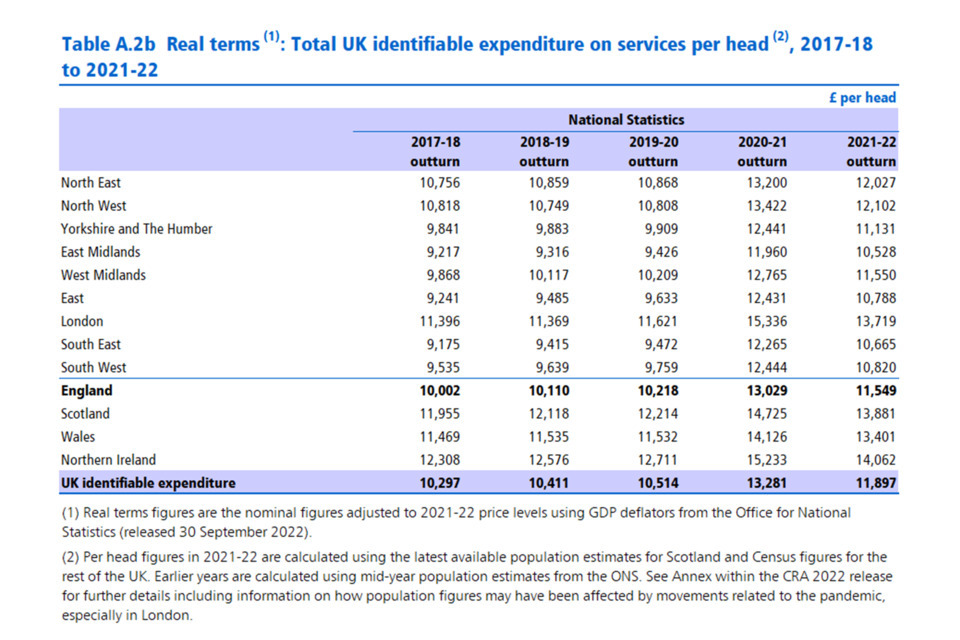
Table A.2b Total identifiable expenditure on services per head in real terms, 2017-18 to 2022-22
3.1 Table A.3b Total current and capital identifiable expenditure, per head 2017-18 to 2022-22
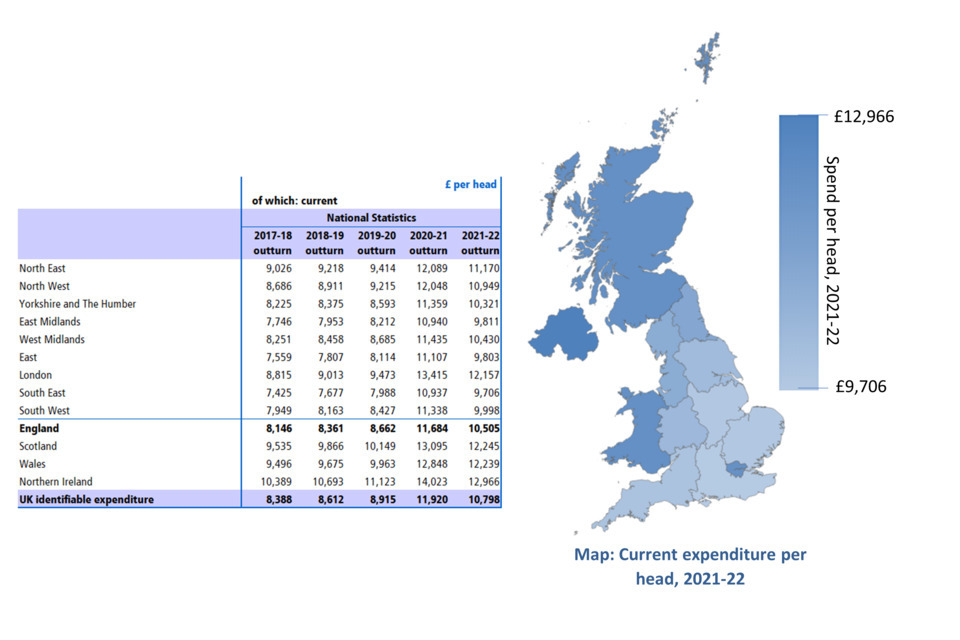
Table A.3b Total current identifiable expenditure, per head 2017-18 to 2022-22, including a map showing current expenditure for 2021-22 by UK ITL region
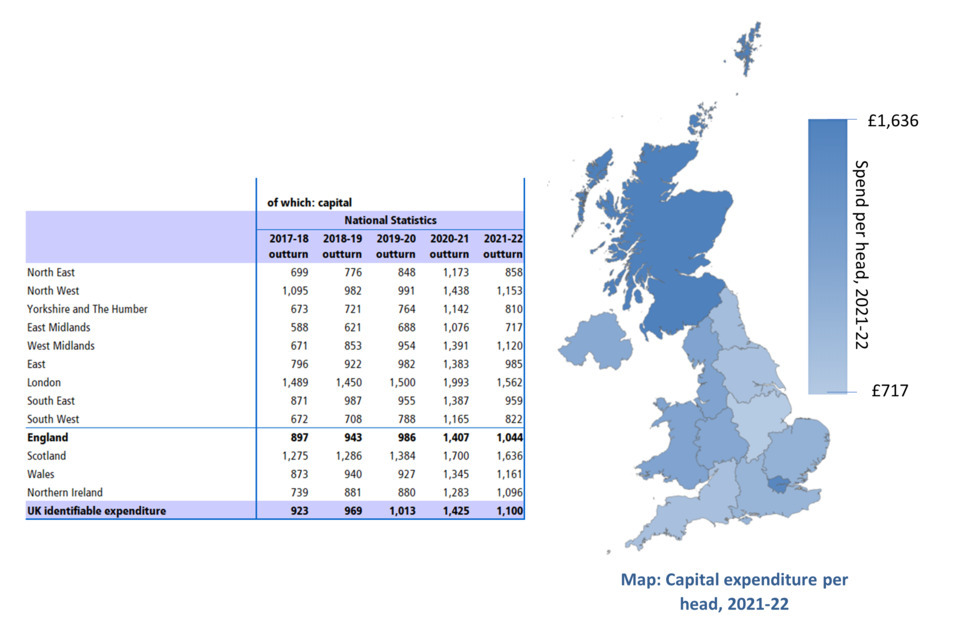
Table A.3b Total capital identifiable expenditure, per head 2017-18 to 2022-22, including a map showing capital expenditure for 2021-22 by UK ITL region
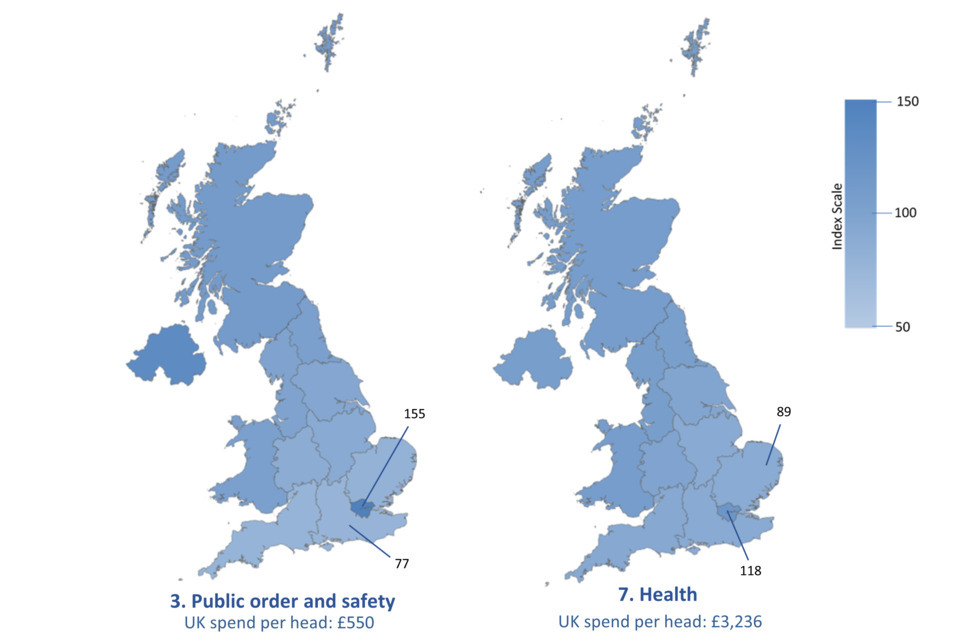
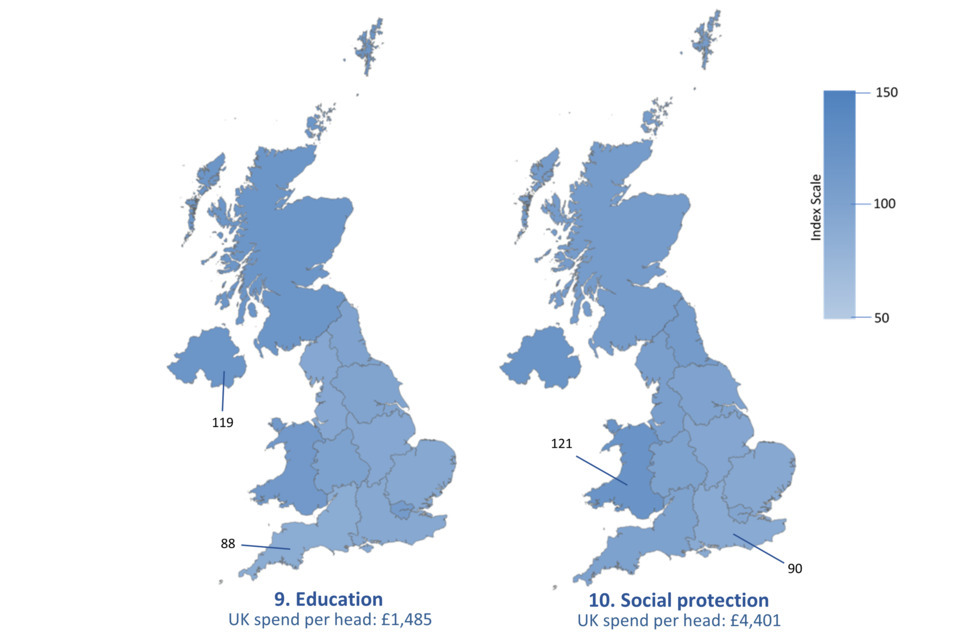
3.2 Maps based on Table A.16: UK identifiable expenditure by function, per head, indexed, 2021-22
The images below contain maps based on table A.16. For reference, each map has been labelled with the lowest and highest index value and also provides the figure for the total UK spend per head based on data from table A.15. More information about maps and index figures is available in the guidance and information document published alongside this release.
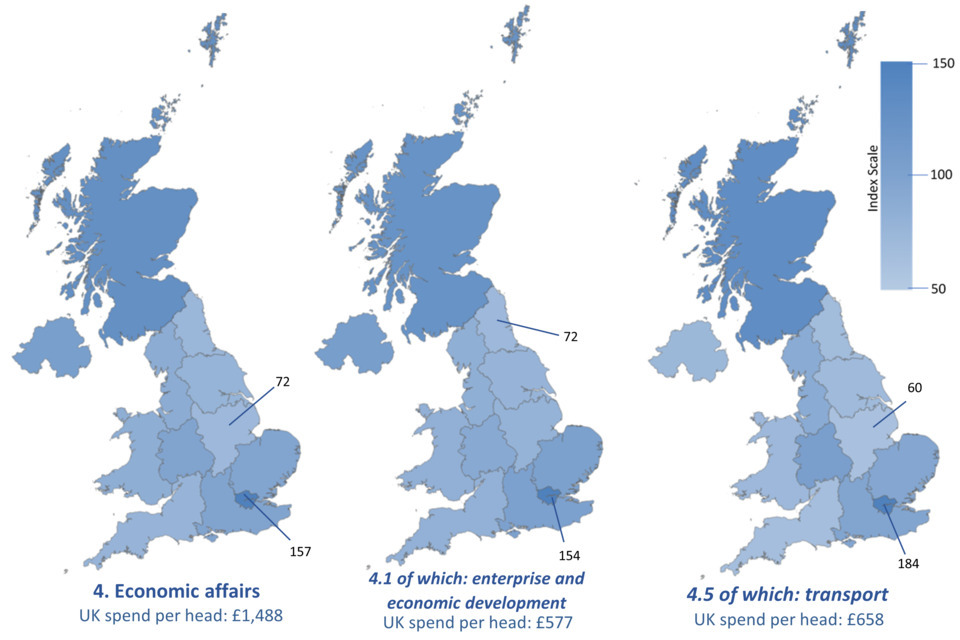
Maps based on Table A.16: UK identifiable expenditure by function, per head, indexed, 2021-22
Maps based on Table A.16: UK identifiable expenditure by function, per head, indexed, 2021-22
Maps based on Table A.16: UK identifiable expenditure by function, per head, indexed, 2021-22
3.3 Data in this release
All data in this release are available and accessible online on the Country and Regional Analysis publication page. All data tables are still available in excel format, where separate excel files are published for the A tables, the B tables, the interactive tables and the CRA database.
Most of the tables in this release provide an analysis of spending for the period 2017-18 to 2021-22. The information used to produce the A and B tables was gathered in a separate data collection exercise during the summer of 2022, which was consistent with the Public Spending Statistics (PSS) July 2022 dataset. In addition, further revisions to departmental and local authority outturn have also been taken on. Information on revisions, data tables and methodology can be found in the guidance and information document accompanying this release.
Total Expenditure on Services (TES) in the CRA will not match the TES figures in the November 2022 PSS publication. As stated above, the CRA dataset is based on data used in the July 2022 PSS publication.
3.4 Key revisions in this release
Revisions to total expenditure on services (TES) since PSS: July 2022
Departments have taken the opportunity, wherever possible, to correct or update their outturn data since the publication of the July 2022 PSS to bring them into line with their published Annual Reports and Accounts. In addition, updated figures for local government expenditure have also been incorporated into this release. Figures for local government expenditure in 2021-22 are now provisional for England and Scotland and final for Wales. Changes to Total Managed Expenditure (TME) and public sector debt interest in all years are due to updated ONS data. Note that figures in this release are consistent with the ONS public sector finances (PSF) publication for September 2022.
3.5 Annex: Population numbers and GDP deflators
Population numbers by country and region (thousands)
| Region | mid-2017 | mid-2018 | mid-2019 | mid-2020 | Census day 2021 |
|---|---|---|---|---|---|
| North East | 2,645 | 2,658 | 2,670 | 2,681 | 2,647 |
| North West | 7,259 | 7,292 | 7,341 | 7,367 | 7,417 |
| Yorkshire and The Humber | 5,450 | 5,480 | 5,503 | 5,526 | 5,481 |
| East Midlands | 4,772 | 4,804 | 4,836 | 4,866 | 4,880 |
| West Midlands | 5,861 | 5,901 | 5,934 | 5,962 | 5,951 |
| East | 6,168 | 6,201 | 6,236 | 6,269 | 6,335 |
| London | 8,825 | 8,908 | 8,962 | 9,002 | 8,800 |
| South East | 9,081 | 9,134 | 9,180 | 9,217 | 9,278 |
| South West | 5,559 | 5,600 | 5,625 | 5,659 | 5,701 |
| England | 55,619 | 55,977 | 56,287 | 56,550 | 56,490 |
| Scotland | 5,425 | 5,438 | 5,463 | 5,466 | 5,480 |
| Wales | 3,125 | 3,139 | 3,153 | 3,170 | 3,108 |
| Northern Ireland | 1,871 | 1,882 | 1,894 | 1,896 | 1,903 |
| UK | 66,040 | 66,436 | 66,797 | 67,081 | 66,980 |
For 2021-22, population figures for England, Wales and Northern Ireland are as of Census day 2021. They are sourced from the ONS and Northern Ireland Statistics and Research Agency (ONS Census day 2021, NISRA Census day 2021). Figures for Scotland are mid-2021 population estimates (National Records of Scotland). All other years are mid-year population estimates from the ONS for the Countries of the UK and the English Regions (2011 Population Census based). Web link: mid-2017 to mid-2020. The ONS have set out some of the ways in which the coronavirus pandemic may have affected the census data. This can be found in their Quality and Methodology information (QMI) for Census 2021 note. The relevant sections can be found on pages 5 and 6. In particular, they highlight analysis associated with the London region which users of the CRA should be aware of: The Greater London Authority (GLA) carried out analysis to understand population change in London during the pandemic. This analysis concluded that there had been a fall in London’s population over the first year of the coronavirus pandemic, but that the population is likely to have started growing again since.
Their analysis suggested this was attributable to:
- many young adults leaving London during lockdown, most likely linked to the temporary closure of the hospitality and tourism sectors
- higher mortality, mainly in those aged 75 years and over, and the continuation of a downward trend in the number of births
- an increased loss of other age groups to surrounding regions, as evidenced by house-price and registration data – seen as a potentially more persistent trend
Other areas, especially urban centres, may have also experienced similar effects.
The Greater London Authority analysis highlighted the potential temporary nature of this change. It pointed to evidence of many young adults returning to London during the spring and summer of 2021, following the recovery of the hospitality and tourism sectors. Several local authorities also referenced similar trends during the quality assurance process.
The ONS have also stressed that this is a developing area and data could change and improve in the near future: We recognise the population continues to change and that we need to understand these changes. Using a variety of data sources, we will be providing more frequent, relevant and timely statistics to allow us to understand population change in local areas in 2022 and beyond. The results from Census 2021 will therefore provide an important bridge from the past to the future. As we release further census statistics, we will publish supporting information to consider the impact the coronavirus pandemic may have had. This will include how the pandemic may have affected data on labour market and travel to work.
3.6 GDP deflators and money GDP
Real terms figures are the nominal figures adjusted to 2021-22 price levels using GDP deflators from the Office for National Statistics (released 30 September 2022).
| Financial year | GDP deflator at market prices (2021-22 = 100) | % per cent change on previous year | Money GDP (£millions) |
|---|---|---|---|
| 2017-18 | 90.416 | 1.67 | 2,102,925 |
| 2018-19 | 92.032 | 1.79 | 2,177,222 |
| 2019-20 | 94.425 | 2.60 | 2,249,423 |
| 2020-21 | 100.476 | 6.41 | 2,086,540 |
| 2021-22 | 100.000 | -0.47 | 2,342,564 |
GDP Deflator: Financial years 2017-18 to 2021-22 taken from ONS series L8GG in Table N.
-
Per head figures calculated using the latest mid-year population estimates from the ONS. ↩
-
Local Authority Capital Expenditure and Receipts, England: 2018-19 ↩
-
Local Authority Capital Expenditure and Receipts, England: 2017-18 ↩
-
UK business; activity, size and location - Office for National Statistics (ons.gov.uk) ↩
-
Universal Credit statistics, 29 April 2013 to 8 April 2021 - GOV.UK (www.gov.uk) ↩
-
HMRC coronavirus (COVID-19) statistics - GOV.UK (www.gov.uk); Press Release - July 6, 2021 - British Business Bank (british-business-bank.co.uk) ↩
-
COVID-19 cost tracker - National Audit Office (NAO); Recent and upcoming changes to public sector finance statistics - Office for National Statistics (ons.gov.uk) ↩