Country and regional analysis: November 2020
Published 18 November 2020

© Crown copyright 2020
This publication is licensed under the terms of the Open Government Licence v3.0 except where otherwise stated. To view this licence, visit nationalarchives.gov.uk/doc/open-government-licence/version/3 or write to the Information Policy Team, The National Archives, Kew, London TW9 4DU, or email: psi@nationalarchives.gov.uk.
Where we have identified any third party copyright information you will need to obtain permission from the copyright holders concerned.
This publication is available at https://www.gov.uk/government/statistics/country-and-regional-analysis-2020/country-and-regional-analysis-november-2020
1. Data summary 2019-20
1.1 Country Statistics
| Country | UK identifiable expenditure |
|---|---|
| England | £541 billion |
| Scotland | £63 billion |
| Wales | £34 billion |
| Northern Ireland | £23 billion |
| Total | £661 billion |
In 2019-20 UK identifiable spend (i.e. spending that can be identified as having been for the benefit of a particular country or region) was over £660.9 billion and the average spend per head[footnote 1] in the UK was £9,895. Northern Ireland saw the highest level of spending per head at £11,987 and England the lowest at £9,604. The share of identifiable spending taken by each of the individual countries of the UK has remained broadly unchanged in recent years.
| Country | Spend per head |
|---|---|
| England | £9,604 |
| Scotland | £11,566 |
| Wales | £10,929 |
| Northern Ireland | £11,987 |
| UK average | £9,895 |
The profile of spending by country is influenced by the Barnett Formula. This is designed to provide the devolved administrations with a population share of any increases in comparable spending by UK departments.
1.2 Regional Statistics
In 2019-20 English regions showed a similar percentage of identifiable expenditure as in 2018-19. London accounted for £97 billion of identifiable spend, the highest in England at 14% of the total. This was followed by the South East at 12% and the North West at 11%.
UK identifiable expenditure by region, 2019-20 (£billions)
| Region | UK identifiable expenditure (£billions) |
|---|---|
| North East | £27.5 |
| North West | £74.9 |
| Yorkshire and the Humber | £51.7 |
| East Midlands | 42.9 |
| West Midlands | £56.8 |
| East | £56.1 |
| London | £97.1 |
| South East | £81.9 |
| South West | £51.7 |
1.3 Spend per head by region
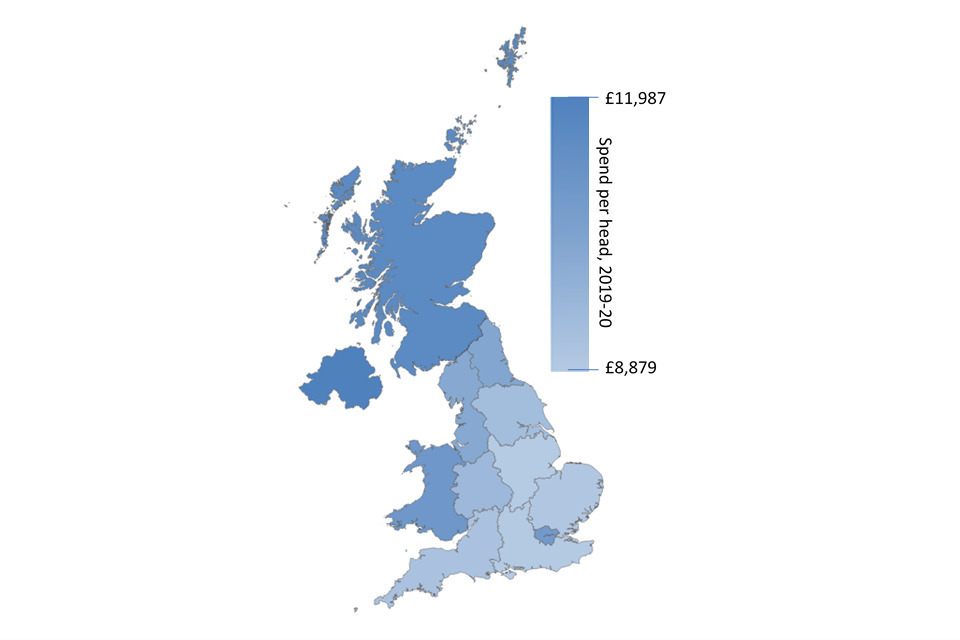
A map showing total expenditure on services, per head, in 2019-20 by UK NUTS region
The higher spend in London compared to other English regions is at least partly explained by the fact that for many functions it is more expensive to provide services in the capital, due to higher staff and infrastructure costs. In addition, London has historically had high capital expenditure, as it includes spend by Transport for London (TfL). Part of this spend will also benefit commuters who live outside London but who use TfL services while commuting. The lowest total spend per head is in the East Midlands and then the South East, at £8,879 and £8,919 per head respectively. Expenditure in the South East has risen over recent years to overtake the East Midlands. This is in part due to significant increases in capital spending on trading services by a small number of councils and investment by Highways England[footnote 2], [footnote 3]. Looking at current spending only (i.e. recurring spend on providing public services, such as wages and salaries and benefits), the lowest spend per head is in the South East at £7,883, followed by the East at £8,034. The English region with the highest current spend per head is the North East at £9,447.
Spend per head by region, 2019-20
| Region | Spend per head |
|---|---|
| North East | £10,285 |
| North West | £10,204 |
| Yorkshire and the Humber | £9,401 |
| East Midlands | £8,879 |
| West Midlands | £9,570 |
| East | £8,991 |
| London | £10,835 |
| South East | £8,919 |
| South West | £9,193 |
| England (average) | £9,604 |
| Scotland | £11,566 |
| Wales | £10,929 |
| Northern Ireland | £11,987 |
| UK (average) | £9,895 |
1. Data in this chart is taken from table A.1b of the main release.
2. About this release
-
This release presents analyses of public expenditure by country, region and function. Data in this release are National Statistics for all years.
-
Users should note that the Country and Regional Analysis is a purely statistical exercise and plays no part in resource allocation or the operation of the Barnett Formula. The regional analyses and judgments about statistical methodology presented in this release do not constitute statements of government policy.
-
Most public spending is planned to benefit categories of individuals and enterprises irrespective of location. The regional analyses presented in this release show where the individuals and enterprises that benefited from public spending were located. It does not mean that all such spending was planned to benefit a particular region, because only a minority of public spending is planned on a regional basis.
3. National Statistics
In January 2013 the United Kingdom Statistics Authority (UKSA) designated these statistics as National Statistics, in accordance with the Statistics and Registration Service Act 2007 and signifying compliance with the Code of Practice for Official Statistics.
Designation can be broadly interpreted to mean that the statistics:
-
meet identified user needs;
-
are well explained and readily accessible;
-
are produced according to sound methods; and
-
are managed impartially and objectively in the public interest.
Once statistics have been designated as National Statistics it is a statutory requirement that the Code of Practice shall continue to be observed. In May 2019 the UKSA published an assessment report on the Country and Regional analysis in order to reaffirm its national statistics designation. The assessment and resulting outcomes and/or requirements are still ongoing. For more information please see the ‘Work programme’ section in the CRA guidance and information document accompanying this release.
4. New in this release
-
In July 2020 HM Treasury launched a survey to gather feedback from users of the CRA. This generated a limited number of responses, from which it seems no wholesale changes need to be made to the CRA in order to meet user needs. HM Treasury would like to thank all those who submitted a response. One specific improvement which was requested was to make the distinction between nominal and real terms tables clearer. This has been addressed in this edition of the CRA. HM Treasury continues to encourage users to provide feedback via the usual contact address: Pesa.document@hmtreasury.gov.uk
-
Public spending undertaken in response to the Coronavirus outbreak in 2020 is not visible in this release. Although some additional spending did occur very late in March 2019-20, this was mainly in the form of additional grants to local government, which are excluded from the Total Expenditure on Services (TES) framework used as the basis for the CRA. The corresponding local government spending did not take place until 2020-21, together with the vast majority of additional central government spending. This will be captured in the 2021 CRA release.
4.1 Table A.1a Total identifiable expenditure on services by country and region (£millions), 2015-16 to 2019-20
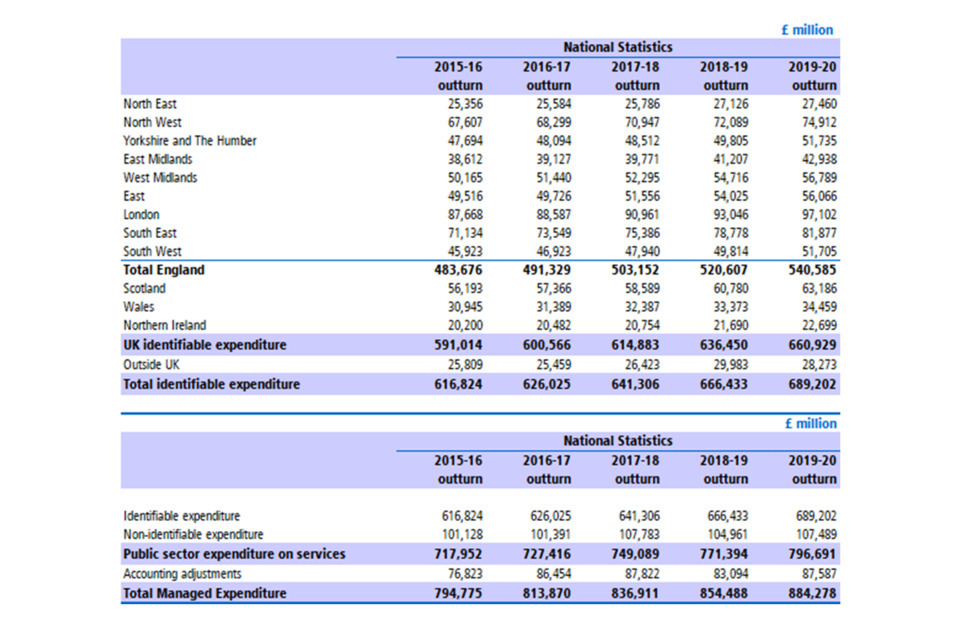
Table A.1a Total identifiable expenditure on services by country and region (£millions), 2015-16 to 2019-20
4.2 Table A.1b Total identifiable expenditure on services by country and region, per head, 2015-16 to 2019-20
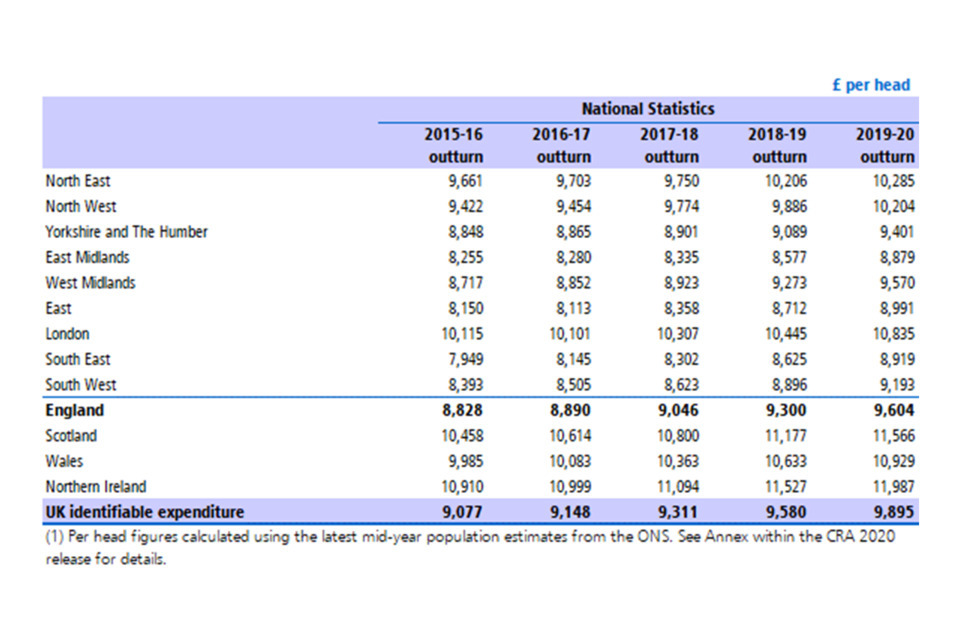
Table A.1b Total identifiable expenditure on services by country and region, per head, 2015-16 to 2019-20
4.3 Table A.2a Total identifiable expenditure on services by country and region in real terms, 2015-16 to 2019-20
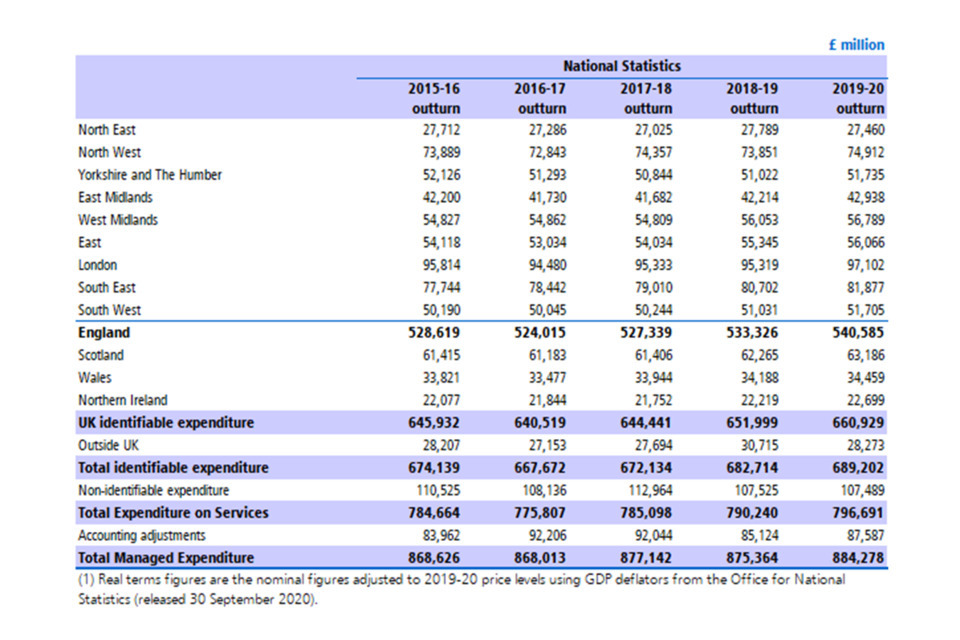
Table A.2a Total identifiable expenditure on services by country and region in real terms, 2015-16 to 2019-20
4.4 Table A.2b Total identifiable expenditure on services by country and region per head in real terms, 2015-16 to 2019-20
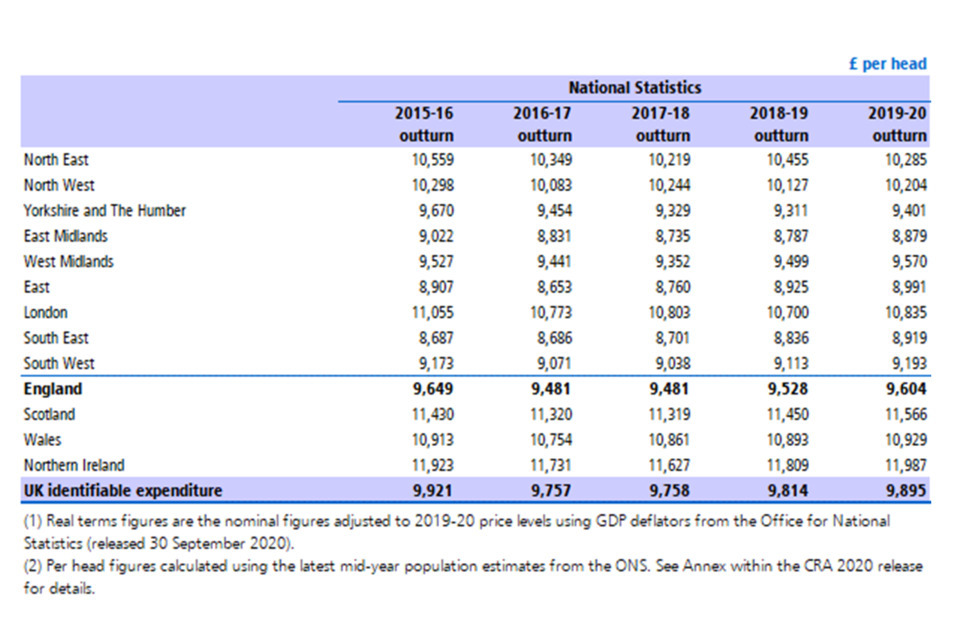
Table A.2b Total identifiable expenditure on services by country and region per head in real terms, 2015-16 to 2019-20
4.5 Table A.3b Total current and capital identifiable expenditure by country and region, per head 2015-16 to 2019-20
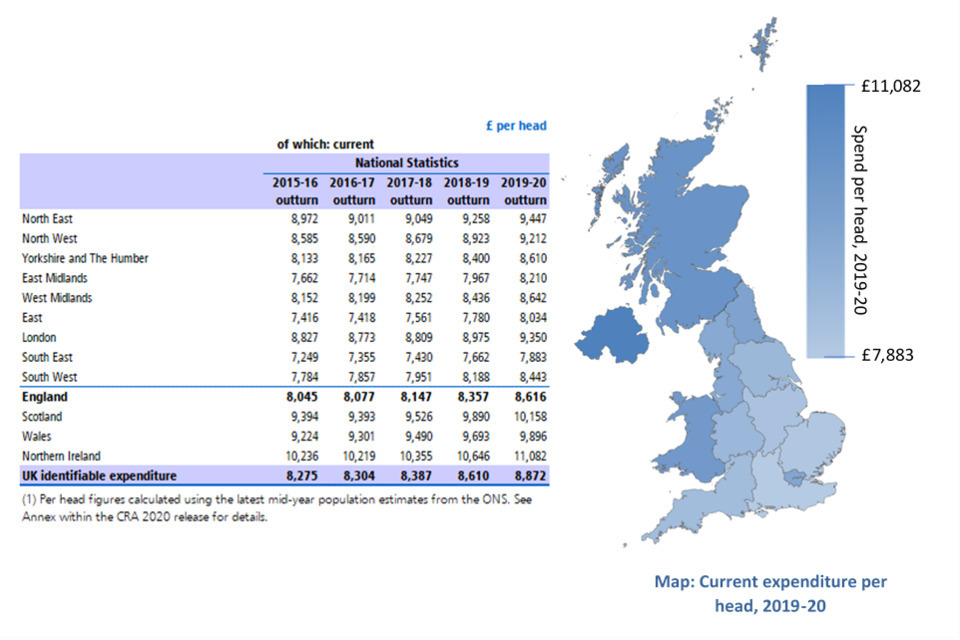
Table A.3b Total current identifiable expenditure by country and region, per head 2015-16 to 2019-20, including a map showing current expenditure for 2019-20 by UK NUTS region
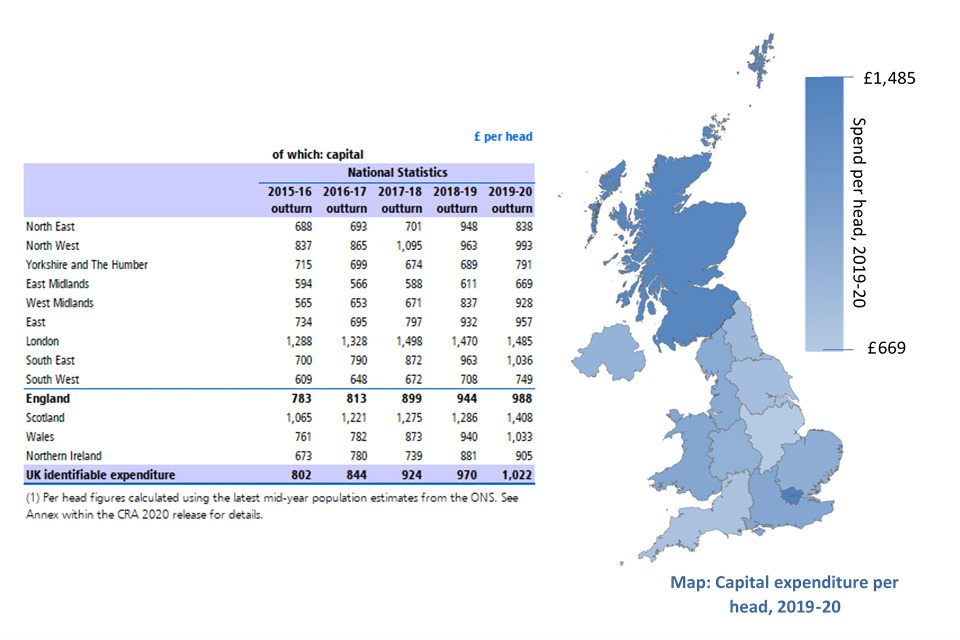
Table A.3b Total capital identifiable expenditure by country and region, per head 2015-16 to 2019-20, including a map showing capital expenditure for 2019-20 by UK NUTS region
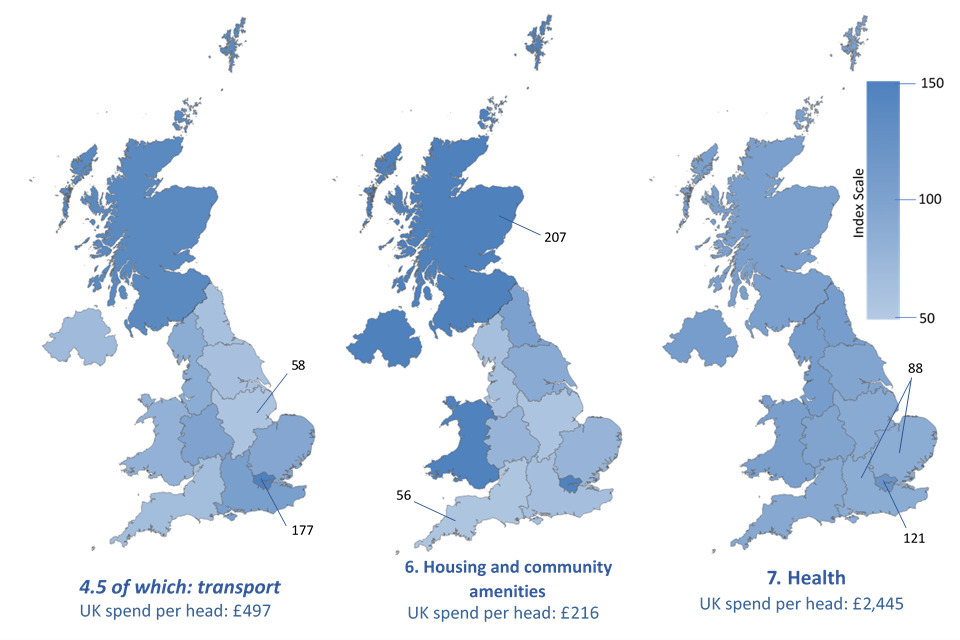
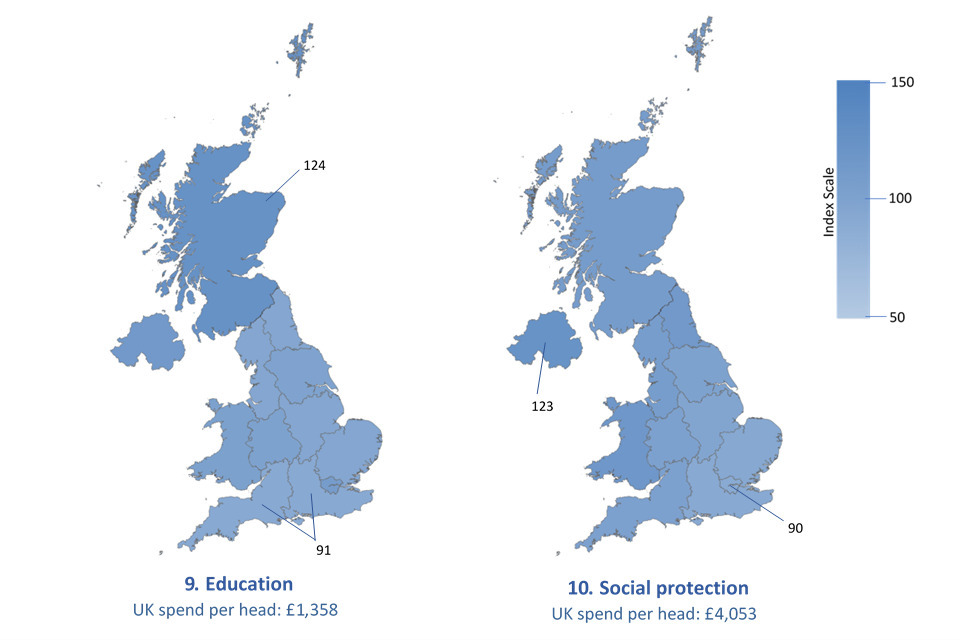
4.6 Maps based on Table A.16: UK identifiable expenditure by function, country and region, per head, indexed, 2019-20
The images below contain maps based on table A.16. For reference, each map has been labelled with the lowest and highest index value and also provides the figure for the total UK spend per head based on data from table A.15. More information about maps and index figures is available in the guidance and information document published alongside this release.
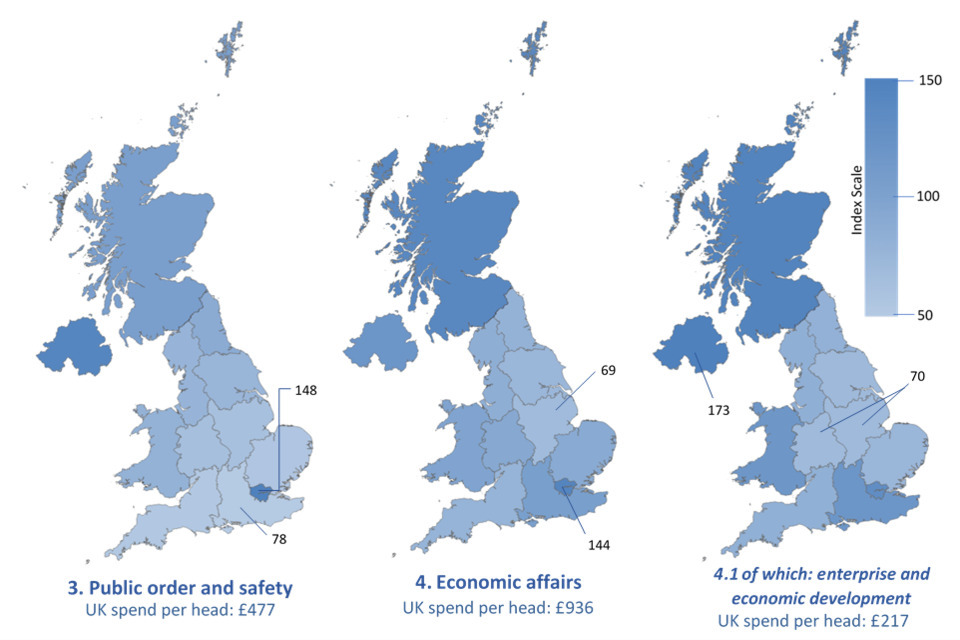
Maps based on Table A.16: UK identifiable expenditure by function, country and region, per head, indexed, 2019-20
Maps based on Table A.16: UK identifiable expenditure by function, country and region, per head, indexed, 2019-20
Maps based on Table A.16: UK identifiable expenditure by function, country and region, per head, indexed, 2019-20
4.7 Data in this release
All data in this release are available and accessible online on the country and regional analysis publication page. All data tables are still available in excel format, where separate excel files are published for the A tables, the B tables, the interactive tables and the CRA database.
Most of the tables in this release provide an analysis of spending for the period 2015-16 to 2019-20. The information used to produce the A and B tables was gathered in a separate data collection exercise during the summer of 2020 and was consistent with the Public Spending Statistics (PSS) July 2020 dataset. In addition, further revisions to departmental and local authority outturn have also been taken on. Information on revisions, data tables and methodology can be found in the guidance and information document accompanying this release.
Total Expenditure on Services (TES) in the CRA will not match the TES figures in the November 2020 PSS publication. As stated above, the CRA dataset is based on data used in the July 2020 PSS publication.
4.8 Key revisions in this release
Revisions to total expenditure on services (TES) since PSS: July 2020
Departments have taken the opportunity, wherever possible, to correct or update their outturn data since the publication of the July 2020 PSS to bring them into line with their published Annual Reports and Accounts. In addition, updated figures for local government expenditure have also been incorporated into this release, specifically, provisional revenue expenditure for England local authorities in 2019-20. Figures for local government expenditure in 2019-20 are now provisional for England and Scotland and Budget (plans) for Wales.
An adjustment has been made to Scottish local government capital spending in 2019-20. The July PSS reflected an increase in capital spending consistent with the headline figures set out in the Scottish Government’s Local Government 2019-20 Provisional Outturn and 2020-21 Budget Estimates – Capital publication. However, some of this increase is associated with a number of sale and leaseback transactions in one local authority. Following the approach set out in section 6.2 of the Manual on Government Deficit and Debt 2019, these transactions have been excluded from capital expenditure figures in the CRA. This treatment was also outlined on page 51 of the Government Expenditure and Revenue Scotland 2019-20 release.
Changes to Total Managed Expenditure (TME) and public sector debt interest in all years are due to updated ONS data. Figures in this release are consistent with the ONS public sector finances (PSF) publication for September 2020.
4.9 Annex: Population numbers and GDP deflators
Population numbers by country and region (thousands)
| Region | mid-2015 | mid-2016 | mid-2017 | mid-2018 | mid-2019 |
|---|---|---|---|---|---|
| North East | 2,625 | 2,637 | 2,645 | 2,658 | 2,670 |
| North West | 7,175 | 7,224 | 7,259 | 7,292 | 7,341 |
| Yorkshire and The Humber | 5,390 | 5,425 | 5,450 | 5,480 | 5,503 |
| East Midlands | 4,677 | 4,725 | 4,772 | 4,804 | 4,836 |
| West Midlands | 5,755 | 5,811 | 5,861 | 5,901 | 5,934 |
| East | 6,076 | 6,129 | 6,168 | 6,201 | 6,236 |
| London | 8,667 | 8,770 | 8,825 | 8,908 | 8,962 |
| South East | 8,949 | 9,030 | 9,081 | 9,134 | 9,180 |
| South West | 5,472 | 5,517 | 5,559 | 5,600 | 5,625 |
| England | 54,786 | 55,268 | 55,619 | 55,977 | 56,287 |
| Scotland | 5,373 | 5,405 | 5,425 | 5,438 | 5,463 |
| Wales | 3,099 | 3,113 | 3,125 | 3,139 | 3,153 |
| Northern Ireland | 1,852 | 1,862 | 1,871 | 1,882 | 1,894 |
| United Kingdom | 65,110 | 65,648 | 66,040 | 66,436 | 66,797 |
Mid-Year Population Estimates from the ONS for the Countries of the UK and the English Regions (2011 Population Census based). Web link: mid-2015 to mid-2019
4.10 GDP deflators and money GDP
Outturn data are based on the 30 September 2020 National Accounts figures from ONS
| Financial year | GDP deflator at market prices (2019-20 = 100) | % per cent change on previous year | Money GDP (£millions) |
|---|---|---|---|
| 2015-16 | 91.498 | 0.82 | 1,936,795 |
| 2016-17 | 93.762 | 2.47 | 2,016,681 |
| 2017-18 | 95.413 | 1.76 | 2,082,483 |
| 2018-19 | 97.615 | 2.31 | 2,164,840 |
| 2019-20 | 100.000 | 2.44 | 2,217,924 |
GDP Deflator: Financial years 2015-16 to 2019-20 taken from ONS series L8GG in Table N.
Cash GDP: For years 2015-16 to 2019-20: ONS data for money GDP (not seasonally adjusted series BKTL) in Table N.
-
Per head figures calculated using the latest mid-year population estimates from the ONS. ↩
-
Local Authority Capital Expenditure and Receipts, England: 2018-19 ↩
-
Local Authority Capital Expenditure and Receipts, England: 2017-18 ↩