Research and Development Tax Credits Statistics: September 2026
Updated 29 September 2026

© Crown copyright 2026
This publication is licensed under the terms of the Open Government Licence v3.0 except where otherwise stated. To view this licence, visit nationalarchives.gov.uk/doc/open-government-licence/version/3 or write to the Information Policy Team, The National Archives, Kew, London TW9 4DU, or email: psi@nationalarchives.gov.uk.
Where we have identified any third party copyright information you will need to obtain permission from the copyright holders concerned.
This publication is available at https://www.gov.uk/government/statistics/corporate-tax-research-and-development-tax-credit/research-and-development-tax-credits-statistics-september-2026
1. Key points
The key points from the 2026 Research and Development (R&D) publication are:
-
the provisional estimate of total R&D tax relief support claimed for the financial year 2024 to 2025 was £8.2 billion, an increase of 5% from the previous year. This corresponds to £51.0 billion of R&D expenditure, 7% higher than the previous year
-
this is the first publication to include statistics for the new merged R&D expenditure credit (Merged RDEC) and enhanced R&D intensive support (ERIS) schemes, that were introduced for accounting periods beginning on or after 1 April 2024, replacing both previous R&D tax relief schemes
-
in 2024 to 2025 the estimated amount of tax relief claimed through the Small and Medium-sized Enterprise (SME) and ERIS schemes fell by 29% compared with the previous year, to £2.3 billion. This was largely due to a combination of SMEs claiming under the new Merged RDEC scheme, and the new rates of relief available under the SME scheme being available for a full year of expenditure
-
the amount of relief claimed through the RDEC and Merged RDEC schemes increased by 29% to £5.9 billion as companies began claiming under the new schemes, and 2024 to 2025 featuring a full year of expenditure claimed at the increased RDEC rate of 20%
-
the number of R&D tax credit claims for the financial year 2024 to 2025 was estimated as 40,325, a decrease of 17% from the previous year. This was driven by an estimated 19% decrease in claims by SMEs; the number of claims made by large companies increased by an estimated 4%
-
the average claim value increased by 27% in 2024 to 2025 compared with the previous year. This contributed to an increase in the total value of R&D relief claimed, despite a reduction in the volume of claims
-
the increase in average claim value was driven by claims over £2m which saw a rise of 14% in the number of claims and 21% in the value of those claims, when compared with the previous year
-
consistent with patterns observed in previous years, a small proportion of claims (6%) accounted for 69% of the total value of claims in 2024 to 2025
-
the Information & Communication, Manufacturing, and Professional, Scientific & Technical sectors continued to have the greatest volume of claims, making up 75% of total claims and 71% of the total amount claimed for the financial year 2024 to 2025
-
consistent with previous years, there is a concentration of claims by companies with registered offices in London (24% of total claims and 30% of total amount claimed), and the South East (15% of total claims and 19% of total amount claimed). However, the registered office location may not be where all the R&D activity takes place
2. Introduction
This is a National Statistics publication produced by HM Revenue and Customs (HMRC). National Statistics are accredited official statistics.
It provides information on the number of companies claiming Research and Development (R&D) tax credits and the associated cost to the Exchequer for claims covering accounting periods that end in a particular financial year. The most recent year for which information is available is the 2024 to 2025 financial year. Claims for the financial year 2024 to 2025 can still be submitted past the cut-off date for this publication. The statistics for the latest financial year are therefore provisional and have been adjusted to account for claims not yet received. Additionally, all figures have been independently rounded to the nearest 5 or £5 million. This can lead to components not summing to the totals shown.
Statistics will be revised in next year’s publication to include claims received after the cut-off date, which can sometimes result in large changes between the publications. Similarly, this year’s publication revises figures for financial years 2021 to 2022, 2022 to 2023 and 2023 to 2024.
The statistical tables are published on GOV.UK alongside this commentary document, together with information on the background and methodology.
The next release is planned to be in Autumn 2027.
Statistical contacts: N Yates and M Rowe-Brown; ct.statistics@hmrc.gov.uk
Media enquiries: HMRC Press Office; news.desk@hmrc.gov.uk
3. Changes to R&D tax reliefs covered in this publication
These statistics are the first to incorporate the changes made to the R&D tax reliefs from April 2024, announced at Autumn Statement 2023. For accounting periods beginning on or after 1 April 2024, most companies claiming R&D tax relief do so through the new Merged RDEC scheme. Only loss-making SMEs who meet the intensity criterion can claim under the new ERIS scheme. The previous R&D tax relief schemes became unavailable for accounting periods beginning on or after 1 April 2024.
The rate of R&D expenditure credit under the Merged RDEC scheme is 20% — the same as the expired RDEC scheme. ERIS enables loss-making R&D intensive SMEs to deduct an extra 86% of their qualifying costs in calculating their adjusted trading loss, and claim a payable tax credit worth up to 14.5% of the surrenderable loss — the same as the higher rate of relief for R&D intensive SMEs introduced within the previous SME scheme in April 2023.
There is also a change in who is eligible to claim on contracted out R&D expenditure in the Merged RDEC scheme. Under the previous RDEC scheme, the claim was made by the company performing the R&D. Under the Merged RDEC scheme, whichever company is the decision-maker is able to claim. In most cases this will be the company contracting out the R&D. This could result in changes to the population of claimants over time: for example, SMEs that previously claimed RDEC as contractors may have smaller or fewer claims for R&D tax relief under the Merged RDEC scheme.
These changes mean that SMEs which are not loss-making or do not qualify as R&D intensive now claim under the Merged RDEC scheme. Given the scale of these changes, and their introduction part way through 2024 to 2025, SME-level figures in 2024 to 2025 are not comparable with previous years. Similarly, the number of Merged RDEC claims by SMEs is not comparable with RDEC claims by SMEs in previous years’ data tables, or the charts below. The combined number of Merged RDEC and RDEC claims by large companies is comparable with RDEC claims by large companies in previous years, however.
The above changes exclusively impact claims relating to the 2024 to 2025 financial year.
4. Number of claims
The total number of R&D claims for the financial year 2024 to 2025 is estimated to be 40,325 — a decrease of 17% from the previous year (figure 1 and table RD1).
This is comprised of 24,570 claims across the SME (including R&D intensive SMEs) and ERIS schemes and 15,760 RDEC and Merged RDEC claims. The number of non-intensive SME claims can be broken down as: 11,105 claims which are purely for a deduction from CT liability and 8,495 claims which include a payable tax credit element in the financial year 2024 to 2025. In addition, there were 4,965 SME Intensive and ERIS claims. Overall, there was a 36% decrease in the total number of claims across the SME and ERIS schemes compared with the previous year.
The decrease in SME scheme and ERIS claims is partly due to the introduction of the new schemes, as a number of SMEs now instead make claims under the Merged RDEC scheme. However, across all claims by SMEs (including RDEC and Merged RDEC claims made by SMEs) there was a 19% drop in the number of claims made for R&D relief compared with the previous year.
Across the RDEC and Merged RDEC schemes there were a total of 15,760 claims in 2024 to 2025. This represents a 50% increase when compared with RDEC claims in the previous year, primarily driven by the introduction of Merged RDEC and SMEs claiming under this new scheme. An estimated 91% of Merged RDEC claims made in 2024 to 2025 came from SMEs.
There were 3,800 claims for the RDEC and Merged RDEC schemes made by large companies in 2024 to 2025, a 4% increase over the number of RDEC claims by large companies in 2023 to 2024.
Figure 1: Number of claims for R&D tax relief by scheme between 2017 to 2018 and 2024 to 2025
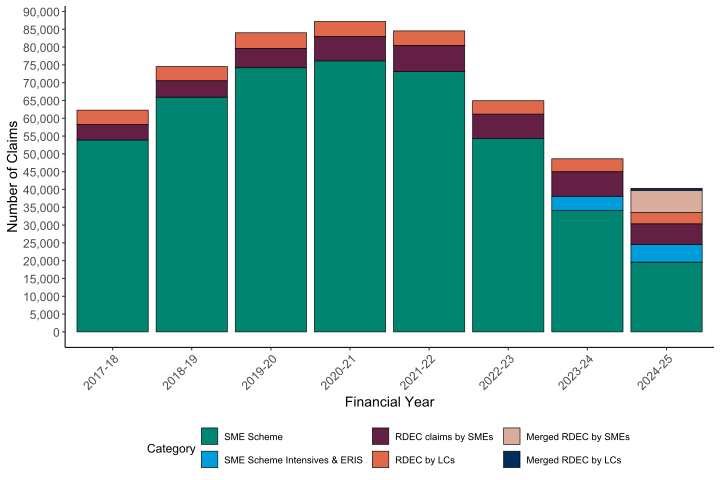
The fall in the number of R&D claims for the financial year ending March 2025 continues a downward trend in claim volumes in recent years, following a number of changes to the schemes which continue to apply to the reliefs in the 2024 to 2025 financial year. A key driver of the decrease is believed to be the continuing impact of the additional information form (AIF). This was brought in alongside other administrative changes to the schemes in order to improve levels of compliance in the R&D reliefs, and is mandatory for all R&D claims submitted from 8 August 2023. All claimants must now complete an AIF when making a claim for R&D tax relief.
The 2024 to 2025 financial year sees the introduction of the Merged RDEC and ERIS schemes for accounting periods beginning on or after 1 April 2024. In addition, for those still claiming through the old SME and RDEC schemes, the 2024 to 2025 financial year is the first year to be fully based on the new rates of relief: a 20% taxable credit for RDEC, and an 86% expenditure enhancement with a 10% payable credit for surrendered losses in the SME scheme (14.5% for R&D intensive SMEs). Since these rates apply to expenditure incurred on or after 1 April 2023, they were only partially effective for the 2023 to 2024 financial year.
The Merged RDEC scheme continues to apply the 20% taxable credit from RDEC with updated subcontracting rules, while ERIS maintains the 86% expenditure enhancement and 14.5% payable credit for loss-making, R&D intensive SMEs.
5. Amount of relief claimed
The total support claimed across all R&D schemes for the financial year 2024 to 2025 is estimated to be £8.2 billion (figure 2 and table RD2). This is an increase of 5% from last year’s total of £7.8 billion.
Figure 2: Total support claimed through R&D tax credits by scheme between 2017 to 2018 and 2024 to 2025 (£ million)
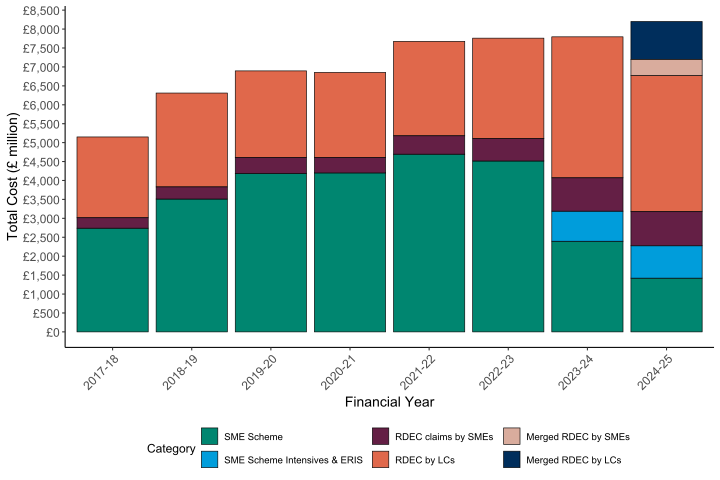
The £8.2 billion is comprised of £2.3 billion claimed across the SME and ERIS schemes and £5.9 billion claimed through the RDEC and Merged RDEC schemes. Large companies received £4.6 billion of relief across the schemes, while SMEs received £3.6 billion.
6. R&D expenditure
Given the significant changes to the schemes and rates of relief available to claimants between 2022 to 2023 and 2024 to 2025, the amount of qualifying R&D expenditure used to claim R&D tax relief possibly provides a better comparator of recent trends.
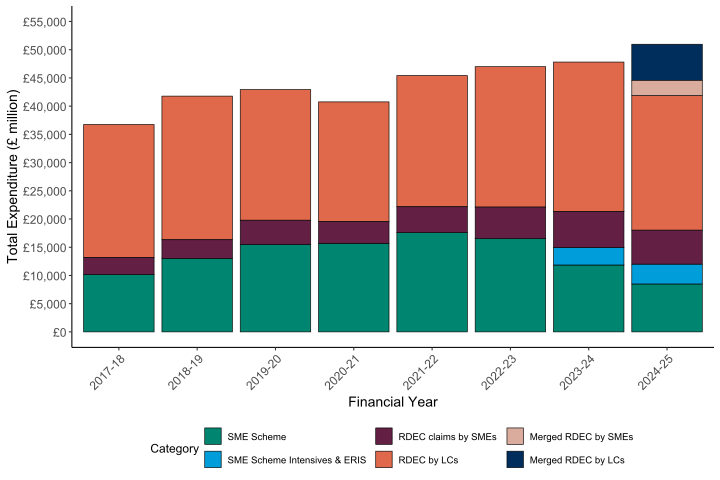
Qualifying R&D expenditure is estimated to be £51.0 billion for the financial year 2024 to 2025, an increase of 7% from the previous year (figure 3 and table RD4). Of all qualifying R&D expenditure in the latest year, 76% was by companies claiming under either the RDEC or Merged RDEC scheme.
Claims were made on £20.7 billion of R&D expenditure by SMEs, which is a 3% decrease from the previous year’s figure of £21.3 billion. Qualifying R&D expenditure by large companies increased by 14% to £30.2 billion in the 2024 to 2025 financial year.
Figure 3: R&D expenditure used to claim R&D tax relief by scheme between 2017 to 2018 and 2024 to 2025 (£ million)
7. Regional analysis
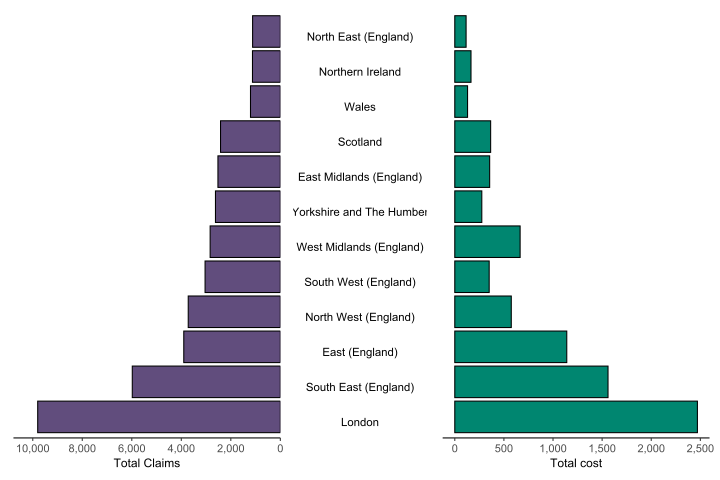
Figure 4 and table RD5 show the regional distribution of R&D tax credit claims by the company’s registered address for the financial year 2024 to 2025. The registered address may not be where actual R&D activity is carried out.
The following figures reflect the top 3 regions with the highest number of claims and total amount claimed. Companies with registered offices in London accounted for 24% of total claims and 30% of the total amount claimed. The South East represented 15% of total claims and 19% of the total amount claimed. The East of England contributed 10% of total claims and 14% of the total amount claimed for the financial year 2024 to 2025.
The proportions of claims and amount claimed by region are in line with those seen in recent years.
Figure 4: Number and amount of R&D tax relief claimed by region of company registered address for 2024 to 2025 (£ million)
8. Industry sector analysis
Figure 5 and table RD6 show the distribution of R&D tax credit claims by industry sector for the financial year 2024 to 2025. The coding of industry sectors may not always reflect the sector of companies’ R&D activity.
Figure 5: Number and amount of R&D tax relief claimed by industry sector for 2024 to 2025 (£ million)
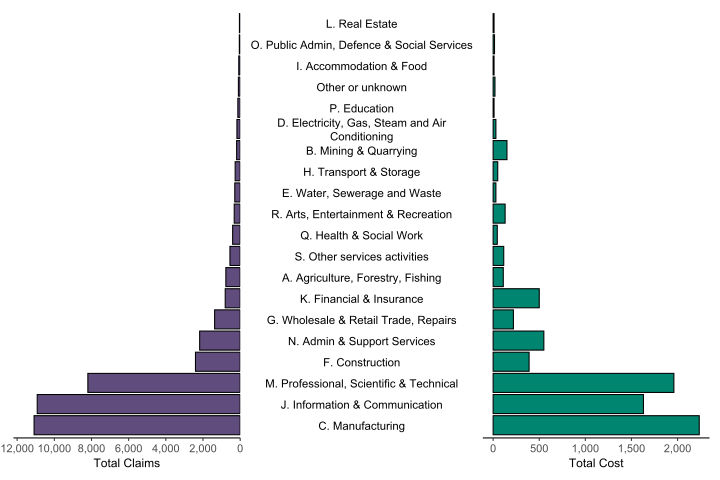
The largest claiming sectors are the Manufacturing (27% of claims and value of relief), Information & Communication (27% of claims, 20% of relief value), and Professional, Scientific & Technical (20% of claims, 24% of relief value) sectors. These trends remain similar to previous years.
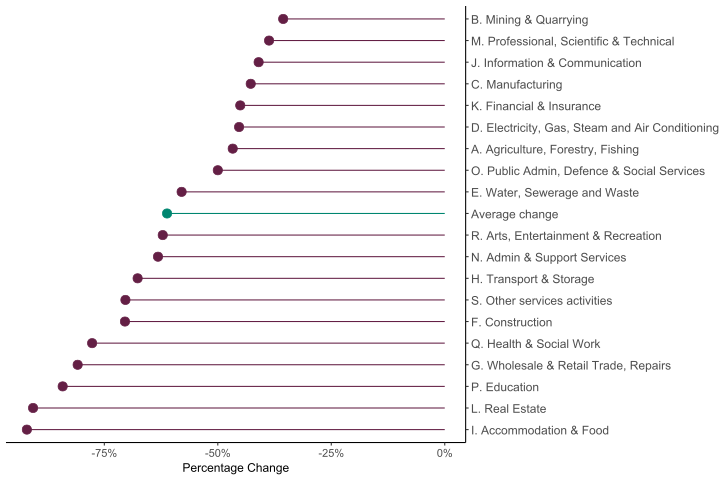
As mentioned in earlier sections of the publication, there has been a substantial fall in the number of claims made in recent years. Figure 6 shows that between the 2021 to 2022 financial year and the 2024 and 2025 financial year, claims fell across all industry sectors. Five sectors have seen a decrease of over 75% since the 2021 to 2022 financial year: Accommodation & Food; Real Estate; Education; Wholesale & Retail Trade, Repairs; and Health & Social Work. However, it should be noted that while the proportional drop in these sectors is large, they represent some of the smaller sectors by volume. Those with the smallest decrease over the years include the 3 largest sectors as well as Mining & Quarrying.
Figure 6: R&D tax relief claims by industry sector; percentage change between 2021 to 2022 and 2024 to 2025
9. Cost band analysis
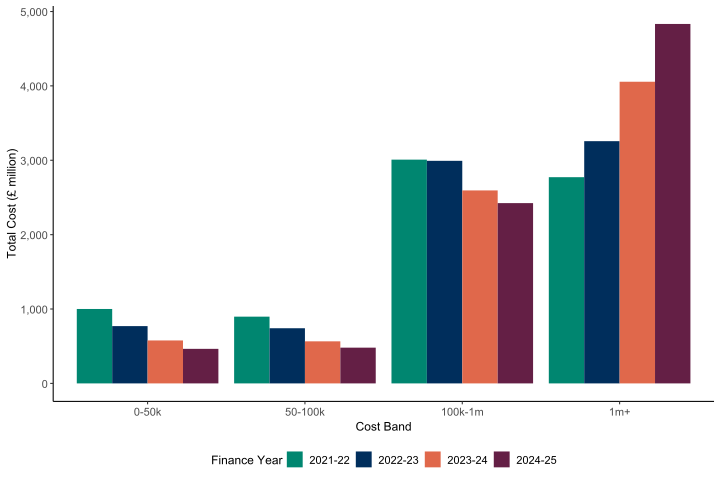
Figures 7 and 8, and table RD7, show the distribution of R&D tax credit claims by cost band for the financial year 2024 to 2025.
In the financial year 2024 to 2025, 58% of claims fell within the cost bands up to £50,000; however, these claims accounted for only 6% of the total value of relief claimed. By contrast, 6% of claims fell within the cost bands of £500,000 and above, but accounted for 69% of the total value of relief claimed. This pattern is consistent with previous years. However, the proportion of total relief claimed within the £500,000-and-above cost bands increased from 62% in 2023 to 2024 to 69% in 2024 to 2025, while the proportion of claims in these bands increased from 5% to 6%. This is partly due to the increased rates of relief in the RDEC scheme now applying in full, as the RDEC scheme covers the largest claimants of R&D tax relief.
Figure 7: Number of R&D tax relief claims by cost band between 2021 to 2022 and 2024 to 2025
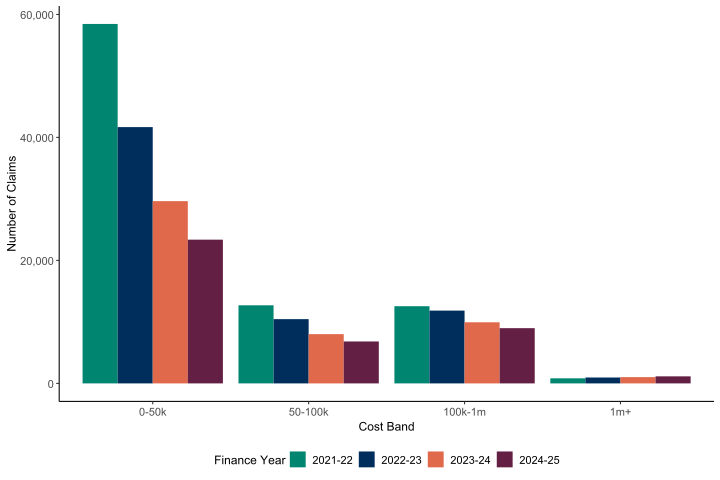
Figure 8: Amount of R&D tax relief claimed by cost band between 2021 to 2022 and 2024 to 2025 (£ million)
10. First-time applications
Figure 9 and table RD8 show the number of first-time applicants in the SME and RDEC schemes for each year. Partial data for the financial year 2024 to 2025 has not been included in figure 9.
In the financial year 2023 to 2024, there was a 43% decrease in the overall number of first-time applicants from the previous year. This is the fifth consecutive year that the overall number of first-time applicants has decreased. Prior to the 2019 to 2020 financial year, the number of first-time applicants had increased year-on-year.
Figure 9: Number of first-time R&D tax relief claimants between 2017 to 2018 and 2023 to 2024
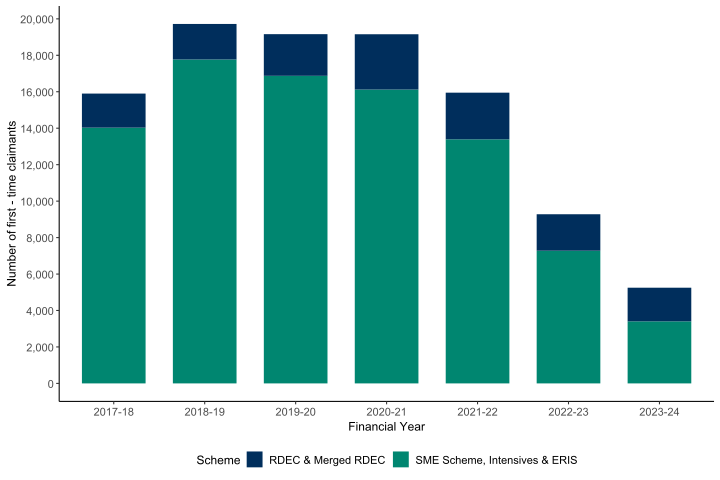
For the financial year 2023 to 2024, the number of first-time applicants in the SME scheme was 3,405, a decrease of 53% from the previous year.
The number of first-time applicants for the RDEC scheme was 1,845 for the financial year 2023 to 2024, an 8% decrease from the previous year.
11. Error and Fraud
An updated estimate of error and fraud in the R&D schemes was published in HMRC’s 2026 annual report. This estimate relates to the 2023 to 2024 financial year. For illustrative purposes HMRC also considered the possible error and fraud position for the financial years 2024 to 2025 and 2025 to 2026. Details can be found on page 107 of HMRC’s annual report and accounts 2025 to 2026.
The statistics contained in this publication do not include any assessment of the levels of error and fraud within the schemes.