Coroners statistics 2022: England and Wales
Published 11 May 2023

© Crown copyright 2023
This publication is licensed under the terms of the Open Government Licence v3.0 except where otherwise stated. To view this licence, visit nationalarchives.gov.uk/doc/open-government-licence/version/3 or write to the Information Policy Team, The National Archives, Kew, London TW9 4DU, or email: psi@nationalarchives.gov.uk.
Where we have identified any third party copyright information you will need to obtain permission from the copyright holders concerned.
This publication is available at https://www.gov.uk/government/statistics/coroners-statistics-2022/coroners-statistics-2022-england-and-wales
1. Main Points
| Increase in the number of deaths reported to coroners in 2022 | 208,400 deaths were reported to coroners in 2022, the highest level since 2019 – up 7% (13,300) compared to 2021. |
| 36% of all registered deaths were reported to coroners in 2022 | The proportion of registered deaths in England and Wales reported to coroners is at the highest level since 2019. |
| Deaths in state detention, down 8% in the last year | 534 deaths in state detention were reported to coroners in 2022 (down from 580 in 2021), the decrease was driven by a 20% fall in deaths in prison custody. |
| Post-mortem examinations were carried out on 43% of all deaths reported in 2022 | There were 90,200 post-mortem examinations ordered by coroners in 2022, a 7% rise compared to 2021. The proportion of reported deaths requiring a post-mortem has remained stable over the same period. |
| 11% more inquests opened in 2022 | 36,300 inquests were opened in 2022, up 11% compared to 2021. |
| Inquest conclusions up 10%, the largest rise seen in natural causes, accident/misadventure and unclassified conclusions | In 2022, 35,600 inquest conclusions were recorded in total, up 10% on 2021. Natural causes, accident/misadventure and unclassified conclusions had the largest increases, up 40%, 14% and 7% on 2021, to 5,100, 8,800 and 8,700 inquest conclusions in 2022 respectively. |
| Average time taken to complete an inquest fell by less than one week | The estimated average time taken to process an inquest decreased from 31 weeks in 2021 to 30 weeks in 2022. |
| Prevention of Future Deaths reports down by 8% | 403 Prevention of Future Deaths reports were issued in 2022, a decrease of 8% compared to 2021. |
This annual publication presents statistics of deaths reported to Coroners in England and Wales in 2022. Information is provided on the number of deaths reported to coroners, post-mortem examinations and inquests held, and conclusions recorded at inquests. A map reference of Coroner areas in England and Wales is available in the supporting document published alongside this bulletin. For previous editions of this report please see: www.gov.uk/government/collections/coroners-and-burials-statistics.
2. Statistician’s comment
The total number of registered deaths in England and Wales fell in 2022, compared to the previous year, whilst the number of deaths reported to coroners rose by 7% (from 195,000 to over 208,000) in that same period. Deaths reported to coroners as a percentage of registered deaths increased by 3 percentage points (from 33% to 36%), gradually returning to the pre covid share.
In 2022, coroners opened the highest number of inquests since reporting began, with an increase in recorded conclusions and post-mortems. Circa 17% of deaths reported to coroners proceeded to an inquest and, of the 36,000 inquest conclusions recorded, natural causes, accident/misadventure and unclassified conclusions were the most prevalent, up 40%, 14% and 7% on 2021 respectively. Further research is required to understand the marked increase in natural causes conclusions.
Suicide conclusions have gone up year on year since 2016, except for 2020[footnote 1]. The highest number of suicide conclusions was recorded this year, driven by an increase in male suicides which went up by 3% to its highest recorded level since records begun.
On average, over a quarter of coroner areas completed an inquest within 24 weeks of the date on which they were made aware of the death in line with Rule 8 of the Coroners (Inquests) Rules 2013. Time taken to process an inquest decreased by less than 1 week to 30 weeks this is still higher than the pre-pandemic baseline. It is expected that timeliness will continue to decrease as coroners continue work to clear the backlog of cases built up because of the pandemic.
3. Deaths Reported
7% increase in the number of deaths reported to coroners in 2022
208,430 deaths were reported to coroners in 2022, the highest level since 2019. This is an increase of 13,250 (7%) from 2021.
36% of all registered deaths were reported to coroners in 2022
The percentage of all registered deaths that were reported to coroners has increased by three percentage points when compared to 2021 and is the highest level since 2019, marking a return to pre-covid levels.
All deaths in England and Wales must be registered with the Registrar of Births and Deaths and statistics on all registered deaths are published by the Office for National Statistics (ONS). The ONS mortality statistics, based on death registrations, report the number of deaths registered in England and Wales in a particular year irrespective of whether a coroner has investigated the death.
The Ministry of Justice’s coroner statistics provide the number of deaths which are reported to coroners in England and Wales. The coroner has a duty to investigate when there is reason to believe that the death is violent, unnatural, the cause of death is unknown or occurring in custody or other state detention. Further background information is provided in Chapter 1 of the supporting guidance document.
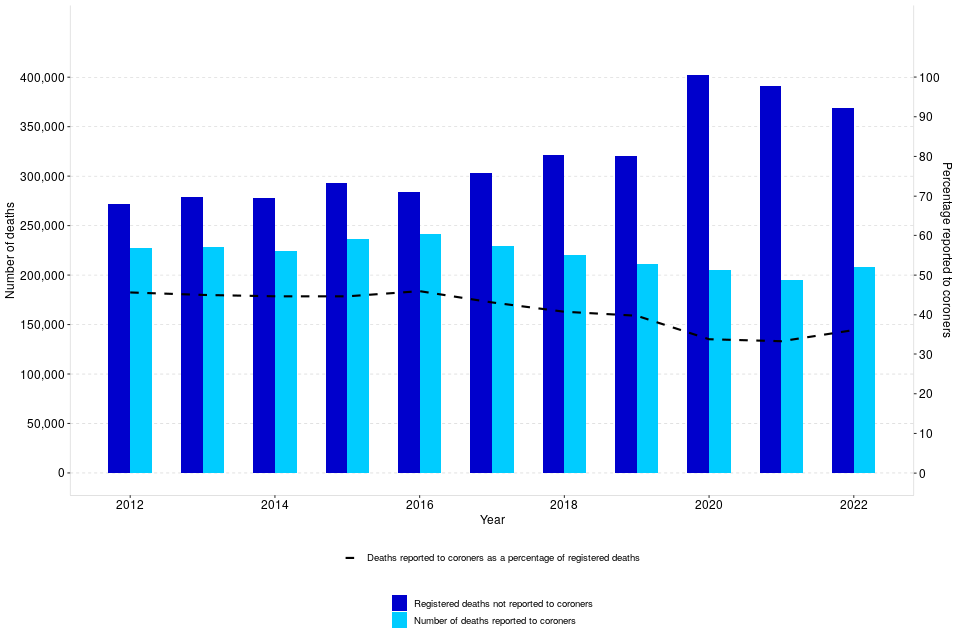
The number of deaths reported to coroners in 2022 increased by 13,250 (7%) to 208,430, the highest level since 2019. In comparison, ONS registered deaths fell 9,157 (2%)[footnote 2] from 2021 to 2022. The proportion of registered deaths in 2022 that were reported to coroners was 36%, up three percentage points from 2021.
The number of registered deaths in England and Wales had been broadly increasing, from a low of 484,367 in 2011 to 541,589 in 2018. 2019, however, saw a decrease to 530,857, before rising to 607,922 in 2020 – the highest level in absolute terms since reporting began, due to the Covid-19 pandemic. Following this, 2021 saw a fall to 586,334. ONS provisional figures for 2022 shows a further decrease to 577,177. The number of deaths reported to coroners initially followed a similar trend, from a low of 222,371 in 2011 and then rising to a high of 241,211 in 2016. However, deaths reported to coroners between 2017 to 2021 fell (there was a decrease in both deaths registered and deaths reported in 2019 and 2021), as shown in figure 1. This shows a reversal to similar broadly stable levels seen prior to 2015. 2022 saw an increase in the number of deaths reported to coroners for the first time since 2016.
Further research and analysis are required to understand the increase in deaths being referred to the coroner and whether this could be the beginning of an established pattern.
Figure 1: Registered deaths and deaths reported to coroners, England and Wales, 2012-2022 (Source: Table 2)
Out of England and Wales Orders
To take a body of a deceased person out of England and Wales, notice must be given to the coroner within whose area the body is lying. When the coroner gives permission for the removal of a body, an Out of England and Wales order is issued.
Coroners issued 5,332 Out of England and Wales orders in 2022, compared with 5,751 issued in 2021. In 2022, the number of orders issued represented 3% of the total number of deaths reported to coroners, showing no significant year on year change over the past five years, (see Table 5).
Deaths abroad
Of the 208,430 deaths reported to coroners in 2022, around 1% (1,474) were reports of deaths that had occurred outside England and Wales, showing no significant year on year change over the past five years. The number of deaths abroad increased by 103% (749 cases) in 2022 compared to the same period a year earlier (725 cases), showing a recovery after a sharp fall in 2020 and 2021 due to the Coronavirus pandemic when travel abroad was restricted.
4. Deaths in State Detention
Deaths in state detention, down 8% in the last year
Deaths in state detention reported to coroners decreased by 8% to 534 in 2022, driven by a fall in number of deaths in prison custody.
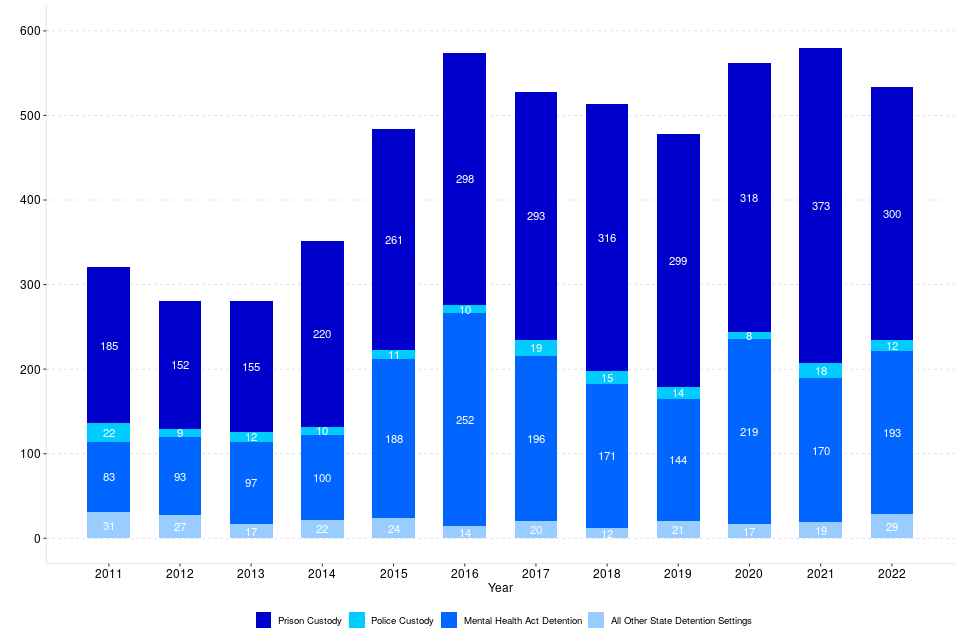
In 2022, a total of 534 deaths which occurred in state detention were reported to coroners[footnote 3], a decrease of 46 deaths (8%) on the previous year and representing less than 1% of all deaths reported to coroners.
There were 193 deaths of individuals subject to Mental Health Act Detention in 2022, a 14% increase (23 cases) compared to 2021. The Care Quality Commission reported 270 deaths under the Mental Health Act 1983 (as amended)[footnote 4] in financial year 2021/22, down 26% on the number they reported in 2020/21 (363 deaths).
The number of deaths in prison custody reported to coroners decreased by 20% (73 cases) compared to 2021, to 300 deaths in 2022. His Majesty’s Prison and Probation Service (HMPPS) reported 301 deaths in prison custody in 2022 (Safety in Custody Statistics[footnote 5]), down 19% on the number they reported in 2021 (371 deaths). This decrease was due to there being a spike in 2021 as a result of deaths related to Covid-19, which peaked in 2021 Q1. Compared to the 5-year average from 2016 to 2020 (305) the number of prison custody deaths only decreased by 2% in 2022. The deaths in prison custody reported by coroners (300) have been cross-referenced to deaths in prison custody recorded on the HMPPS database (301) in order to ensure consistency between these two sources. The difference is due to timing. Deaths which occur close to the end of the calendar year may be reported to the coroner in the next year causing minor discrepancies. Police custody cases decreased by 6, to 12 deaths. For more detailed information on prison custody deaths please see the Safety in Custody Statistics publication.
Figure 2: Number of deaths in state detention (excluding DoLS), by type of detention, 2011-2022 (Source: Table 6)
5. Post-Mortem examinations held
Post-mortem examinations were carried out in 43% of all deaths reported to coroners in 2022
There were 90,191 post-mortem examinations ordered by coroners in 2022, 43% of all cases reported to them (no change since 2021).
Post-mortem examinations were held in 90,191 deaths reported to coroners in 2022, up 5,592 (7%) from 2021. This represents 43% of all deaths reported to coroners in 2022, the same proportion on the 2021 amount.
From June 2022, there is a new provision to allow a coroner investigation to be discontinued where the cause of death becomes clear without there having been a post-mortem examination. This provision allows the coroner to discontinue an investigation (where the cause of death is natural) where the cause of death has been revealed through other sources and will remove the need for a post-mortem examination in such cases. Table 3 published alongside this bulletin records the number of discontinued cases.
Figure 1 of the supporting guidance document published alongside these statistics provides an overview of the possible outcomes when a death is reported to a coroner, including circumstances involving a post-mortem.
Figure 3: Post-Mortems as a percentage of deaths reported to coroners, England and Wales, 2016-2022 (Source: Tables 3-4)
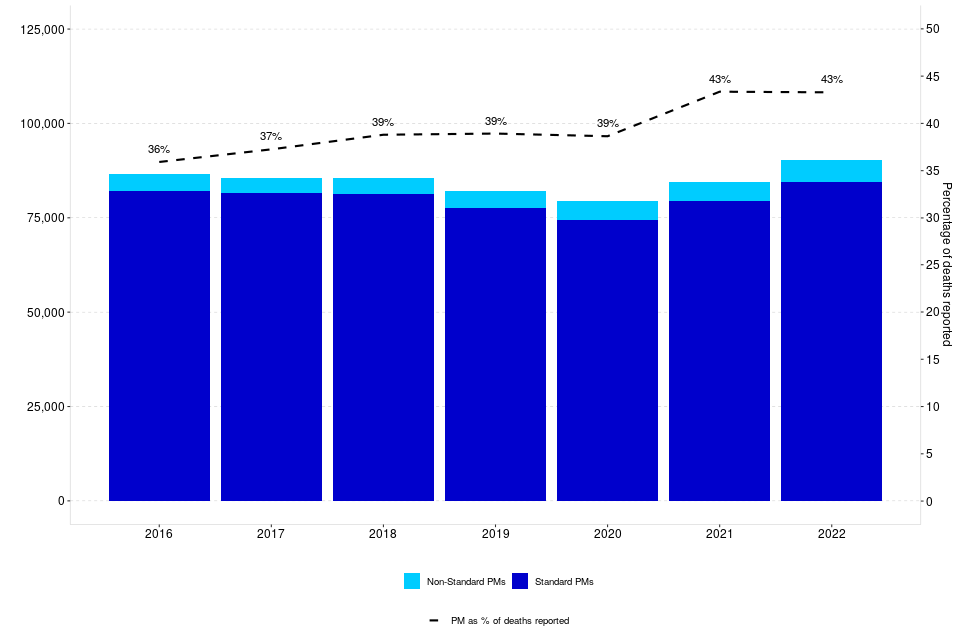
Post-mortem examinations may be classed as either standard or non-standard, depending on the nature of the examination. A non-standard post-mortem requires specialist skills. A non-standard post-mortem could, for example, require a paediatric or other specialist pathologist. In 2022, almost all (94%) of post-mortems were ordered at a standard rate – no change compared to 2021.
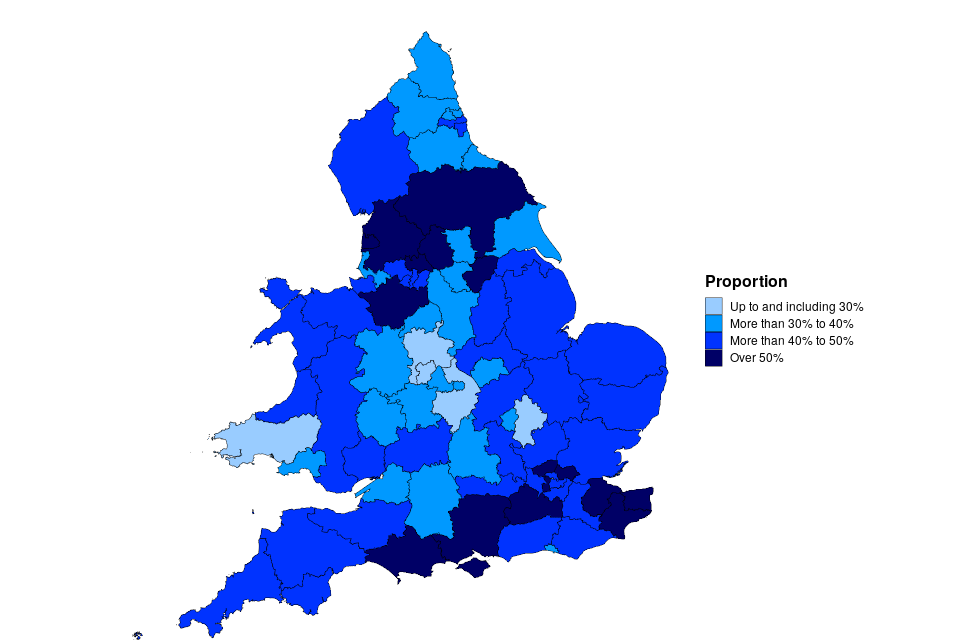
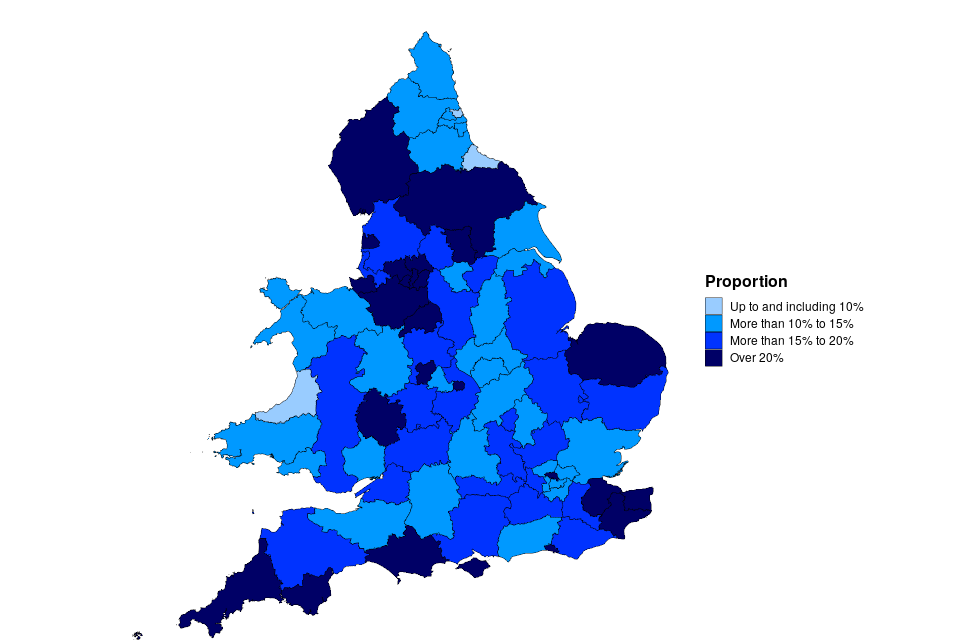
The proportion of post-mortems carried out varies from 19% of deaths reported in Staffordshire South to 69% in Surrey, as shown by Map 1. Caution should be taken when making comparisons between regions of the coronial activities – post-mortems, inquests, timeliness - as differences in local authority set-up, resource, facilities and socio-economic make up mean this will not be comparing like with like.
Map 1: Post-Mortem Examinations held as a proportion of deaths reported to coroners, England and Wales, 2022
Post-mortem examinations in inquest cases
A post-mortem examination will often be held before the coroner decides whether to open an inquest. In 2022, 51% (18,518) of deaths reported to coroners which eventually led to an inquest involved a post-mortem, down four percentage points on 2021.
Post-mortem examinations in non-inquest cases
In the majority (79%) of cases referred to coroners, there is no inquest. In 2022, there were 65,067 reported deaths which did not lead to an inquest where a post-mortem was held. The percentage of non-inquest cases that required a post-mortem has seen an increase from 39% in 2021 to 40% in 2022. The number of non-inquest investigations discontinued with a post-mortem was 12,149 in 2022.
Post-mortem examinations in potential inquest cases
Prior to July 2013 when the Coroners and Justice Act 2009 was implemented, deaths were either categorised as ‘inquest’ or ‘non-inquest’ cases. Changes in the way coroners investigate mean that there is now a third category of ‘potential inquest’ cases. This means that the coroner has opened an investigation into the death but has not yet decided whether it is necessary to hold an inquest. Depending on whether the coroner deems it necessary to hold an inquest, these cases will all eventually end up in either the ‘inquest’ or ‘non-inquest’ category. In 2022, there were 8,251 potential inquest cases being dealt with by coroners in England and Wales, with 80% requiring a post-mortem. The number of potential inquests in total has decreased by 1% in the past year.
Cases requiring neither a post-mortem nor inquest
There were 98,839 deaths reported to coroners where there was neither a post-mortem nor an inquest. These will typically be deaths in which a natural cause is present but reported to the coroner for various reasons. This type of case has increased by 5% in the current year, ending the decreasing trend seen since 2017. The proportion of all deaths reported to coroners where there was neither an inquest nor a post-mortem examination has decreased by one percentage point to 47% in 2022. This proportion has been declining since 2018 when it made up 55% of all deaths reported to coroners. Of the investigations without a post-mortem or inquest, a decision was made to discontinue 1,595 of them from June to December 2022. This was when a new provision was put in place to allow a coroner to discontinue an investigation where the cause of death has been revealed through other sources and removes the need for a post-mortem examination.
Histology, toxicology and less-invasive post-mortems
In 2022, 20% (18,465) of all post-mortems included histology, a decrease from 23% (19,140) in 2021. Post-mortems including toxicology increased by 793 cases over the same period to 21,926 (up 4%), with 24% of all post-mortems held in 2022 including toxicology - continuing the consistently rising trend.
There were 10,916 post-mortems conducted using less-invasive techniques alongside an autopsy or other invasive intervention and 8,564 using only less-invasive techniques (such as Computerised Tomography [CT] scans) in 2022. The number of post-mortems carried out using only less-invasive techniques varied from zero in 13 areas to 1,743 in Lancashire and Blackburn with Darwen. South Yorkshire (Eastern), Black Country, Lancashire and Blackburn with Darwen, Stoke-on-Trent and North Staffordshire, Rutland and North Leicestershire, and Leicester City and South Leicestershire conducted over a half (100%, 87%, 81%, 66%, 62% and 62% respectively) of all their post-mortems using only less-invasive techniques. South Yorkshire (Western), Staffordshire South, West Yorkshire (Western), and Inner West London conducted over a quarter of all their post-mortems using less-invasive techniques (40%, 33%, 31% and 25% respectively).
Additionally, 14 post-mortems were conducted following a request from a defence lawyer (less than 1% of all post-mortems) and 2% (2,111) of post-mortems in 2022 were conducted by a Home Office (HO) forensic pathologist. These would usually be held in relation to a criminal investigation.
6. Inquests Opened
11% increase in inquests opened in 2022 (Source: Table 2)
The number of inquests opened in 2022 increased by 3,511 (up 11%) to 36,273.
There were 36,273 inquests opened in 2022, an increase of 11% on 2021. This is the highest number of inquests opened since 1995[footnote 6], excluding the years when DoLS investigations were required.
Inquest cases represented 17% of all the deaths reported to coroners in 2022, no change from 2021. The number of inquests opened as a proportion of deaths reported in 2022 varied across coroner areas, from 6% in Ceredigion to 38% in Liverpool and the Wirral. However, most coroner areas held inquests for between 10% and 20% of all deaths reported (55 of the 83 coroner areas). Map 2 shows the inquests opened as a proportion of deaths reported in 2022 for all coroner areas in England and Wales.
Inquests with juries and suspended investigations (table source: Table 9)
A jury is required by law in certain inquests, including non-natural deaths in custody or other state custody or where police forces were involved. Coroners can exercise discretionary powers to hold a jury inquest where they deem it appropriate.
There were 476 inquests held with juries in 2022 (representing 1% of all inquests), an increase of 47 (11%) compared to 2021 and a decrease of 4% when compared to the 5-year pre-pandemic average.
In 2022, 787 investigations were suspended (and not resumed) by the coroner under Schedule 1[footnote 7] of the Coroners and Justice Act 2009 because criminal proceedings took place. Of these, 748 had an inquest open at the time of suspension, representing 2% of all inquests concluded, no change compared to 2021.
Map 2: Inquests opened as a proportion of deaths reported to coroners, England and Wales, 2022
7. Inquest Conclusions
10% increase in inquest conclusions recorded, with the largest increase seen in natural causes, accident/misadventure and unclassified conclusions
In 2022, 35,643 inquest conclusions were recorded, up 10% on 2021. Inquest conclusions of natural causes, accident/misadventure and unclassified conclusions were up 40%, 14% and 7% on 2021 to 5,139, 8,779 and 8,173 respectively.
There were 35,643 inquest conclusions recorded in 2022, up 3,321 (10%) from 2021, in part reflecting the change in the number of inquests opened and possibly due to a backlog caused by the Covid-19 pandemic. This is the highest level since 2016. Conclusions are recorded after an inquest. Which means the conclusions recorded in a certain year may relate to deaths from the same year or earlier years. Background information on inquest conclusions is provided in Chapter 1 of the supporting guidance document.
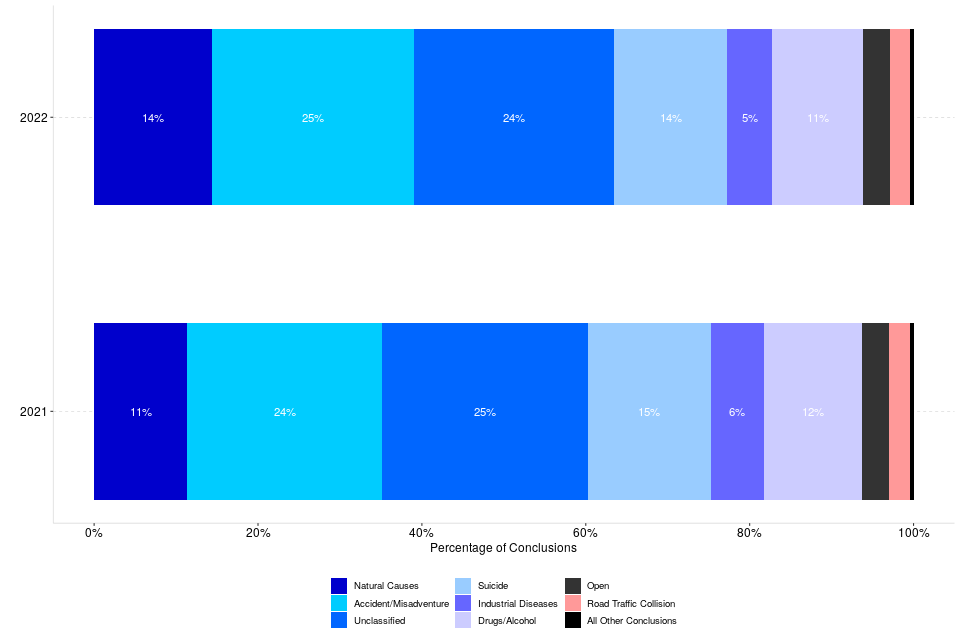
In 2022, the most common short form conclusions (by order of frequency) were death by misadventure (8,779 or 25% of all conclusions), death by natural causes (5,139 or 14%) and suicide (4,904 or 14%). Unclassified conclusions (which include narrative conclusions) made up 24% (8,713) of all inquest conclusions in 2022.
A narrative conclusion is where the coroner or jury do not rely on one of the short-form conclusions and usually involves setting out the answers to the four statutory questions the coroner is required to answer in more detail.
The number of suicide conclusions increased by 2% compared to 2021, to the highest level since 1995. The increase was in males (3% compared to 2021), with the number in females falling (decreasing by 1% compared to 2021). The overall increase may be a consequence of the change in the standard of proof established by the Supreme Court in the case of Maughan.
Industrial disease conclusions fell by 7% in the last year (to 2,000 cases), the lowest level since 1997.
Figure 4: Number of conclusions recorded at inquests, England and Wales, 2012-2022 (Source: Table 7)
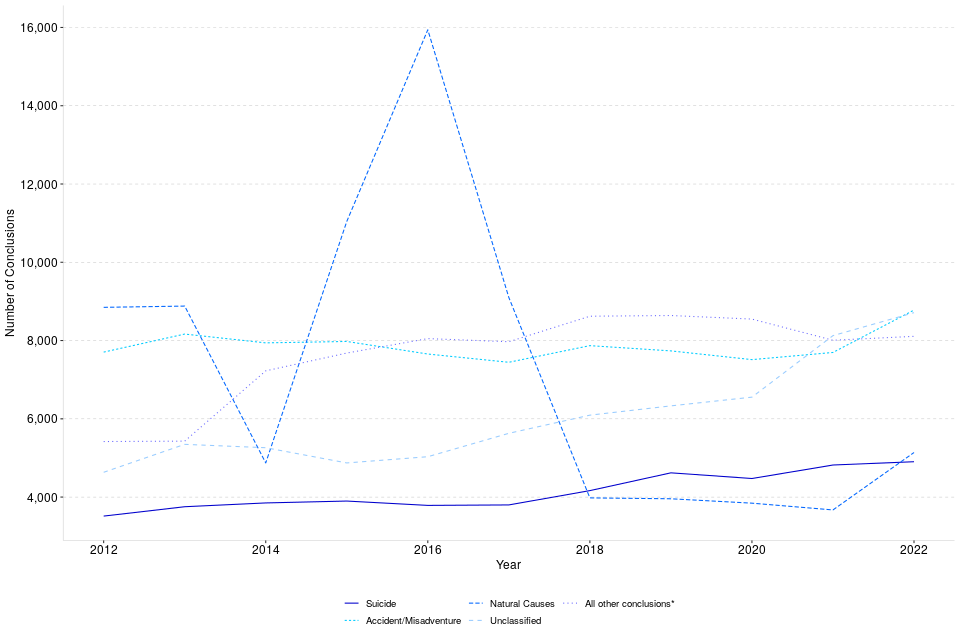
*Includes Killed unlawfully; Killed lawfully; Lack of care or self-neglect; Stillborn; Open; Industrial Disease; Drugs/Alcohol related[footnote 8]; and Road traffic collision.
In 2022, natural causes conclusions increased by 40% to 5,139. This increase in natural cause conclusions may suggest that there is an increase in natural cause deaths being referred to the coroner.
In 2022, the number of unclassified conclusions increased by 586 cases (up 7%) to 8,711. Unclassified conclusions made up 24% of all inquest conclusions in 2022, a decrease in proportion by one percentage point compared to the 2021 amount. The rise in unclassified conclusions seen until 2014 and again from 2016 is partly due to the increasing use of what are known as ‘narrative conclusions’ by some coroners. In these cases, the conclusion is recorded as unclassified. As well as narrative conclusions, this category includes short non-standard conclusions which a coroner or jury might return when the circumstances do not easily fit any of the standard conclusions[footnote 9].
The proportion of conclusions recorded as suicide has remained broadly constant over the past five years, seeing a decrease from 15% of all conclusions in 2021 to 14% in 2022. This proportion varies from 6% in Coventry to 29% in East Sussex.
For the remaining conclusion types, alcohol/drugs related deaths continued to increase. This year it increased by 83 cases (up 2%) to 3,973, the highest it has been since 2014. Road traffic collisions increased by 60 cases (up 7%) to 880.
Open conclusions have seen a decrease over the last decade - they accounted for 3% in 2022 compared with 7% in 2012, although 2022 saw a 10% increase compared to 2021.
Figure 5 shows the proportion changes in inquest conclusions between 2021 and 2022.
Figure 5: Conclusions recorded at inquest, by category and as a proportion of all conclusions, England and Wales, 2021 and 2022 (Source: Table 7)[footnote 10] [footnote 11]
8. Inquest Conclusions by Sex
Conclusions recorded at inquests by sex[footnote 12]
Male deaths accounted for 64% of all conclusions recorded in 2022 while female deaths accounted for 36%. In 2021, the percentages were 65% and 35% respectively.
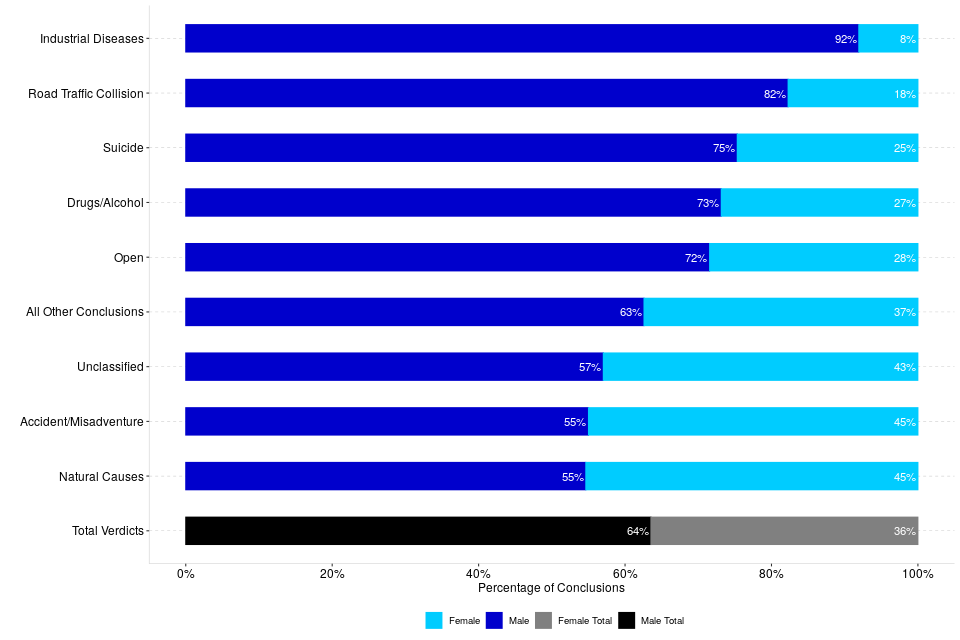
The pattern of conclusions recorded differs between males and females. Males accounted for 57% of deaths reported but 64% of all conclusions recorded in 2022; this suggests that males are more likely to die in circumstances that lead to an inquest.
Correspondingly, female deaths accounted for 36% of all conclusions recorded in 2022 (and 43% of all deaths reported). Figure 6 shows the variation in the sex proportions, depending on the type of inquest conclusion. Industrial disease had the highest proportion of inquests relating to males, at 92%, and natural causes had the highest proportion of inquests relating to females[footnote 13], at 45%.
Figure 6: Conclusions recorded at inquests by sex, England and Wales, 2022 (Source: Table 7)
9. Inquest Conclusions by Age
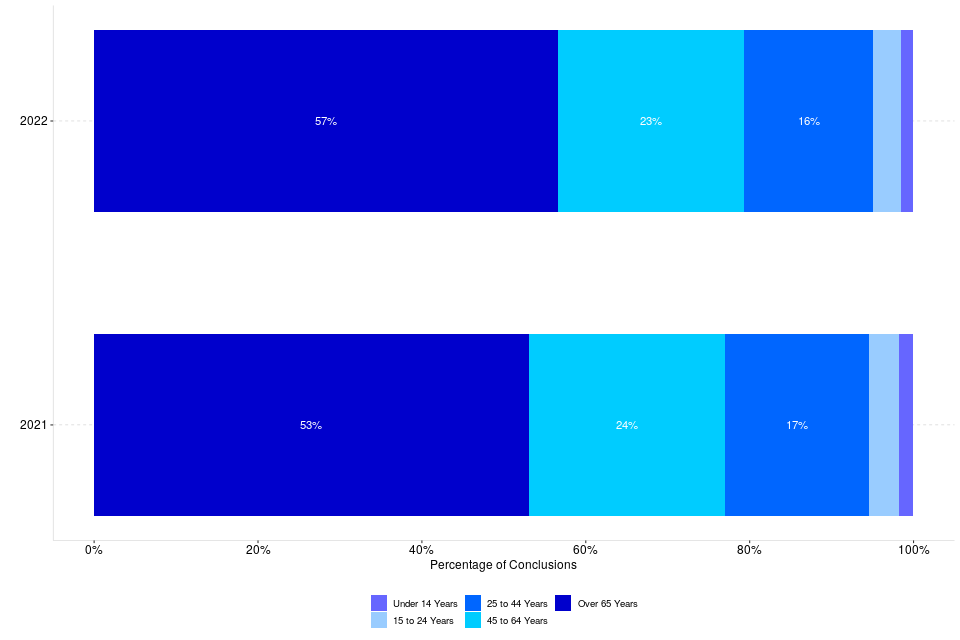
The majority of inquests completed were for those aged 65 years and over
Of the inquests completed in 2022, 57% related to persons who were aged 65 years or over at time of death compared with 5% relating to persons under 25 years of age.
The profile of the age of deceased at inquests has changed slightly from 2021 to 2022. The percentage of inquests completed relating to persons aged 65 or over has increased by four percentage points from 53% to 57%. By contrast, 5% of inquests concluded related to persons under 25 years of age, down one percentage point compared to 2021, while the percentage of those between 25 and 65 years fell from 41% to 39% (see Table 8).
Although an age breakdown of registered deaths in England and Wales in 2022 is not yet available, ONS figures for 2021[footnote 14] show that 84% of registered deaths in England and Wales were persons aged 65 or over, with only 1% aged under 25 years old.
Figure 7: Proportion of inquest conclusions by age of deceased, England and Wales, 2021 and 2022 (Source: Table 8)[footnote 15]
10. Time taken to process an inquest
Overall a decrease of less than one week in the average time taken to process an inquest
The estimated average time taken to process an inquest is down from 31 weeks in 2021 to 30 weeks in 2022.
The estimated[footnote 16] average time taken to process an inquest in 2022 (defined as being from the date the death was reported until the conclusion of the inquest) was 30 weeks (see Table 13)[footnote 17], a decrease of less than one week compared to 2021. Time taken is still higher than the pre-pandemic levels where in 2019 it took an average of 27 weeks to complete an inquest. This is likely due to the backlog of cases built up as a result of the pandemic.
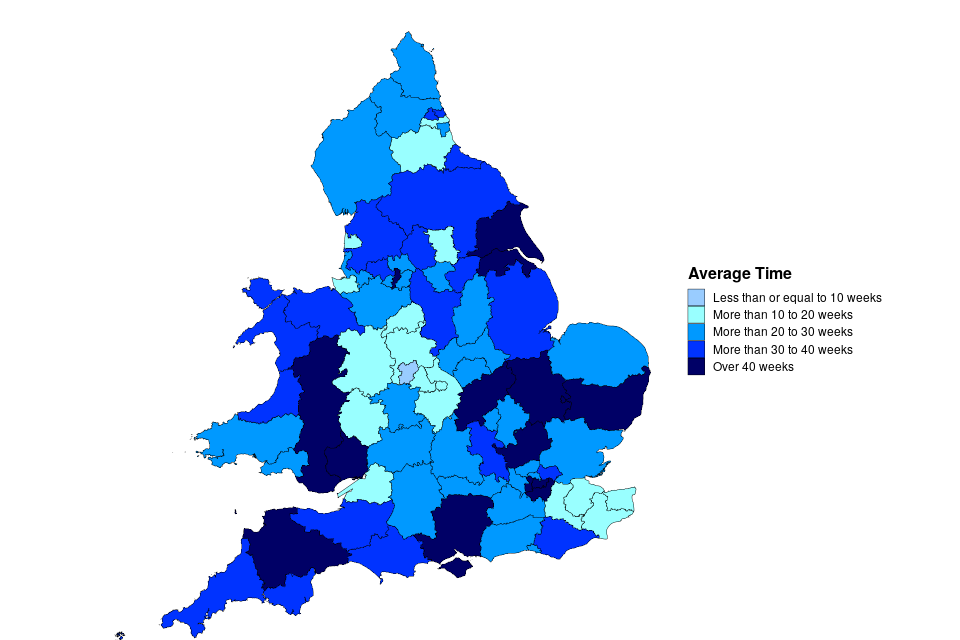
The time taken to process an inquest varies by coroner area - the maximum average time taken to process an inquest in 2022 was 72 weeks in North Lincolnshire and Grimsby, and the minimum average time was 9 weeks in the Black Country. This disparity between regions is mainly due to differences that exist from one coroner area to another. Some of these differences are:
-
Availability of resource, staff and judicial resources
-
The presence of facilities like hospitals and prisons situated near boundary lines
-
Socio-economic make up of regions
Therefore, a direct comparison between coroner areas is not advised.
Map 3 provides an overview of average time taken across coroner areas in England and Wales.
More information about how the average time taken has been estimated can be found in the Guide to coroner statistics published alongside this report.
Figure 8: Average time taken to process an inquest (in weeks), 2009-2022 (Source: Table 9)
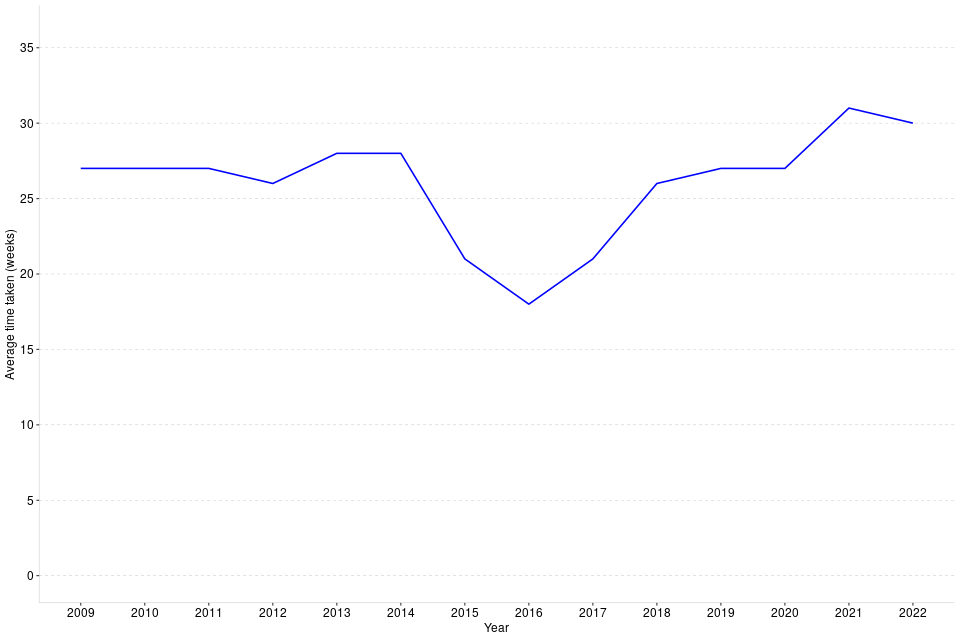
The decreases in time taken that occurred in 2015 and 2016 can largely be attributed to DoLS deaths where, in accordance with the Chief Coroner’s guidance, in uncontroversial cases, there could be a ‘paper inquest’, i.e. the Coroner in open court considered the evidence on the papers, which had been discussed in advance with the family (and interested persons) – this agreed process which usually did not require a post-mortem examination report took much less time to process and conclude – thus reducing the average time.
Map 3: Estimated average time taken to process inquests, England and Wales, 2022
11. Prevention of Future Death reports
There were 403 PFD reports issued by coroners in 2022, down 8% compared to 2021.
A Prevention of Future Deaths (PFD) report is written by a coroner following an inquest, if there is a concern (arising from the investigation) that circumstances creating a risk of other deaths will occur or continue in the future and that the coroner has formed the opinion that action should be taken to prevent that risk of death. A PFD report is issued to people or organisations to follow up on actions to reduce that risk.
There were 403 PFD reports issued in 2022. The organisations that received these include Department of Health and Social Care, NHS England and HM Prison and Probation Service.
Categories the reports covered included:
- Community healthcare
- Care Home Health related deaths
- Hospital Death (Clinical Procedures and medical management)
- Mental Health related deaths
All the coroner regions issued PFDs in 2022. The highest number issued was 74, by the North West region which also had the highest number of inquest conclusions. The North East region issued the fewest reports - 10. 15 coroner areas issued no PFDs in 2022. PFD reports and the responses to them must be copied to the Chief Coroner, who may publish them on the Judiciary website. The individual PFD reports issued can be found here.
12. Treasure and Treasure Trove
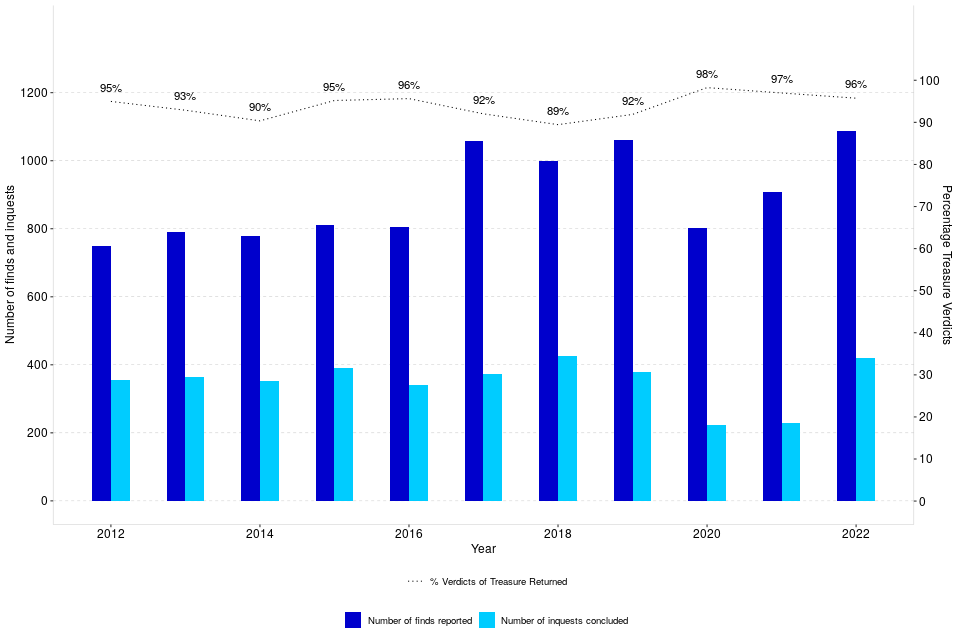
There was a 20% increase in Treasure finds[footnote 18] reported in 2022 and an 83% increase in inquest conclusions into finds
1,087 finds were reported to coroners in 2022, an increase of 179 on 2021. 419 inquests were concluded into finds. Of these, 96% (401) returned a verdict of treasure, a decrease in proportion by one percentage point when compared to 2021.
This report uses a definition of treasure whereby any newly discovered artefacts can only be legally classified as treasure if they are more than 300 years old and made of precious metal or part of a collection of valuable objects or artefacts. However, the Government has introduced a new definition of treasure which is due to be implemented from October 2023; this updated definition will mean objects of historical importance more than 200 years old and containing metal will now fit the criteria of ‘treasure’.[footnote 19]
In 2022, 1,087 finds were reported and 419 inquests were concluded. In addition, there was one inquest held into Treasure Trove in 2022 (relating to finds made before the Treasure Act 1996 came into force), and it is likely that a few such inquests will continue to be held from time to time, due to the decreasing prevalence of such cases.
The number of finds reported has historically been steadily increasing since the commencement of the 1996 Act in September 1997, from 54 finds in 1997 to 1,059 in 2017. Since 2018, however, the number has been more volatile and will have been impacted by restrictions in place during the covid-19 pandemic. There has been a big surge in metal detecting activity during (and also since) the pandemic. In 2022 the number of finds rose to 1,087 from 908 in 2021 (up 20%), likely due to the easing of pandemic restrictions. Number of inquests conclusions increased by 83% (from 229 in 2021 to 419 in 2022) likely due to the fact that treasure inquests were largely deprioritised during the pandemic.
Of those 419 inquests concluded in 2022, 96% (401) returned a verdict of treasure, a decrease in proportion by one percentage point compared to 2021.
Figure 9: Finds reported to coroners, treasure inquests held under the Treasure Act, and proportion of Treasure verdicts returned, 2012-2022 (Source: Table 10)[footnote 20]
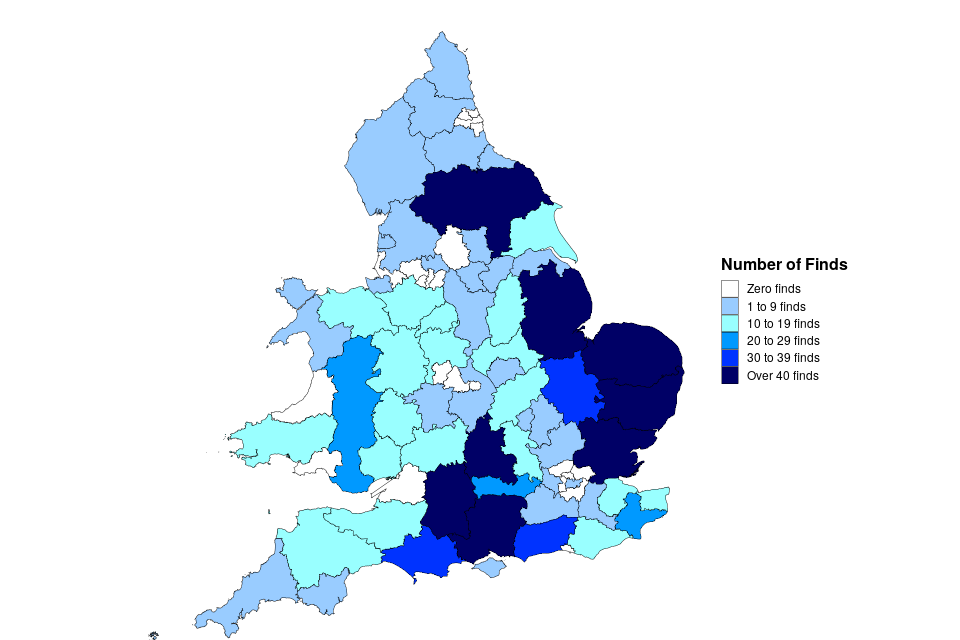
The number of finds and inquests held varies greatly across the country, most likely due to geographical and historical differences between areas. In 2022, 22 coroner areas had no treasure finds reported to them, whilst Norfolk had the highest number of treasure finds at 98. Map 4 shows treasure finds across England and Wales in 2022. More information about the duties of coroners to investigate treasure found within their jurisdiction and the provisions of the Treasure Act 1996 (and the previous Treasure Trove provisions) can be found in the supporting guidance.
Map 4: Number of treasure finds reported to coroners, England and Wales, 2022
13. Annex A: Details of recent Coroner Area amalgamations
The following table summarises the coroner area amalgamations that have occurred during 2022. There were no amalgamations in 2021. For a list of all historical amalgamations and changes to coroner areas, please refer to the supporting guidance document.
| Date effective | Previous Coroner Area | New Coroner Area | Nature of merge |
|---|---|---|---|
| 01-Apr-22 | York City; North Yorkshire (Eastern); North Yorkshire (Western) | North Yorkshire and York | 3 into 1 |
14. Annex B: Further analysis of deaths reported to coroners
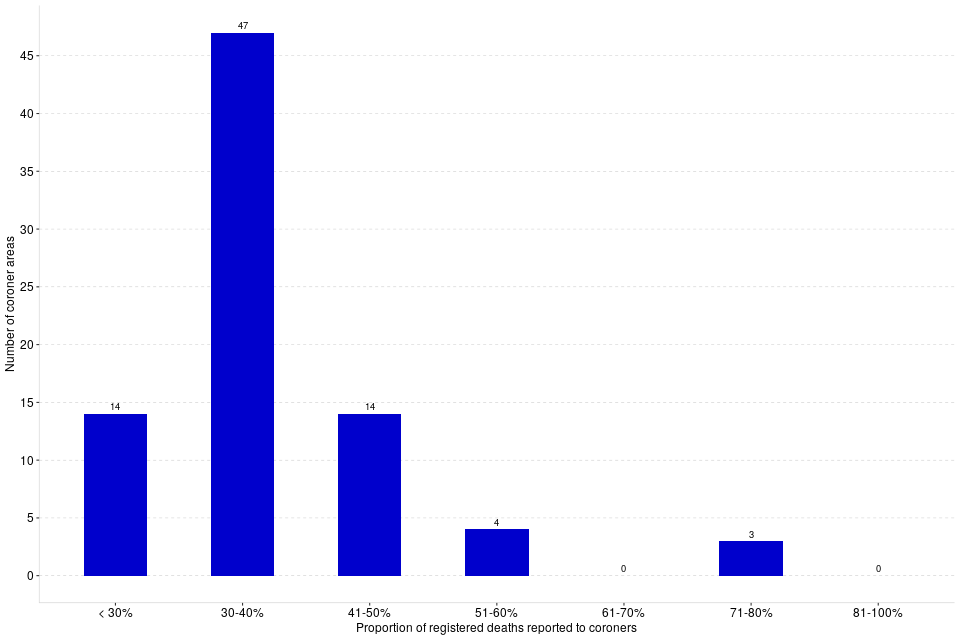
In 2022 the number of deaths reported to coroners as a proportion of registered deaths varied widely across coroner areas, from 23% in Exeter and Greater Devon to 76% in South Northumberland
The number of deaths reported to coroners in 2022 varied markedly by coroner area – from 255 in City of London to 6,612 in Hampshire, Portsmouth and Southampton. The number of deaths reported in each area will be affected by its size, resident population, demographic breakdown and profile, so comparisons of deaths reported to coroners across coroner areas should be treated with caution.
When looking at the number of deaths reported to coroners in 2022 as a proportion of registered deaths[footnote 21], which allow for some differences in population characteristics, there is still a wide variation across coroner areas, with a minimum of 23% in Exeter and Greater Devon compared to the maximum of 76% in South Northumberland. However, caution should be taken when using these figures as local area factors can influence these proportions. For example, large hospitals near boundary lines can impact the proportion, due to the difference between the coroners’ figures being based on the place of death and the ONS figures being based on the place of residence.
The rollout since April 2019 of the non-statutory medical examiner function may explain a reduction in the number of deaths reported to coroners in some areas.
Figure 10: Coroner areas split by the number of deaths reported to coroners in 2022 as a proportion of registered deaths (Source: Table 11)[footnote 22] [footnote 23]
15. Further Information
Revisions to statistics for previous years
The estimated figure for the number of registered deaths in 2021 which was derived from monthly data for the purposes of Table 2 in last year’s edition of this bulletin has now been replaced by the annual figure published by the Office for National Statistics.
Symbols and rounding convention
Within the ‘Key Findings’ sections, figures greater than 1,000 are rounded to the nearest 100. The following symbols have been used throughout the tables in this bulletin:
| n/a | = | Not applicable |
| - | = | Zero |
| .. | = | No data available |
| (p) | = | Provisional Data |
| (r) | = | Revised Data |
Accompanying files
-
This bulletin should be read alongside the statistical tables which accompany it. These tables are also available in an accessible format.
-
There is also a supporting comma-separated values file (CSV) to allow users to carry out their own analysis.
-
In addition to the bulletin and tables, we have published a coroners’ statistical tool. The tool provides easier access to local level data and allows the user to compare up to four areas of interest, for example, it is possible to compare a coroner area with a geographical region, England and/or Wales.
-
The accompanying guide to coroner statistics provides a more detailed overview of coroners; including the functions of coroners and the chief coroner, policy background and changes, statistical revision policies, and data sources and quality. It also includes a glossary with brief definitions for some commonly used terms.
-
The quality statement published with this guide sets out our policies for producing quality statistical outputs for the information we provide to maintain our users’ understanding and trust.
National Statistics Status
National Statistics Status means that official statistics meet the highest standards of trustworthiness, quality and public value.
All official statistics should comply with all aspects of the Code of Practice for Official Statistics. They are awarded National Statistics status following an assessment by the Authority’s regulatory arm. The Authority considers whether the statistics meet the highest standards of Code compliance, including the value they add to public decisions and debate.
It is the Ministry of Justice’s responsibility to maintain compliance with the standards expected for National Statistics. If we become concerned about whether these statistics are still meeting the appropriate standards, we will discuss any concerns with the Authority promptly. National Statistics Status can be removed at any point when the highest standards are not maintained, and reinstated when standards are restored.
Contact
Press enquiries should be directed to the Ministry of Justice or HMCTS press office:
Jack Robertson (MoJ) - email: Jack.Robertson@justice.gov.uk
Other enquiries about these statistics should be directed to the Courts and People division of the Ministry of Justice:
Rita Kumi-Ampofo or Matteo Chiesa - email: CAJS@justice.gov.uk
Next update: Thursday 9th May 2024
URL: www.gov.uk/government/collections/coroners-and-burials-statistics
© Crown copyright
Produced by the Ministry of Justice
For any feedback on the layout or content of this publication or requests for alternative formats, please contact cajs@justice.gov.uk
-
A change in the standard of proof for suicide was initiated in 2018 and applied by coroners from that point. It was ultimately “confirmed” by the Supreme Court’s judgement in the Maughan case in late 2020. ↩
-
Provisional figure based on ONS monthly death registration figures for 2022: https://www.ons.gov.uk/peoplepopulationandcommunity/birthsdeathsandmarriages/deaths/datasets/monthlyfiguresondeathsregisteredbyareaofusualresidence ↩
-
These data only represent deaths in custody which were referred to a coroner and subsequently reported to the Ministry of Justice in the coroner’s annual return. ↩
-
For further detail please see Figure 10 of ‘Monitoring the Mental Health Act in 2021/22’, available at the following link: https://www.cqc.org.uk/publications/monitoring-mental-health-act/2021-2022/our-activity-2021-2022 ↩
-
https://www.gov.uk/government/statistics/safety-in-custody-quarterly-update-to-december-2022 ↩
-
1995 is the first year of annual data collection. ↩
-
Schedule 1 to the Coroners and Justice Act 2009 states that the coroner should suspended an investigation in the event that criminal proceedings may or will take place. ↩
-
For years 2007-2013 this includes the previously used conclusions “Dependence on drugs” and “Non-dependent abuse on drugs” ↩
-
An analysis on unclassified conclusions can be found in the Coroners Statistics 2012 publication (Annex A), available at: www.gov.uk/government/statistics/coroners-statistics ↩
-
Total percentages may not equal 100% due to rounding ↩
-
‘All other conclusions’ includes: Killed lawfully; Killed unlawfully; Lack of care or self-neglect; Stillborn and represent together less than 1% of the short-form conclusions recorded. ↩
-
The sex of the deceased is based on the ‘registrable particulars’ which coroners have a duty to record. Death certificates only give two options, ‘male’ and ‘female’, and these will normally be completed by the registrar based on the information given to them by the informant. Under normal circumstances there would not be an investigation to ascertain whether what the informant says corresponds to biological sex or DNA of the deceased. ↩
-
Killed lawfully was excluded from above, as there was only 3 such inquest conclusions in 2022. ↩
-
ONS data is available online at: www.ons.gov.uk/peoplepopulationandcommunity/birthsdeathsandmarriages/deaths/datasets/deathsregisteredinenglandandwalesseriesdrreferencetables ↩
-
The ‘age not known’ category has been excluded from the chart due to small numbers (less than 0.5%). Totals may not add up to 100% due to rounding. ↩
-
A direct average of the time taken to process an inquest cannot be calculated from the summary data collected; an estimate has therefore been made instead. Please see the Guide to the Coroners statistics published alongside this report for the methodology used. ↩
-
Only deaths occurring within England and Wales are included in this estimation. ↩
-
The latest Department for Digital, Culture, Media & Sport (DCMS) figures are for 2021 and showed there were 1,079 finds reported in England and Wales, in line with the 908 treasure finds reported to Coroner Areas in 2021. These figures can be found at: https://www.gov.uk/government/statistics/statistical-release-for-reported-treasure-finds-2020-and-2021 ↩
-
Thousands more treasures to be saved for the nation as rules about discoveries are changed - GOV.UK (www.gov.uk) ↩
-
This chart does not include reported findings under “Treasure Trove” ↩
-
As the ONS death registration figures are based on the area of usual residence whereas the coroners’ figures are based on the area where a person died, these figures should be used with caution. For example, the coroner office for the City of London shows a distorted figure above 100% due to the low level of residence and high level of commuters. ↩
-
Provisional figure based on ONS monthly death registration figures for 2022 ↩
-
City of London has been excluded from this analysis due to the percentage of deaths being greater than 100% - please see footnote 20 above for further information. So only 82 coroner areas have been included in this analysis. ↩